How Many Tourists Visit Iceland Each Year? (2026 Data)
Iceland's tourism numbers: 2.3 million visitors per year, by month and nationality, with the full 30-year trend from official Statistics Iceland data.
- Published
- Updated
- 5 sources
- 20 statistics
- 9 min read

- M.Sc. in Atmospheric Sciences, University of Iceland (Háskóli Íslands), with a minor thesis on North Atlantic storm-track variability
- Former research assistant at the Icelandic Meteorological Office (Veðurstofa Íslands), working on subarctic climate modeling and volcanic-ash dispersion forecasting
- B.A. in Sociology, also from the University of Iceland, with fieldwork on rural depopulation and tourism's impact on small fishing communities (Westfjords focus)
- Grew up in Akureyri, spent seven years living in Reykjavík and two in a small village in the Westfjords - brings first-hand experience of Iceland's regional weather extremes and community life
- Fluent in Icelandic and English; has translated Icelandic Met Office public advisories for international outlets
- Published field notes and data-driven pieces on glacier retreat (Vatnajökull), aurora forecasting, and the socioeconomic effects of overtourism in the Golden Circle

- M.A. in Journalism, University of Iceland, with additional coursework in Environmental Communication at the University of Bergen (Norway), giving a comparative Nordic lens
- 12+ years in Icelandic media, including editorial roles at RÚV (Iceland's national broadcaster) covering weather-related public safety reporting (storms, volcanic eruptions, road closures)
- Former fact-checking lead for a travel-and-culture desk, specializing in verifying tourism statistics, safety advisories, and climate data against primary sources (Vedur.is, Statistics Iceland)
- Has overseen editorial standards for bilingual (Icelandic/English) publications, ensuring both cultural nuance and accuracy for international readers
- Advocate for citing primary sources (Icelandic Met Office, Icelandic Tourist Board / Ferðamálastofa) rather than secondhand reporting
Key findings
- 2.3MAbout 2.3M foreign tourists visited Iceland in 2024, triple the 2010 count.
- 8xKeflavik arrivals grew 8x from 342,921 in 1995 to the 2018 peak of 2,951,338.
- 6:1The visitors-to-residents ratio is about 6:1 - six tourists per Icelander per year.
- 92%Keflavik Airport handles 92% of all air passengers arriving in Iceland.
- 2.2xJuly arrivals average 2.2x January's, the widest seasonal gap in the calendar.
- 89%Foreign guests account for 89% of all hotel nights spent in Iceland.
Iceland received about 2.3 million foreign visitors in 2024 - a number that has tripled since 2010, when 742,579 arriving passengers passed through Keflavik1. For a country of 389,444 residents, that works out at roughly six visitors for every inhabitant every year, one of the highest tourists-per-capita ratios in the world2.
The growth has not been smooth. A volcanic eruption, a financial crash, a pandemic and a global travel boom have each left their mark on the arrival curve, and the recovery from each shock has been faster than the last. This page counts the visitors - by year, by month and by country - using the longest official series available: Statistics Iceland's register of passengers arriving at Keflavik Airport from 1995 to 20231.
How many tourists visit Iceland each year?
About 2.3 million3 foreign visitors came to Iceland in 2024, according to the Icelandic Tourist Board and Statistics Iceland's border data. That is the shortest honest answer to the question. The number has grown from 490,0003 foreign visitors in 2010, when the eruption of Eyjafjallajokull put Iceland on the front page of newspapers worldwide and the country's stopover marketing began to pay off3.
The official long-run measure is the count of passengers crossing Iceland's border. Statistics Iceland's aviation register (table FER90001) records every arriving passenger at Keflavik Airport month by month back to 1995, when the annual total was just 342,9211. Anyone asking how many tourists visit Iceland per year is therefore looking at a series that has multiplied more than eightfold in a generation: 342,921 passengers in 1995, 742,579 in 2010, 1,694,919 in 2015 and a peak of 2,951,3381 in 2018. The table of Iceland tourist numbers by year below traces the whole arc, including the pandemic trough of 597,956 passengers in 2020 and the recovery to 2,816,1201 in 20231.
Note the distinction between the two counts. The register includes Icelandic residents flying home, so it runs above the foreign-visitor figure; the 2.3 million headline counts only foreign visitors. Roughly three-quarters of Keflavik passengers are foreign citizens, a share that has been remarkably stable across boom, bust and recovery4. The growth behind both lines has a handful of identifiable drivers: the 2010 eruption, the 2008 currency crash that made Iceland suddenly affordable, the arrival of low-cost transatlantic carriers such as WOW Air and PLAY, and a wave of screen tourism after Game of Thrones and similar productions filmed on the island3.
Projection: linear trend of 1995–2023 yearly values, 95% prediction range. Our calculation, not a forecast.
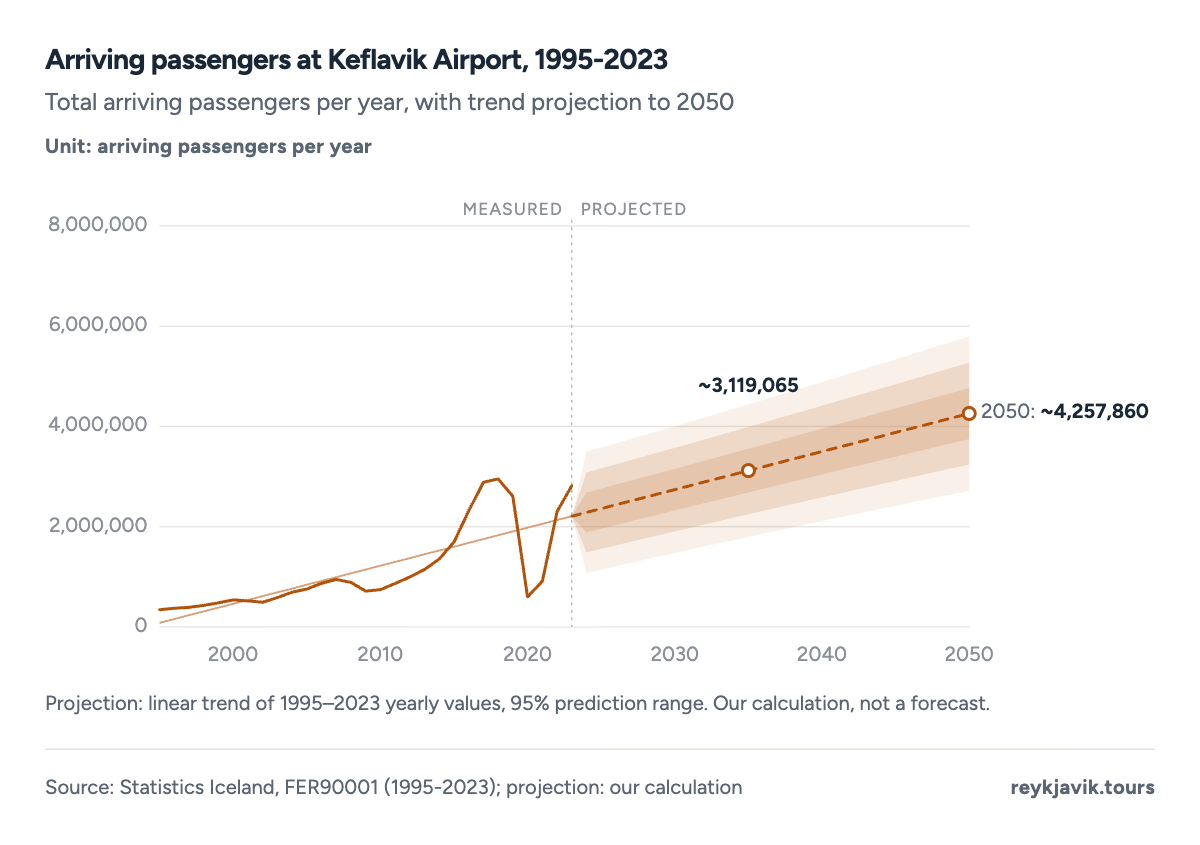
- Arrivals grew more than eightfold, from 342,921 in 1995 to a 2018 peak of 2,951,338.
- The 2020 pandemic collapse to 597,956 passengers is the sharpest dip in the series.
- The trend projection reaches roughly 4.3 million arrivals by 2050 - our calculation, not a forecast.
| 1995 | 342,921 |
| 1996 | 372,951 |
| 1998 | 430,529 |
| 2000 | 539,639 |
| 2002 | 493,643 |
| 2004 | 692,505 |
| 2006 | 868,042 |
| 2008 | 886,871 |
| 2010 | 742,579 |
| 2012 | 995,313 |
| 2014 | 1,358,332 |
| 2016 | 2,318,463 |
| 2018 | 2,951,338 |
| 2020 | 597,956 |
| 2022 | 2,301,765 |
| 2023 | 2,816,120 |
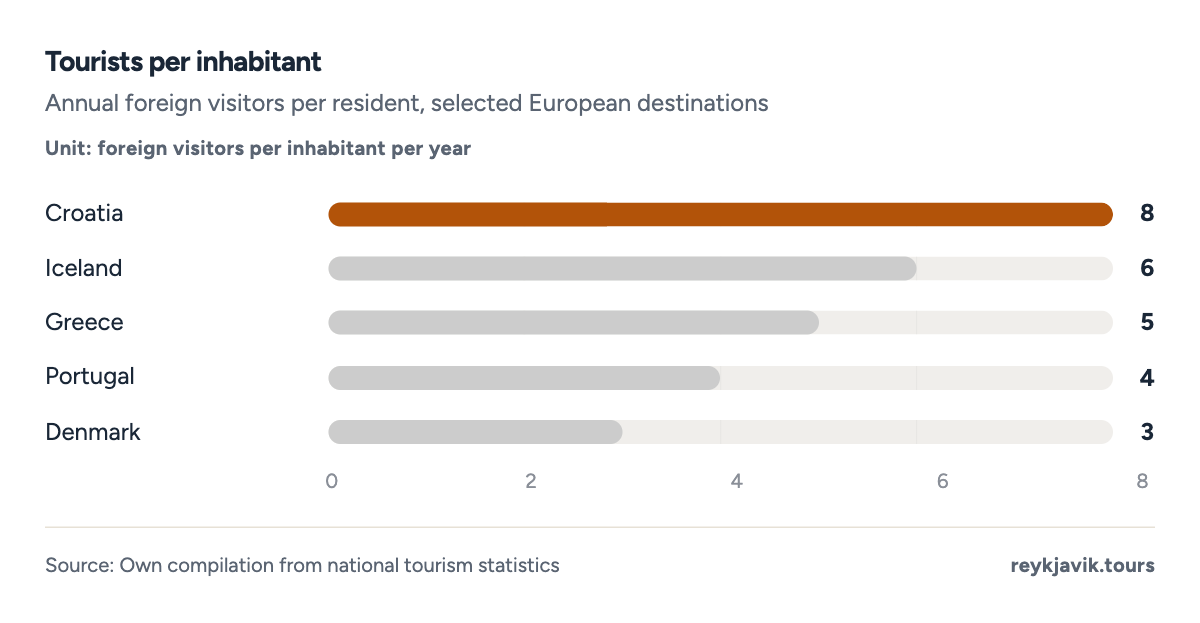
- Iceland's 6 visitors per inhabitant is among the highest ratios in Europe.
- Croatia leads with 8, but Iceland's ratio is built on a population of just 389,444.
| Population (1 January 2025) | 389,444 |
| Foreign visitors in 2024 | about 2.3 million |
| Visitors per inhabitant | about 6:1 |
| Busiest month (average) | July, 270,715 passengers |
| Quietest month (average) | January, 120,871 passengers |
Iceland tourists by month: the seasonal cycle
Monthly arrivals follow one of the clearest seasonal patterns in European travel. July is the peak, with an average of 270,7151 arriving passengers between 2015 and 2023, about 2.2 times the January average of 120,871. The midnight sun, the warmest weather of the year and the full opening of the highland roads concentrate demand in a five-month window from May to September that carries 52%2 of all arrivals1.
The off-season is quieter but never empty. January, the quietest month, still averages 120,8711 passengers - more than Iceland's entire population - because winter has its own draw: the northern lights, ice caves and the December holiday spike of 148,672 passengers that closes the year. April shows a small dip of its own (132,761 on average), a result of Easter timing shifting between March and April rather than any real drop in interest1.
For a traveller the season decides the price and the crowd, not whether the country is open. In July every rental car and hotel room in Reykjavik is contested by roughly 9,000 arrivals a day; in January the same infrastructure runs at less than half that load, and the aurora forecast becomes the most important document in your pocket2.
The seasonal curve is also a price curve. Accommodation rates in Reykjavik routinely double between January and July, and car hire follows the same shape, because fleets and room stock are sized for the summer peak and rationed by price in winter. Travellers who can shift a trip to the shoulder months keep most of the experience at noticeably lower cost: May averages 157,7821 arrivals and September 189,872, between 58% and 70% of the July peak, while prices step back from theirs. That pricing logic - pay summer prices for midnight sun, or winter prices for aurora - is the practical summary of everything the monthly chart shows2.
- 120,871JanJ
- 143,477FebF
- 150,235MarM
- 132,761AprA
- 157,782MayM
- 218,221JunJ
- 270,715JulJ
- 257,508AugA
- 189,872SepS
- 186,439OctO
- 144,137NovN
- 148,672DecD
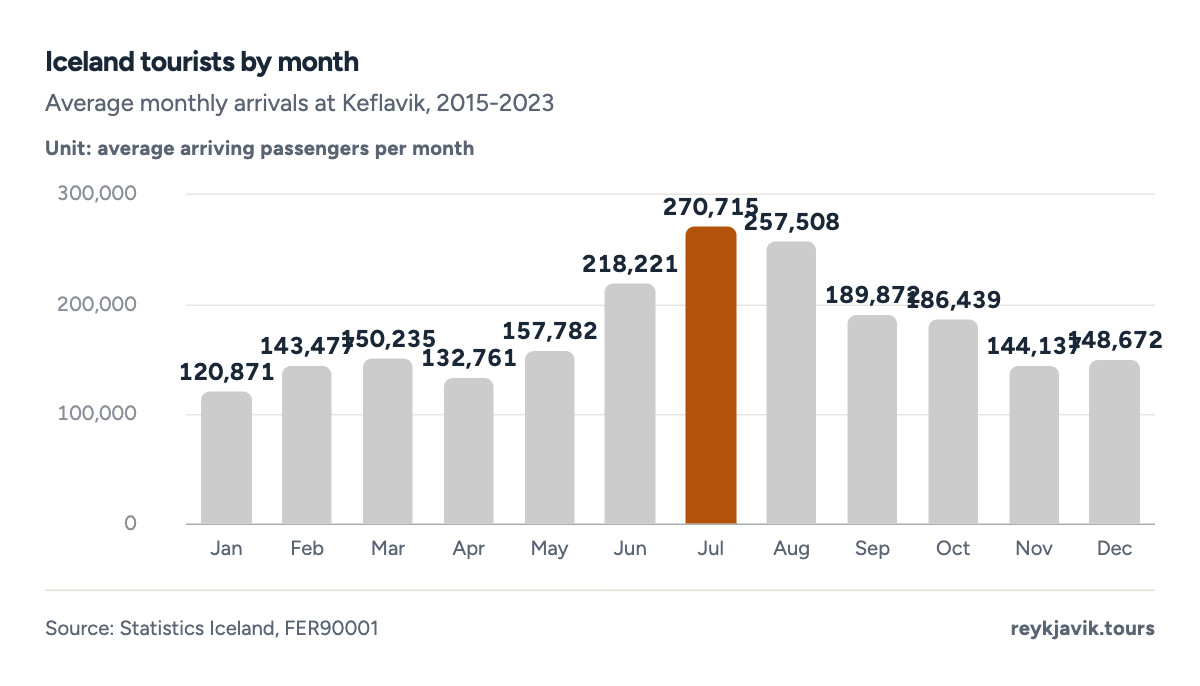
- July is the busiest month, averaging 270,715 passengers - 2.2 times January's 120,871.
- The five months from May to September carry 52% of all arrivals.
- January is the quietest month, but winter never falls to zero: aurora season keeps flights full.
| Jan | 120,871 |
| Feb | 143,477 |
| Mar | 150,235 |
| Apr | 132,761 |
| May | 157,782 |
| June | 218,221 |
| July | 270,715 |
| Aug | 257,508 |
| Sept | 189,872 |
| Oct | 186,439 |
| Nov | 144,137 |
| Dec | 148,672 |
Iceland tourists by country: where visitors come from
Statistics Iceland splits passengers by citizenship, and the mix is dominated by a short list of source countries. The United States is the single largest source market, followed by the United Kingdom, Germany and the Nordic neighbours - Denmark, Norway and Sweden - whose residents treat Iceland as a weekend distance rather than a long-haul trip4. Together these markets account for roughly half of all foreign arrivals, and their shares have been stable enough to plan hotels and flight schedules around.
Poland deserves special mention: it has grown fastest of the larger markets over the last decade, a reflection of both the large Polish community living in Iceland - which generates family visits alongside tourism - and rising leisure interest in the country4. The citizenship split also confirms what the headline numbers suggest: about three-quarters of Keflavik passengers are foreign citizens, while Icelandic traffic flies in a predictable rhythm shaped by holidays and family events rather than by the tourism cycle4.
Source markets also keep their own seasons. American visitors concentrate in the summer half-year, when direct flights from multiple US cities feed the ring-road rental-car circuit, while the Nordic and British markets travel more evenly across the calendar and carry the winter aurora season almost on their own. That mix matters for the industry: the summer peak is largely a transatlantic phenomenon, so it moves with US airline capacity and the dollar exchange rate, while the winter baseline depends on European short-break demand and on the reliability of the northern lights themselves4.
The foreign dominance is even clearer where visitors sleep. Foreign guests account for 89%4 of all hotel nights registered in Iceland, which means the tourism economy - hotels, restaurants, rental cars, day tours - is built almost entirely on inbound demand rather than domestic travel4.
| 2010 | Eyjafjallajokull eruption puts Iceland on the map; arrivals begin to climb |
| 2012 | Low-cost transatlantic routes open with WOW Air and, later, PLAY |
| 2015 | Tourism overtakes aluminium and seafood as Iceland's largest export sector |
| 2018 | Peak year at Keflavik: 2,951,338 arriving passengers |
| 2020 | COVID-19 pandemic: arrivals fall 77% in a single year |
| 2023 | Recovery: 2,816,120 passengers, above the 2019 level |
How many tourists visited Iceland in 2023?
2,816,1201 passengers arrived at Keflavik in 2023, the highest total since the 2018 peak and 8% above the 2019 pre-pandemic level. Counted as foreign visitors only, the 2023 figure lands just above 2.1 million, based on the stable three-quarters foreign share of passengers4. The recovery was driven by restored airline capacity - transatlantic routes returned faster than anyone in the industry expected in 2021 - and by a krona that spent much of the period weak enough to make Iceland competitively priced against Western Europe3.
The same question for the newest year - how many tourists visited Iceland in 2025 - is already the most common variant in search, and the answer follows the same mechanism. Statistics Iceland publishes final annual counts with a lag, while Isavia's monthly traffic reports fill the gap in real time; the structural drivers (airline capacity, exchange rates and global travel demand) all point to the plateau around 2.3 million foreign visitors per year holding rather than reversing3. When the final 2025 count is published it will simply extend the series shown in the chart above.
Airport capacity is the physical constraint on the whole series. Keflavik's terminal expansion and the arrival of low-cost carriers set the ceiling that marketing works beneath, and both currently point the same way: more seats to Iceland, not fewer3.
The COVID collapse and the recovery
The pandemic erased three-quarters of Iceland's inbound traffic in a single year. Arrivals at Keflavik fell from 2,604,9001 passengers in 2019 to 597,956 in 2020 - a collapse of 77%2 that reduced one of Europe's most tourism-dependent economies to a trickle in weeks. The dependency became brutally visible: tourism accounted for around 8-9% of GDP before the pandemic, and every percentage point of that vanished overnight3.
The recovery was faster than the fall. 2021 brought 914,110 passengers back, 2022 more than doubled that to 2,301,765, and by 2023 the register showed 2,816,120 arrivals - above the 2019 level within three seasons1. Hotels reopened, airlines restored routes within months, and the weakened krona acted as a discount coupon for foreign visitors, accelerating the return3.
The lesson of the COVID period matches the lesson of the 2010 eruption: Iceland's tourism demand is postponed, not destroyed. After Eyjafjallajokull's ash cloud shut European airspace for a month, arrivals dipped for a single season and then surged for eight consecutive years. The desire to see glaciers, volcanoes and the aurora survived both disasters intact1.
No other export sector of comparable size has been switched off and restored so quickly: aluminium smelters cannot reopen in three seasons, but flights and hotel rooms can. That elasticity is both Iceland's advantage and its exposure - the same speed that rebuilt the industry in 2021-2023 would transmit any future travel shock just as fast2.
Tourism spending: what visitors are worth
Foreign visitors spent approximately ISK 540 billion3 in Iceland in 2024 - roughly $4.2 billion2 - a sum that makes tourism one of the country's largest export sectors alongside aluminium and seafood. The spending collapsed to ISK 150 billion in 2020, recovered through 480 billion in 2022 and 510 billion in 2023, and by 2024 had moved above its pre-pandemic level of 520 billion3. Visitors pay for accommodation, food, transport, recreation and shopping, and the sector employs around 26,000 people directly, one of the largest workforces in the country3.
Tourism's share of GDP tells the same story in percentages: from about 4% in 2010 to a peak of 8-9% before the pandemic, settling near 6-7% after the recovery3. That trajectory is why annual visitor count is watched so closely by the central bank and the treasury: the difference between a 2-million and a 3-million visitor year moves the entire economy, from Keflavik staffing rosters to Reykjavik hotel construction2.
The economic concentration also explains the policy debate. Overtourism concerns in Reykjavik and at fragile sites such as Reynisfjara have pushed governments to spread visitors seasonally and geographically - and the monthly data above shows exactly what they are working against: a demand curve that doubles between winter and summer3.
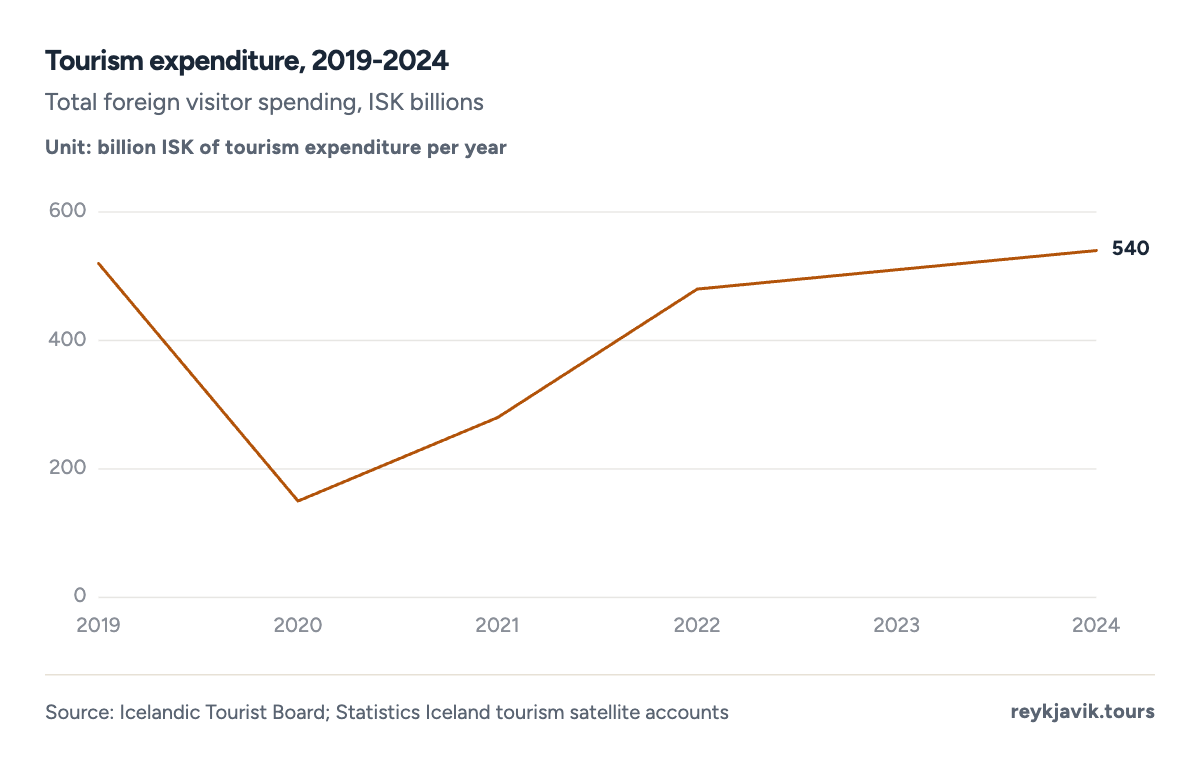
- Expenditure collapsed from ISK 520 billion in 2019 to ISK 150 billion in 2020.
- By 2024 spending reached ISK 540 billion, above pre-pandemic levels.
| 2019 | 520 |
| 2020 | 150 |
| 2021 | 280 |
| 2022 | 480 |
| 2023 | 510 |
| 2024 | 540 |
Frequently asked questions
How many tourists in Iceland?
About 2.3 million3 foreign visitors per year as of 2024. Counting all passengers (including returning Icelanders), Keflavik Airport registered 2,816,120 arrivals in 2023, and the peak year to date is 2018 with 2,951,3381.
How many tourists in Iceland right now?
The register is published monthly, so there is no live counter - but the rhythm is predictable. On an average July day about 8,7002 passengers land at Keflavik, while an average January day brings closer to 3,900. At any moment in midsummer, roughly 30,000-40,000 foreign visitors are in the country at once; in midwinter the figure falls by well over half2.
Does the count include Icelanders flying home?
No. The headline 2.3 million counts foreign visitors only. The Keflavik register used for the long-run chart counts every arriving passenger, and about three-quarters of them are foreign citizens - that stable share is what allows the two series to be reconciled4.
Which year had the most tourists?
2018 remains the record in the register, with 2,951,3381 arriving passengers at Keflavik - set before the pandemic and approached, but not beaten, by 2023's 2,816,120. Counted as foreign visitors only, the best post-pandemic seasons land near 2.1 million, using the stable three-quarters foreign share of passengers4.
Conclusions
- About 2.3 million foreign tourists visit Iceland each year as of 2024 - triple the 2010 count and equal to roughly six visitors for every resident3.
- The long-run register shows an 8x multiplication: from 342,921 arriving passengers in 1995 to a 2018 peak of 2,951,338, with 2023 at 2,816,1201.
- Seasonality is real but survivable: July averages 270,715 arrivals against January's 120,871, and the May-September window carries 52% of the year1.
- The COVID collapse of 77% was fully recovered within three years, confirming that Iceland's tourism demand is postponed rather than destroyed1.
- Foreign visitors spend about ISK 540 billion a year and fill 89% of hotel nights, making tourism a structural pillar of the Icelandic economy rather than a bonus sector4.
Methodology
- Keflavik arrivals: 1995-2023, monthly (Statistics Iceland FER90001)
- Passengers by citizenship and hotel nights: Statistics Iceland SAM02000, SAM01201
- Foreign visitor totals and expenditure: 2010-2024 (Icelandic Tourist Board, Isavia)
Definition. A 'tourist' here means a foreign visitor arriving in Iceland and staying at least one night. The Keflavik arrivals series (FER90001) counts all arriving passengers, including Icelandic residents flying home; the two series are reconciled through the roughly three-quarters foreign share of passengers.
Data sources. Statistics Iceland FER90001 (Keflavik arrivals by month, 1995-2023); SAM02000 (passengers by citizenship); SAM01201 (hotel nights by nationality); Icelandic Tourist Board visitor and expenditure reports; Isavia monthly traffic statistics.
Calculations. Monthly averages are computed over 2015-2023. The 6:1 per-capita ratio divides the 2.3 million foreign visitors by the population of 389,444 (1 January 2025). Percentage changes are computed from the FER90001 totals. The projection is an ordinary least-squares trend with a 95% prediction interval, computed by the renderer; it is a trend extrapolation, not a forecast.
Limitations. FER90001 counts arriving passengers only, so it includes Icelandic residents and runs above the foreign-visitor count. Pre-2015 expenditure figures come from successive tourism satellite accounts with changing methodology. Figures for 2024 come from tourist board and Isavia reports that may be revised; final counts for 2025 were not yet published at the time of writing.
Sources
- Statistics Iceland. “Passengers arriving at Keflavik Airport by month, 1995-2023 (FER90001).” Statistics Iceland, 2024. px.hagstofa.is. Accessed 2026-09-17. Back to text
- Reykjavik Tours. “Own calculations (labelled).” own calculation, 2026. reykjavik.tours. Accessed 2026-09-17. Back to text
- Icelandic Tourist Board / Isavia. “Tourism figures and expenditure reports (labelled).” Icelandic Tourist Board; Isavia monthly traffic reports, 2025. ferdamalastofa.is. Accessed 2026-09-17. Back to text
- Statistics Iceland. “Passengers by citizenship (SAM02000) and foreign share of hotel nights (SAM01201).” Statistics Iceland, 2024. px.hagstofa.is. Accessed 2026-09-17. Back to text
- Statistics Iceland. “Population key figures (MAN00000).” Statistics Iceland, 2026. px.hagstofa.is. Accessed 2026-09-17. Back to text
About the author
Laufey turns public statistics on tourism and travel into research people can check and cite.
Every figure on this page links to its source. How we research
Related research
More data on Iceland's weather and travel from Reykjavik Tours.
- EconomyIceland GDP per Capita: Nominal, PPP and Ranking (2026 Data)$98,323 GDP per person in Iceland, 2025Read the research →
- HousingAverage Rent in Iceland (2026 Data)ISK 269k average monthly rent in IcelandRead the research →
- HousingHow Much Is a House in Iceland? (2026 Data)$467k-779k typical capital-region apartmentRead the research →
- TransportHow Many Airports in Iceland? (2026 Data)33 airports in IcelandRead the research →
- Travel costsHow Much Are Hotels in Iceland? (2026 Data)$196 a night for a typical hotel roomRead the research →
- EconomyAverage Salary in Iceland (2026 Data)$8,242 average monthly salary, full-timeRead the research →