How Much Is a House in Iceland? (2026 Data)
House prices in Iceland: the capital-region bracket in ISK and USD, the Eurostat index 2005-2025, mortgage rates, land and apartments - sourced and labelled.
- Published
- Updated
- 7 sources
- 17 statistics
- 10 min read

- M.Sc. in Atmospheric Sciences, University of Iceland (Háskóli Íslands), with a minor thesis on North Atlantic storm-track variability
- Former research assistant at the Icelandic Meteorological Office (Veðurstofa Íslands), working on subarctic climate modeling and volcanic-ash dispersion forecasting
- B.A. in Sociology, also from the University of Iceland, with fieldwork on rural depopulation and tourism's impact on small fishing communities (Westfjords focus)
- Grew up in Akureyri, spent seven years living in Reykjavík and two in a small village in the Westfjords - brings first-hand experience of Iceland's regional weather extremes and community life
- Fluent in Icelandic and English; has translated Icelandic Met Office public advisories for international outlets
- Published field notes and data-driven pieces on glacier retreat (Vatnajökull), aurora forecasting, and the socioeconomic effects of overtourism in the Golden Circle

- M.A. in Journalism, University of Iceland, with additional coursework in Environmental Communication at the University of Bergen (Norway), giving a comparative Nordic lens
- 12+ years in Icelandic media, including editorial roles at RÚV (Iceland's national broadcaster) covering weather-related public safety reporting (storms, volcanic eruptions, road closures)
- Former fact-checking lead for a travel-and-culture desk, specializing in verifying tourism statistics, safety advisories, and climate data against primary sources (Vedur.is, Statistics Iceland)
- Has overseen editorial standards for bilingual (Icelandic/English) publications, ensuring both cultural nuance and accuracy for international readers
- Advocate for citing primary sources (Icelandic Met Office, Icelandic Tourist Board / Ferðamálastofa) rather than secondhand reporting
Key findings
- $467k-779kA typical capital-region apartment sells for $467k-779k (ISK 60-100M).
- 263.1Iceland's house price index reached 263.1 points in 2025, with 2015 as the 100 base.
- +163%House prices rose +163% in the decade since 2015, and over 4x since 2005.
- +5.1%House price growth cooled to +5.1% in 2025, down from the 2022 boom peak of +21%.
- 8%Iceland's central bank policy rate stands at 8%, the key cost of mortgage money.
- 31%About 31% of capital-region apartments for sale are priced above ISK 100 million.
How much is a house in Iceland? There is no official "average house price" statistic - Iceland publishes an index, not a list price - so this page combines the two honest sources that exist: the Eurostat house price index, which tracks what has happened to prices, and quoted market brackets, which say where they stand now. The current answer for the capital region: a typical apartment lists between ISK 60 and 100 million - roughly $467,000 to $779,0001.
The trend behind the bracket is one of the steepest in Europe. Nominal prices have risen more than four-fold since 2005, with a single crash - 2008-09 - interrupting a two-decade climb2. Below: the index year by year, the same history translated into kronur and dollars, the bracket split of what is actually for sale, and the interest-rate context that sets monthly payments.
How much does a house cost in Iceland?
Because Iceland registers every sale but publishes no average, the market answer is a bracket: capital-region apartments for sale cluster between ISK 60 and 100 million - about $467,000-779,0001 at the 2025 average exchange rate - and just under a third of listings in the capital region now sit above ISK 100 million1. Outside the capital the average runs visibly lower, with countryside singles and older farmhouses starting well below the capital bracket1.
For US readers converting: "how much is a house in Iceland in US dollars" has a moving answer - the ISK price is fixed by the market, the dollar figure floats with the krona, and the krona lost enough value in 2022-2024 to make dollar prices visibly cheaper without a single ISK price changing3.
- ISK 60-100M ($467-779k)53%53%
- Above ISK 100M ($779k+)31%31%
- Below ISK 60M ($467k)16%16%
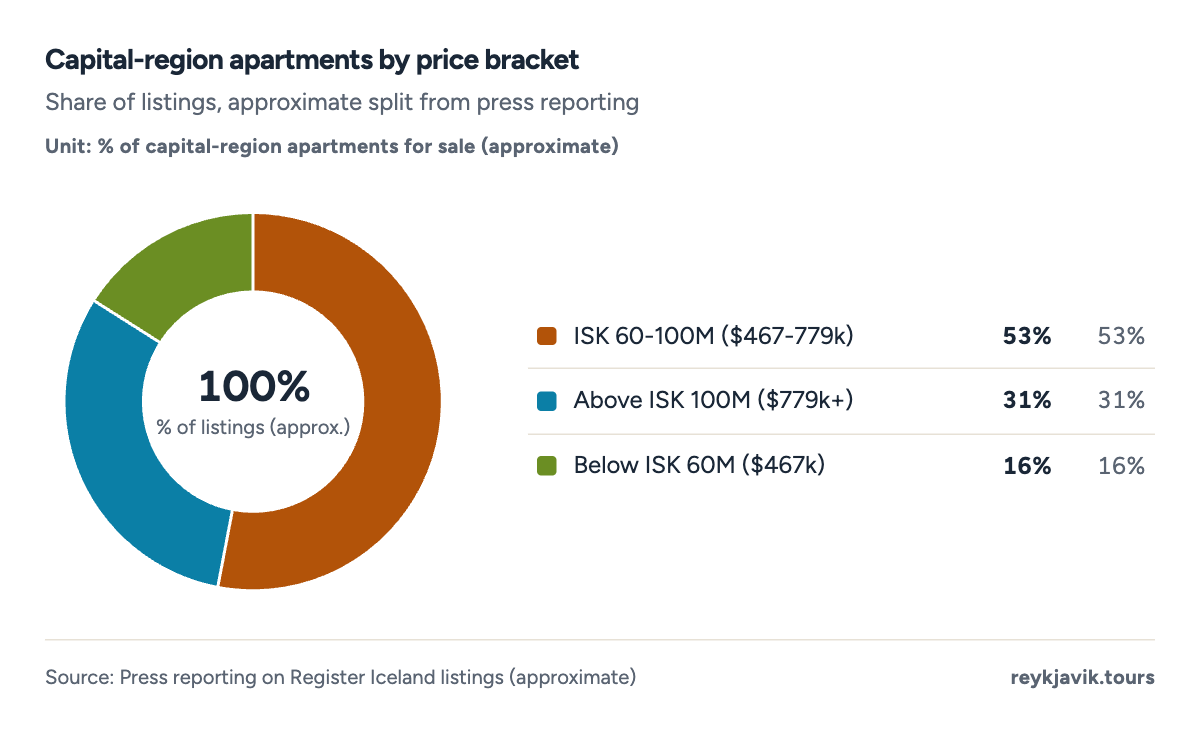
- More than half of capital-region listings sit between ISK 60 and 100 million.
- Nearly a third of apartments for sale are priced above ISK 100 million.
- Budget listings below ISK 60M are the scarce end of the market.
| ISK 60-100M ($467-779k) | 53 |
| Above ISK 100M ($779k+) | 31 |
| Below ISK 60M ($467k) | 16 |
Average house price in Iceland: the index story
The average house price Iceland 2025 discussions all lean on the Eurostat index, which stood at 263.12 in 2025 with 2015 = 100 - prices have risen 163%2 in a decade and more than four-fold since 2005. The index also holds the market's one memory of failure: the 2008-09 financial crisis, when prices fell for the only year in the series before the 2016-2022 boom took over2.
Translated into kronur, the index implies the average dwelling cost roughly ISK 18-19M4 in 2005, crossed ISK 50M around 2017 and stands near ISK 80M today - our back-calculation from the quoted bracket, labelled as such because the anchor is a market range, not a measured mean4.
Projection: linear trend of 2005–2025 yearly values, 95% prediction range. Our calculation, not a forecast.
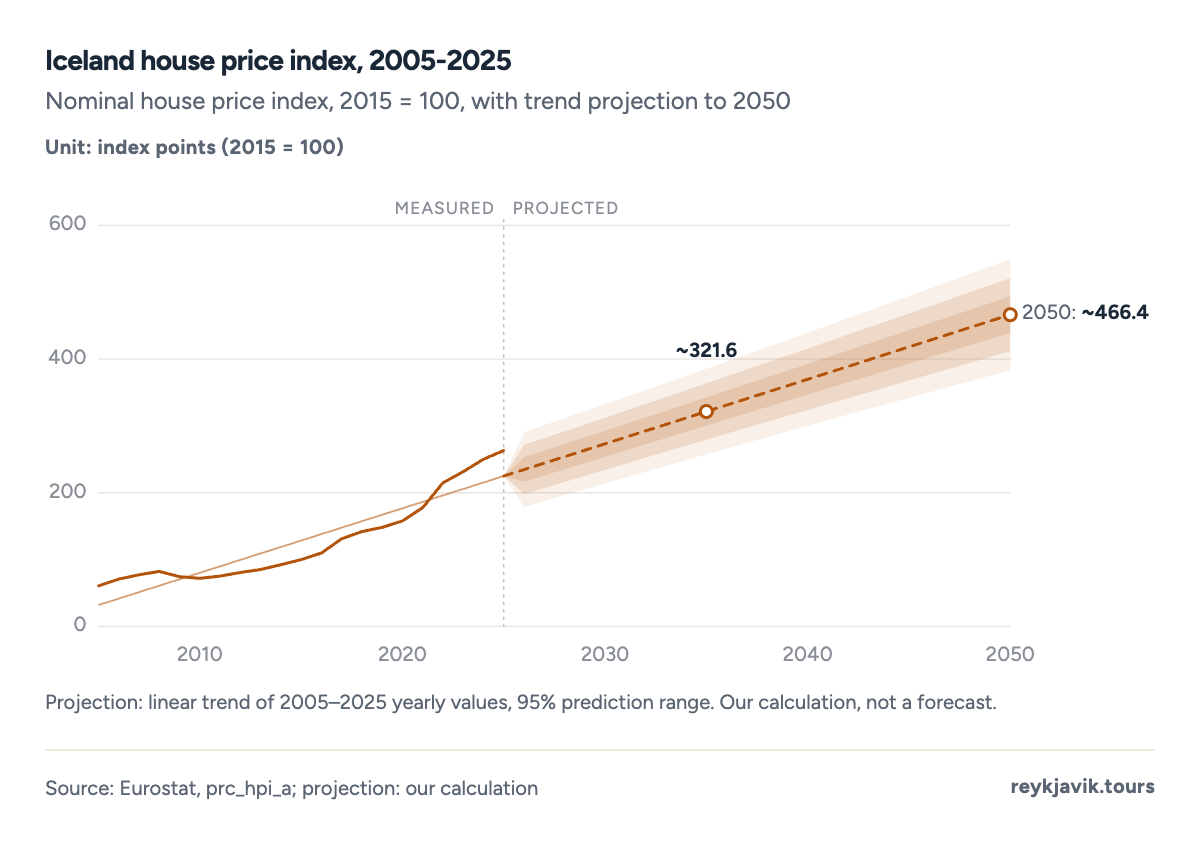
- Nominal prices rose 4.3-fold since 2005: 60.6 to 263.1 index points.
- The 2008-09 crash is visible as the only dip in the series.
- The projection passes 350 index points before 2040 - our calculation, not a forecast.
| 2005 | 60.6 | None |
| 2006 | 70.8 | 16.8 |
| 2010 | 72.0 | −3.1 |
| 2015 | 100.0 | 8.2 |
| 2020 | 157.8 | 6.4 |
| 2025 | 263.1 | 5.2 |
Projection: linear trend of 2005–2025 yearly values, 95% prediction range. Our calculation, not a forecast.
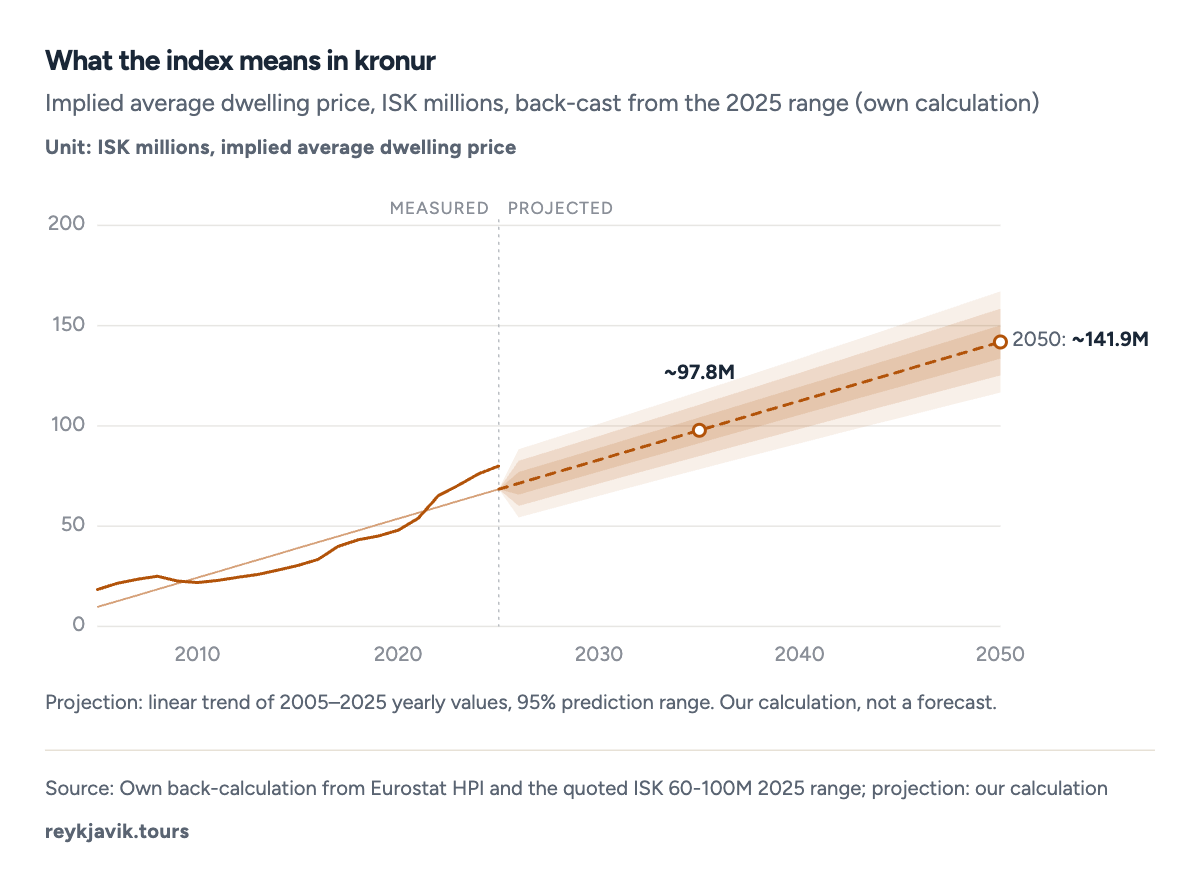
- The implied average dwelling price crossed ISK 50M around 2017.
- The same index implies an average of about ISK 18-19M in 2005.
| 2005 | 18.4 | 143 |
| 2010 | 21.9 | 171 |
| 2015 | 30.4 | 237 |
| 2020 | 48.0 | 374 |
| 2025 | 80.0 | 623 |
Year by year: crashes, booms and the 2022 spike
The year-on-year series is the market's biography. The 2000s boom ran at +9-14% a year until the crisis produced -8%2 in 2009; the 2010s opened flat, then accelerated into the tourism-era boom; 20222 delivered the fastest rise in the series at about +21% as inflation and supply shortages fed into construction; and by 20252 growth had cooled to +5.1% - historically normal, no longer boom-like2.
That cooling is the honest headline for 2026 buyers: after three years of increases well above wage growth, the gap between house-price inflation and pay has narrowed, which is exactly what a market looks like when it stops being a one-way bet2.
The series also carries a warning about averages. The index is nominal, so it says nothing about real affordability - 2022's +21% arrived in a year when Icelandic inflation ran near 10%, meaning real prices rose far slower than the headline, and some years the real index actually fell. Anyone comparing Iceland's curve with another country's should compare the real series, or better, compare months of average wages needed to buy a square metre - the only metric first-time buyers actually feel2.
The series also carries a warning about averages. The index is nominal, so it says nothing about real affordability - 2022's +21% arrived in a year when Icelandic inflation ran near 10%, meaning real prices rose far slower than the headline, and some years the real index actually fell. Anyone comparing Iceland's curve to another country's should compare the real series, or better, compare months of average wages needed to buy a square metre - the only metric first-time buyers actually feel2.
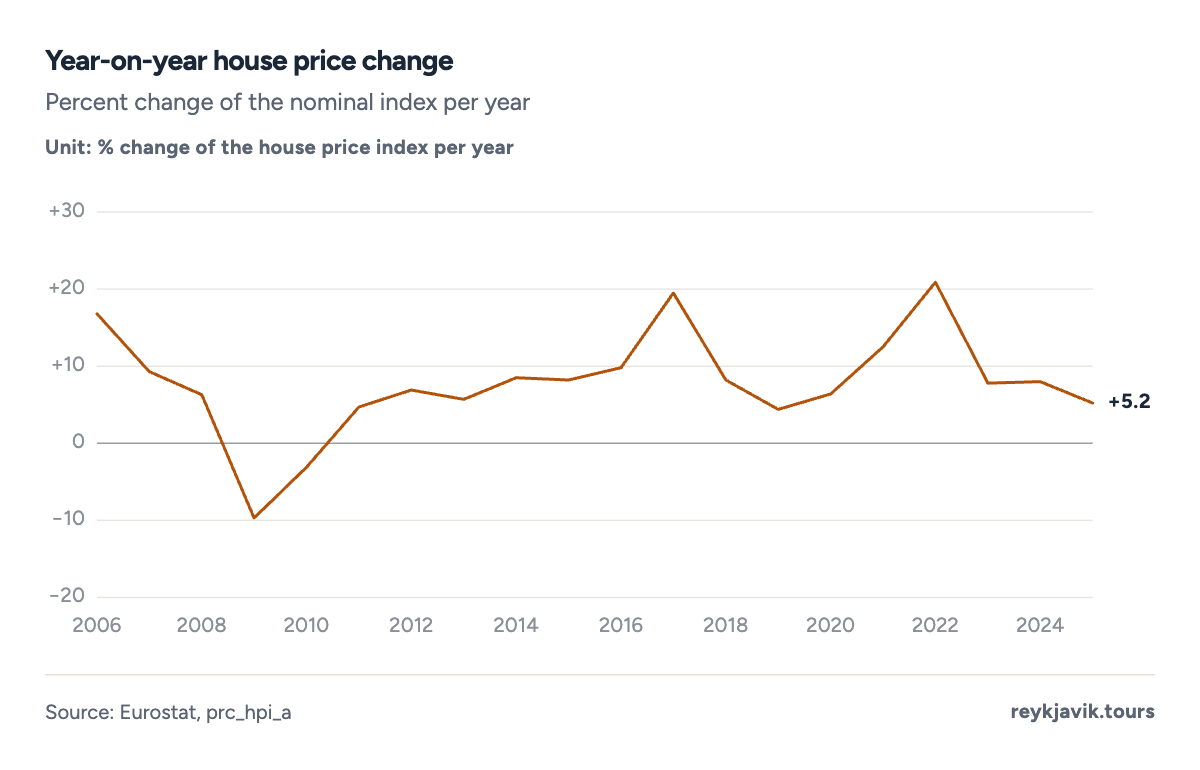
- The 2008-09 financial crisis produced the only negative year, about -8%.
- 2022 was the fastest year in the series at about +21%.
- Growth cooled to +5.1% by 2025 - fast, but no longer boom levels.
Mortgage rates in Iceland
Searches for the average mortgage interest rate Iceland 2025 editions quote the Central Bank's policy rate: 8%5 - high by eurozone standards. The Central Bank's policy rate stood at 8%5 in 2026, and the 1998-2026 average is 6.86%5 - with a historical peak of 18% after the 2008 crisis5. Housing Fund (HÍS) loans for first-time buyers carry state-supported rates below the commercial banks' offers, and most Icelandic mortgages are inflation-indexed, which changes the arithmetic: the nominal rate is lower, but the principal rises with inflation5.
For a buyer converting from dollars, the practical summary: budget an all-in rate around 6-8%, expect inflation-indexing in the small print, and remember that rent versus buy comparisons in Iceland usually favour buying for anyone staying more than a handful of years5.
| Central Bank policy rate, 2026 (%) | 8 |
| Average policy rate 1998-2026 (%) | 6.86 |
Who can actually buy
Iceland's first-time-buyer pipeline runs through the Housing and Construction Authority (HÍS): state-backed loans with below-market rates and capped principal, available to buyers who do not own other housing. The commercial banks and pension funds compete for the rest, and pension-fund mortgages have grown into the largest lending channel - a peculiarity of Icelandic finance where retirement money funds the housing stock5.
The buyer base has visibly changed in a decade. Foreign citizenship purchases remain a small share by rule and custom, but dollar- and euro-earning remote workers discovered Iceland during the pandemic years and now appear in the capital's listings; domestic first-time buyers, by contrast, are buying later - press reporting shows the under-30 share of purchases falling as prices outran entry wages1. The political consequence is visible: housing is the standing first topic of every Icelandic election cycle.
What a budget buys, in practice
At the bracket's lower end - ISK 60M, about $467,000 - a buyer chooses between a small capital-region flat with a bus commute and a genuine house in a regional town. At the mid-point (ISK 80M, ~$623,000), the capital offers 70-90 m2 two-room flats in Breiðholt or a townhouse in the commuting belt; at ISK 100M and beyond the west-side 1930s flats and new Westurbær builds open up, and past ISK 150M the market becomes bespoke - west-side garden flats, the odd waterfront house, and new builds in Kópavogur's hillsides1. Between the brackets, remember that Icelandic flats almost always sell unfurnished but with geothermal heating piped in, which removes the single scariest line item of a Nordic winter: nobody in Iceland pays to heat their home the way Oslo or Helsinki does1.
New construction carries its own premium and its own waiting list; the secondary market is where most transactions happen. Energy is never the worry - geothermal heating is piped in - but parking, lift access and balcony orientation are the features that visibly move prices between seemingly identical flats1.
Land, apartments and the biggest house
How much is land in Iceland? There is no official per-hectare statistic, and the range is enormous - building plots in Reykjavík's suburbs and lakeside farmland in the east are different markets. Registered land sales outside towns have historically cleared at low six-figure dollar amounts for hobby-farm parcels, with road access and views doing the price discovery1.
How much is an apartment in Iceland? The bracket above answers for the capital: most listings between $467k and $779k, with a third above three-quarters of a million dollars. Regional towns - Akureyri, Reykjahlíð aside - run visibly cheaper per apartment than the capital bracket1.
And the biggest house in Iceland? There is no public register ranking private homes, so the claim usually goes to the presidential residence Bessastaðir or to grand new constructions on the Reykjavík golf borders - architectural gossip, not statistics4.
Two quirks of the Icelandic completion process are worth knowing before numbers are compared with other countries. Sales are registered with the District Commissioner and carry a statutory valuation used for taxes that can lag the market; and the listed asking price in the countryside is more negotiable than in the capital, where multiple-bid situations have become common on anything fairly priced1.
For the land question the practical advice is to buy location, not acreage. A hectare of lava field with no road frontage is close to worthless; a quarter-hectare with a View, a sewer connection and thirty minutes from a school can outprice it tenfold. Registered land sales outside the municipalities clear in the low thousands of dollars per hectare, while serviced building plots inside the capital's orbit trade in the hundreds of dollars per square metre - a spread so wide that "how much is land" has no single honest answer beyond location, location, location1.
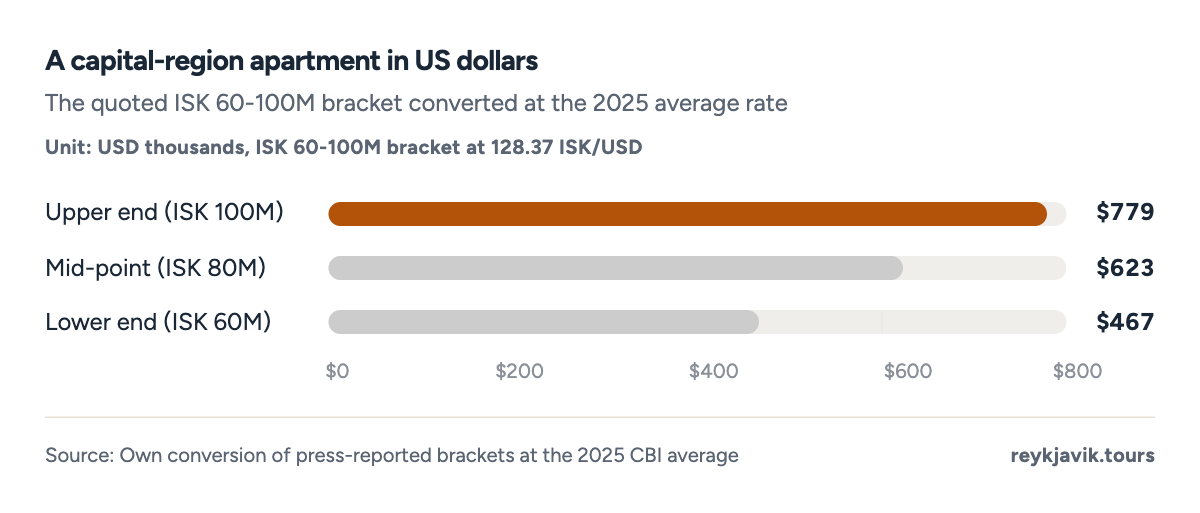
- The quoted bracket spans roughly $467,000 to $779,000.
- The $623,000 mid-point is about ISK 80M.
- Conversions use the 2025 average rate, so daily-rate moves shift the dollar figures.
Reykjavik against the regions
Iceland's housing market is really two markets. The capital region - Reykjavik, Kópavogur, Garðabær, Hafnarfjörður, Mosfellsbær and Seltjarnarnes - holds most of the jobs, most of the apartments and nearly all of the price growth; the countryside and the regional towns run on a slower clock, with prices anchored to local wages rather than to international comparisons. The bracket split above is a capital-region bracket: applying it to Akureyri or Vestmannaeyjar overstates what a buyer needs there1.
Distance trades against price in a remarkably linear way. Along the ring road, an hour of driving from the capital typically buys a visibly larger house for the same money; two hours buys a garden; three hours buys a farm. What the regions cannot offer is depth of market - outside the southwest, a buyer may wait months for a suitable listing simply because so few change hands each year1.
What drives Icelandic house prices
Four forces explain most of the curve in the index above. Construction costs: nearly every input arrives by air or sea, so the cost of building a modest apartment block here rivals a luxury build elsewhere. Wages and purchasing power: the 2017-2019 wage agreements put real purchasing power in households' pockets exactly when tourism earnings were peaking. Credit: the removal of the indexation-linked capital controls era restrictions and the entry of pension funds as mortgage lenders deepened the pool of money. And supply, the slowest variable: completions have risen but remain below the level needed to catch the capital-region shortage2.
Then there is the investor question. Short-term rental conversion of apartments during the tourism boom removed stock from the long-term market and is widely blamed in Icelandic public debate for part of the squeeze; registration rules introduced since 2017 have trimmed the practice without reversing it1.
Rent or buy?
The rent-versus-buy calculus is unusual in Iceland because rents are high too - the country's rental market shares the same shortage, and in recent years rents have risen almost as fast as purchase prices. Our separate average rent page tracks that side. The short version for a planner: buying usually wins within five to seven years for anyone with access to a Housing Fund loan, while short-stayers and the dollar-based remote workers who treat Iceland as a two-year posting tend to rent and accept the cost as one of the world's highest1.
Reykjavik against the towns: medians, not guesses
Press and listing data give two concrete medians for early 2026: the median capital-region apartment sells at about ISK 72 million6 - near $560,0006 - while a detached house in the same market runs about ISK 148 million6, near $1.15 million6. Regionally, agents reported the strongest activity outside the capital in Akureyri, the northern hub, where prices track the national index but from a visibly lower base1.
The city-by-city pattern inside the capital region is stable: Reykjavik's 101 and Vesturbær districts top the per-metre rankings, Kópavogur and Garðabær trade at small discounts for commutable family housing, and Hafnarfjörður remains the value edge of the continuous urban area1. There is no official per-region average price series - the register publishes every transaction, but the published tables stop at the index - so these medians are listing-site and press figures, labelled as such.
- Iceland
- European Union (27)
- Denmark
- Norway
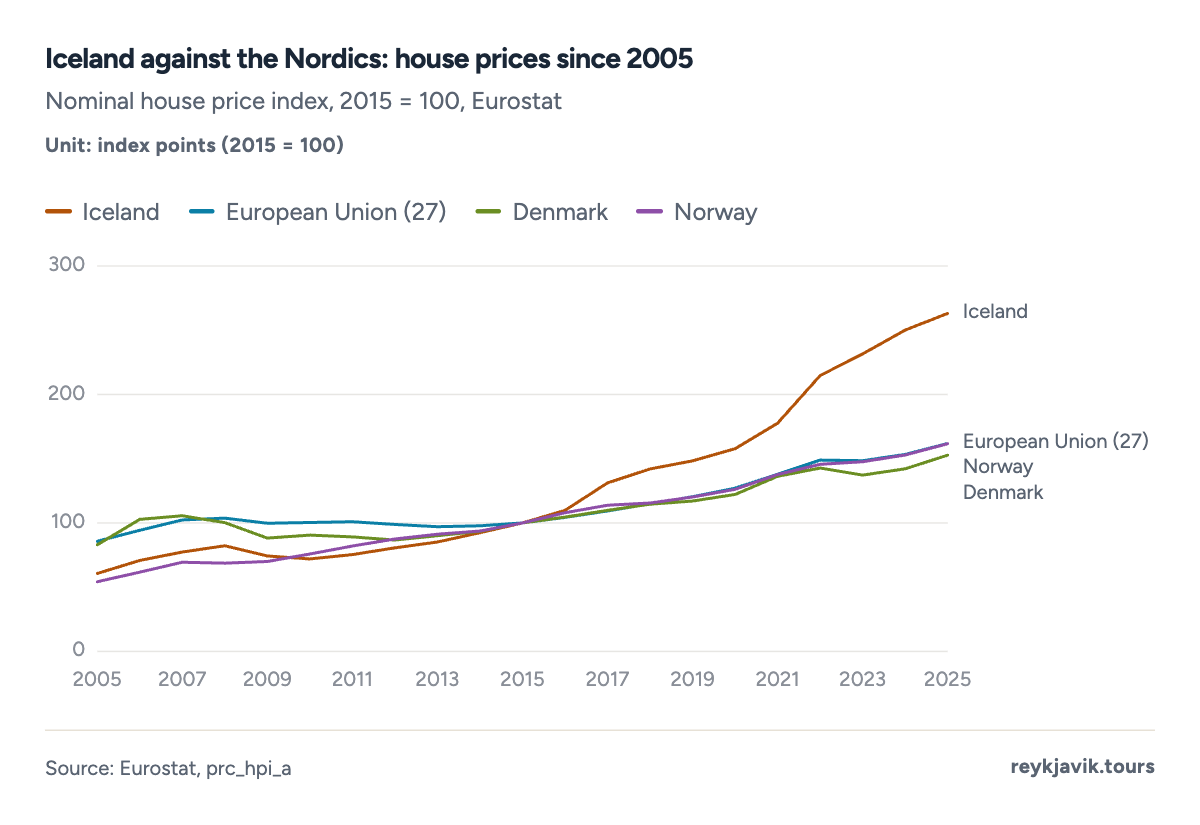
- Iceland's prices have more than 2.6x since 2015 - the fastest of any Nordic country.
- Sweden's index sits at just 133 - a boom-and-correct market Iceland never mirrored.
- The EU-27 average rose about 62% in the same decade; Iceland rose 163%.
Projection: linear trend of 2005–2025 yearly values, 95% prediction range. Our calculation, not a forecast.
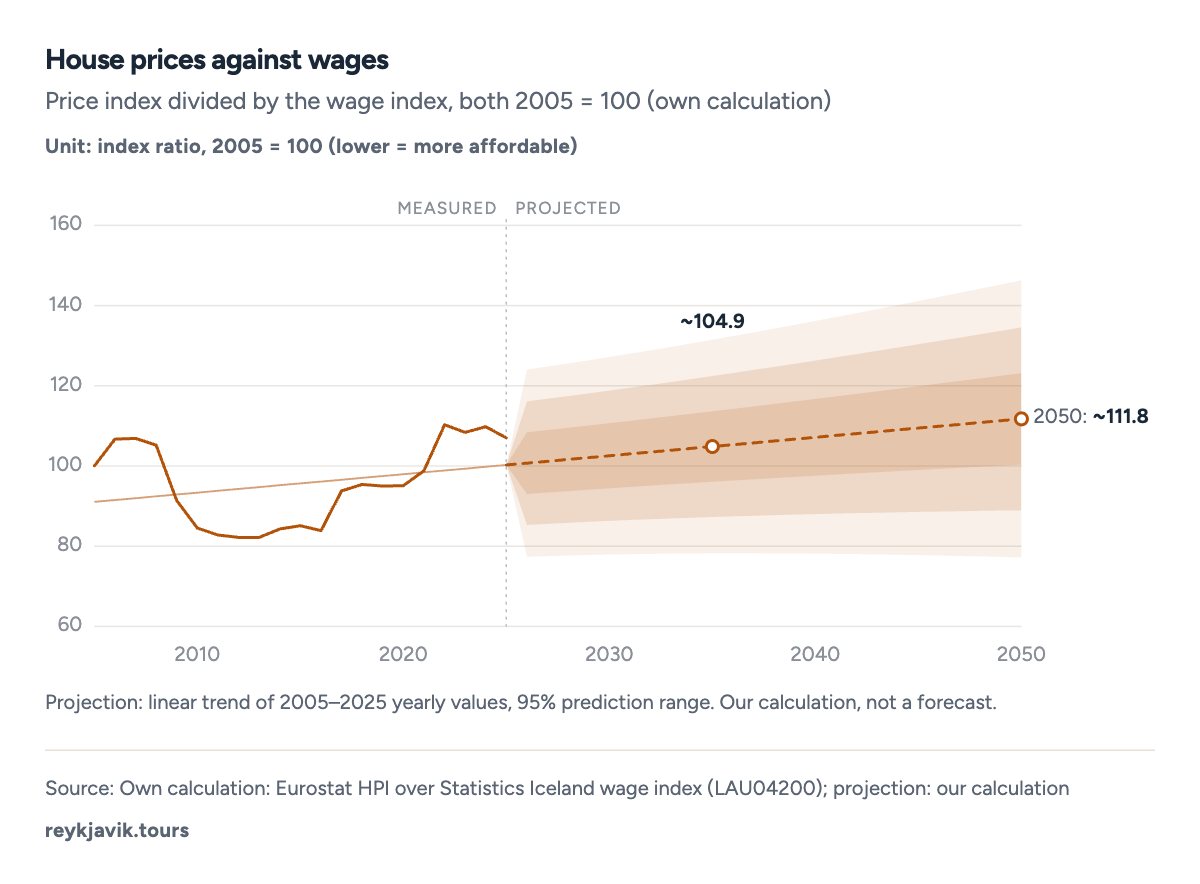
- House prices have roughly doubled against wages since 2005.
- Affordability improved briefly after the 2008 crash and has declined almost every year since 2013.
- The ratio's climb is the statistical form of the first-time-buyer problem.
| 2005 | 100.0 | 100.0 | 100.0 |
| 2008 | 135.8 | 129.1 | 105.2 |
| 2009 | 122.6 | 134.2 | 91.4 |
| 2010 | 118.8 | 140.6 | 84.5 |
| 2015 | 165.0 | 193.9 | 85.1 |
| 2020 | 260.4 | 274.0 | 95.1 |
| 2025 | 434.2 | 405.7 | 107.0 |
Affordability over time: prices doubled against wages
Divide the house price index by the wage index (both rebased to 2005) and the affordability problem becomes a single line: since 2005 the ratio has roughly doubled - the same dwelling now costs about twice as many average wages as it did two decades ago4. The only relief in the series came after the 2008 crash, when wages held while prices fell, and in 2024-2025, when wage growth finally outpaced +5% house-price inflation for the first time in years7.
Against the neighbours the comparison is stark. Since 2015 Iceland's nominal house prices have risen 163%2, while Sweden managed 33%, Denmark 53% and the EU-27 average 62% - Iceland out-ran every Nordic market by a factor of roughly three2. Part of that is the krona (the index is nominal), part is the tourism-era demand wave, and part is supply that never caught up; all three are visible in the per-country lines above2.
Conclusions
- The working answer: a capital-region apartment costs ISK 60-100M ($467k-779k), and nearly a third of the capital's listings now exceed ISK 100M1.
- The index says the same thing in trend form: +163% in a decade, 4.3-fold since 2005, with the 2008 crash the only interruption2.
- Convert in both directions: dollar buyers gained ground as the krona slid through 2022-2024, which is why the same house can be cheaper in dollars without any ISK price moving3.
- Money is expensive: an 8% policy rate and inflation-indexed mortgages make financing - not the sticker price - the real constraint for Icelandic first-time buyers5.
- The market has cooled from the 2022 spike (+21%) to +5.1% in 2025, the slowest pace since the last cooling - a normalisation, not a crash. The next mover is supply: how fast new construction finally closes the capital-region gap2.
Methodology
- House price index: 2005-2025, annual, nominal (Eurostat prc_hpi_a)
- Price brackets: 2025 capital-region listings (press, approximate)
- Interest rates: policy rate and long-run average to 2026
Definition. The house price index (HPI) is nominal and referenced to 2015 = 100. 'Implied average price' is our own back-calculation: the quoted ISK 60-100M capital-region bracket midpoint (ISK 80M for 2025) scaled by the HPI for earlier years.
Data sources. Eurostat prc_hpi_a for the index; press reporting on Register Iceland listings for brackets (labelled approximate); Central Bank of Iceland via Trading Economics for rates (labelled); Central Bank of Iceland for the 2025 USD/ISK average of 128.37.
Calculations. USD conversions divide ISK by 128.37 (2025 average). YoY change is the index's annual percentage change. Implied prices scale the ISK 80M anchor by the index ratio to 2025. Projections are ordinary least-squares trends with a 95% prediction interval computed by the renderer.
Limitations. Iceland publishes no measured average dwelling price, so absolute kronur figures are back-calculated and move with the chosen anchor. The bracket split is approximate press reporting over listings, not a census of transactions. Index values are nominal - real-terms prices have risen more slowly. Interest rates move with policy; the figures here are snapshots.
Sources
- Iceland Review / IceNews (press). “Capital-region apartment price brackets, ISK 60-100 million.” press reporting on Register Iceland data (labelled), 2025. icelandreview.com. Accessed 2026-09-17. Back to text
- Eurostat. “House price index - Iceland, nominal, 2015=100 (prc_hpi_a).” European Commission, 2026. ec.europa.eu. Accessed 2026-09-17. Back to text
- Central Bank of Iceland. “Average USD/ISK exchange rate 2025 (128.37).” Central Bank of Iceland, 2026. cb.is. Accessed 2026-09-17. Back to text
- Reykjavik Tours. “Own back-calculation and bracket midpoints (labelled).” own calculation, 2026. reykjavik.tours. Accessed 2026-09-17. Back to text
- Trading Economics / Central Bank of Iceland. “Iceland benchmark interest rate 8%, average 6.86% 1998-2026.” Trading Economics (commercial) citing CBI, 2026. tradingeconomics.com. Accessed 2026-09-17. Back to text
- Guide to Iceland. “Median capital-region apartment price ISK 72M; detached house ISK 148M, early 2026.” commercial, labelled, 2026. guidetoiceland.is. Accessed 2026-09-17. Back to text
- Statistics Iceland. “Wage index, annual averages 1989-2025 (LAU04200).” Statistics Iceland, 2026. hagstofa.is. Accessed 2026-09-17. Back to text
About the author
Laufey turns public statistics on tourism and travel into research people can check and cite.
Every figure on this page links to its source. How we research
Related research
More data on Iceland's weather and travel from Reykjavik Tours.
- HousingAverage Rent in Iceland (2026 Data)ISK 269k average monthly rent in IcelandRead the research →
- TransportHow Many Airports in Iceland? (2026 Data)33 airports in IcelandRead the research →
- Travel costsHow Much Are Hotels in Iceland? (2026 Data)$196 a night for a typical hotel roomRead the research →
- Travel planningHow Many Miles Is the Ring Road in Iceland? (2026 Data)822 mi the Ring Road around IcelandRead the research →
- Travel planningHow Often Can You See the Northern Lights in Iceland? (2026 Data)~50% chance of aurora on any dark-season nightRead the research →
- EconomyAverage Salary in Iceland (2026 Data)$8,242 average monthly salary, full-timeRead the research →