Iceland GDP per Capita: Nominal, PPP and Ranking (2026 Data)
Iceland's GDP per person in dollars and at PPP since 1960, its world ranking, IMF forecasts to 2031, the 2008 crash, industries, exports, jobs, debt and national wealth.
- Published
- Updated
- 25 sources
- 145 statistics
- 12 min read

- M.Sc. in Atmospheric Sciences, University of Iceland (Háskóli Íslands), with a minor thesis on North Atlantic storm-track variability
- Former research assistant at the Icelandic Meteorological Office (Veðurstofa Íslands), working on subarctic climate modeling and volcanic-ash dispersion forecasting
- B.A. in Sociology, also from the University of Iceland, with fieldwork on rural depopulation and tourism's impact on small fishing communities (Westfjords focus)
- Grew up in Akureyri, spent seven years living in Reykjavík and two in a small village in the Westfjords - brings first-hand experience of Iceland's regional weather extremes and community life
- Fluent in Icelandic and English; has translated Icelandic Met Office public advisories for international outlets
- Published field notes and data-driven pieces on glacier retreat (Vatnajökull), aurora forecasting, and the socioeconomic effects of overtourism in the Golden Circle

- M.A. in Journalism, University of Iceland, with additional coursework in Environmental Communication at the University of Bergen (Norway), giving a comparative Nordic lens
- 12+ years in Icelandic media, including editorial roles at RÚV (Iceland's national broadcaster) covering weather-related public safety reporting (storms, volcanic eruptions, road closures)
- Former fact-checking lead for a travel-and-culture desk, specializing in verifying tourism statistics, safety advisories, and climate data against primary sources (Vedur.is, Statistics Iceland)
- Has overseen editorial standards for bilingual (Icelandic/English) publications, ensuring both cultural nuance and accuracy for international readers
- Advocate for citing primary sources (Icelandic Met Office, Icelandic Tourist Board / Ferðamálastofa) rather than secondhand reporting
Key findings
- $98,323Iceland GDP per capita was $98,323 in 2025 in current US dollars, according to the World Bank.
- $83,431Adjusted for Iceland's high prices, GDP per person was $83,431 at purchasing power parity in 2025.
- 6thIceland ranked 6th of 38 European and major OECD economies for GDP per person in 2024.
- $110,048The IMF expects Iceland's GDP per person to reach $110,048 in 2026, 5th in the world.
- 41%After the 2008 banking crash, dollar GDP per person fell 41% between 2007 and 2009.
- 8.8%Tourism directly generated 8.8% of Iceland's GDP in 2025, up from 3.4% in 2009.
- 88.3%Iceland's general government liabilities were 88.3% of GDP in 2025, down from 167.1% in 2011.
- 0.27%Iceland has no army and spent 0.27% of GDP on defence in 2025.
In 2025, Iceland's economy produced $98,3231 for every resident; in the World Bank's 2024 comparison only Norway ranked higher among the Nordic countries. Yet the same country saw its dollar income per person fall by 41%1 in two years after its banks collapsed in 2008, and its economy still runs on a handful of export earners: foreign visitors, aluminium and fish.
That mix makes the headline number move more than most. In 2025, dollar GDP per person rose by 14.5% while real output per person fell, largely because the krona strengthened. This report uses World Bank, IMF and Statistics Iceland data to show Iceland's GDP per person in nominal and PPP terms, its ranking, the path since 1960, what the economy is made of, and how much the country owes and owns. Dollar figures come first, with krónur (ISK) in brackets at each year's average Central Bank of Iceland exchange rate.
Iceland's GDP per person in 2025
The World Bank's figure for 2025 is $98,3231 per person in current US dollars, about ISK 12.6 million2 at the year's average exchange rate of ISK 128.37 per dollar. That is nominal GDP: the value of everything produced in Iceland, divided by the population and converted at market exchange rates. The IMF, which publishes its own estimates, puts 2025 slightly higher at $99,0713. Statistics Iceland's own series, which ends in 2024, gives $86,4734 for 2024, or ISK 11.93 million4 per person.
World Bank GDP per capita: Iceland 2024 vs 2025
In the World Bank data, Iceland's GDP per person was $82,2011 in 2023 and $85,8631 in 2024 (ISK 11.8 million), before the jump to $98,323 in 2025. The rise of 14.5% did not come from producing much more. Statistics Iceland measures real GDP growth of 1.1%5 for 2025 and a change in real GDP per person of -0.3%5, as the population grew by about 1.4%. The difference is the exchange rate: a dollar cost ISK 137.932 on average in 2024 and ISK 128.372 in 2025, so the same krónur were worth about 7.4% more dollars.
The long series shows how far and how fast Iceland has climbed. GDP per person was $1,4861 in 1960, was $15,3401 in 1980 and reached a pre-crisis peak of $70,4831 in 2007. It fell to $41,4841 in 2009 and only passed the 2007 level again in 20171. A straight-line trend fitted to 2000–2025 keeps rising towards 2050, but the wide range around it reflects how sharply the dollar figure has swung.
Projection: linear trend of 2000–2025 yearly values, 95% prediction range. Our calculation, not a forecast.
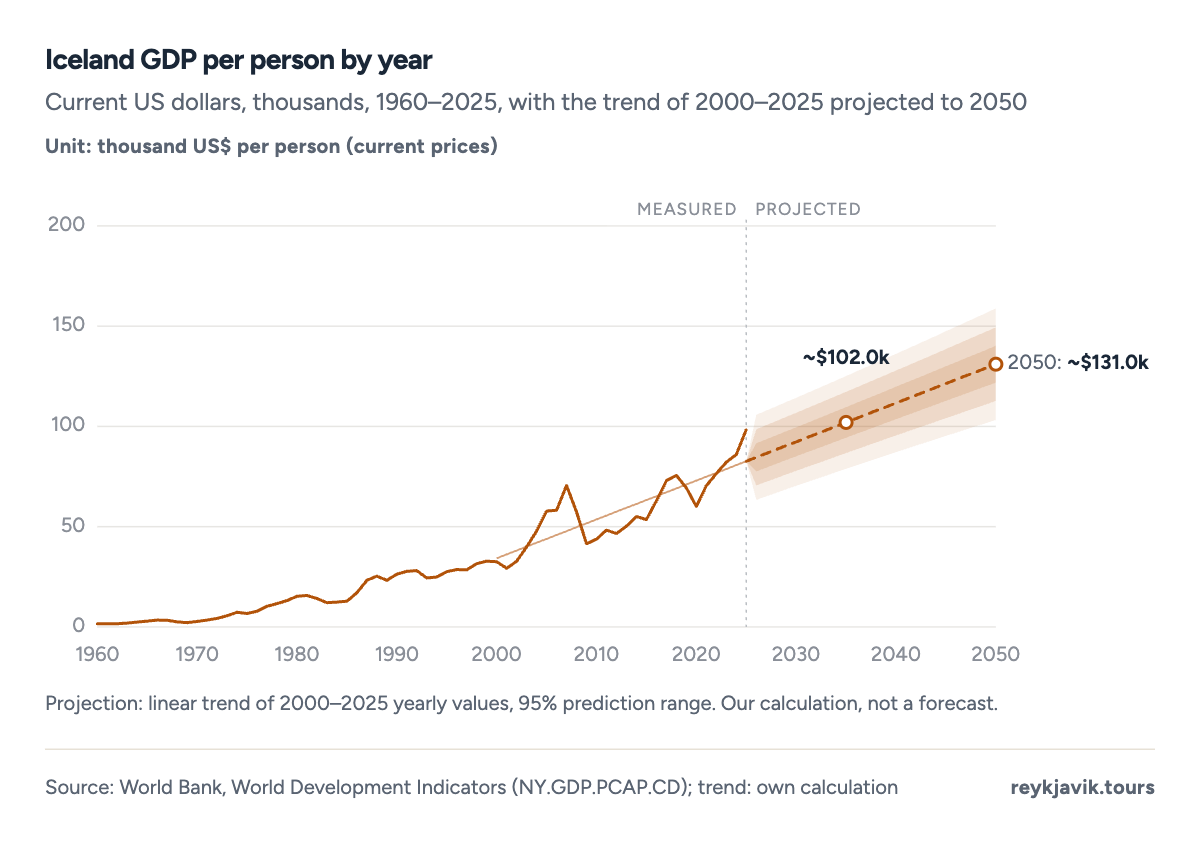
- GDP per person reached $98,323 in 2025.
- It fell from $70,483 in 2007 to $41,484 in 2009.
| GDP per capita, current US$ | $98,323 (ISK 12.6 million) | 2025 | World Bank |
| GDP per capita, PPP (international $) | $83,431 | 2025 | World Bank |
| GNI per capita, Atlas method | $89,220 | 2025 | World Bank |
| GNI per capita, PPP | $83,250 | 2025 | World Bank |
| GDP per capita, current US$ | $99,071 | 2025 | IMF |
| GDP per capita, PPP | $80,662 | 2025 | IMF |
| GDP per capita, current US$ (forecast) | $110,048 | 2026 | IMF |
| GDP per capita, US$ at current rates | $86,473 (ISK 11.93 million) | 2024 | Statistics Iceland |
| Real GDP per capita growth | -0.3% | 2025 | Statistics Iceland |
Iceland GNI per capita
Gross national income (GNI) adds income that Icelanders earn abroad and subtracts income paid to foreign owners and lenders. The World Bank's GNI per person, calculated with its Atlas method that smooths exchange-rate swings over three years, was $89,2207 in 2025, up from $80,8707 in 2023. At purchasing power parity it was $83,2507.
Iceland GDP per capita PPP
Purchasing power parity (PPP) converts GDP with a rate that equalises the price of the same basket of goods and services across countries, so a PPP dollar buys as much in Reykjavík as in the United States. On that basis Iceland's GDP per person was $83,4316 in 2025, compared with $83,5616 in 2024. The IMF's PPP figure for 2025 is $80,6623.
The gap between the two measures is a price gauge. In 2025 nominal GDP per person was about 1.18 times the PPP figure, our calculation from the World Bank data, which means prices in Iceland were roughly 18% above the US-based benchmark. In 2009, after the krona collapsed, the relationship flipped: nominal GDP per person was $41,4841 and PPP GDP per person $42,0706.
- Nominal (current US$)
- PPP (international $)
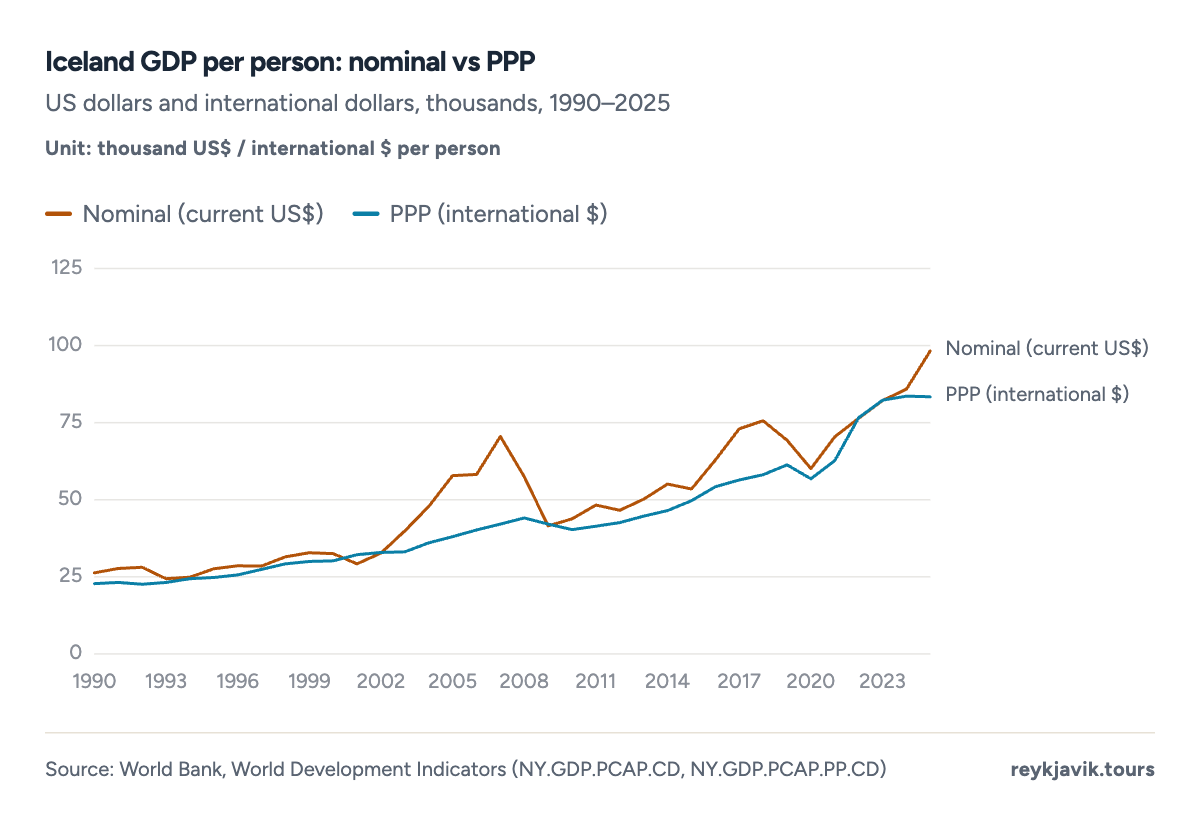
- Nominal GDP per person was $98,323 in 2025.
- At PPP it was $83,431.
Iceland GDP per capita ranking
Compared with 38 economies of the European Union, the rest of Western Europe and the largest OECD members outside Europe, Iceland ranked 6th8 for nominal GDP per person in 2024, the latest year with data for all of them. Luxembourg led with $137,7828, followed by Ireland, Switzerland, Norway and the United States at $86,1708, just above Iceland's $85,8638. Among the Nordic countries only Norway, at $89,8898, was higher; Denmark had $71,0268, Sweden $57,223 and Finland $53,156.
At purchasing power parity Iceland placed 7th8 of the same 38 with $83,5618. The Netherlands, 8th in nominal terms, moves ahead of Iceland on this measure.
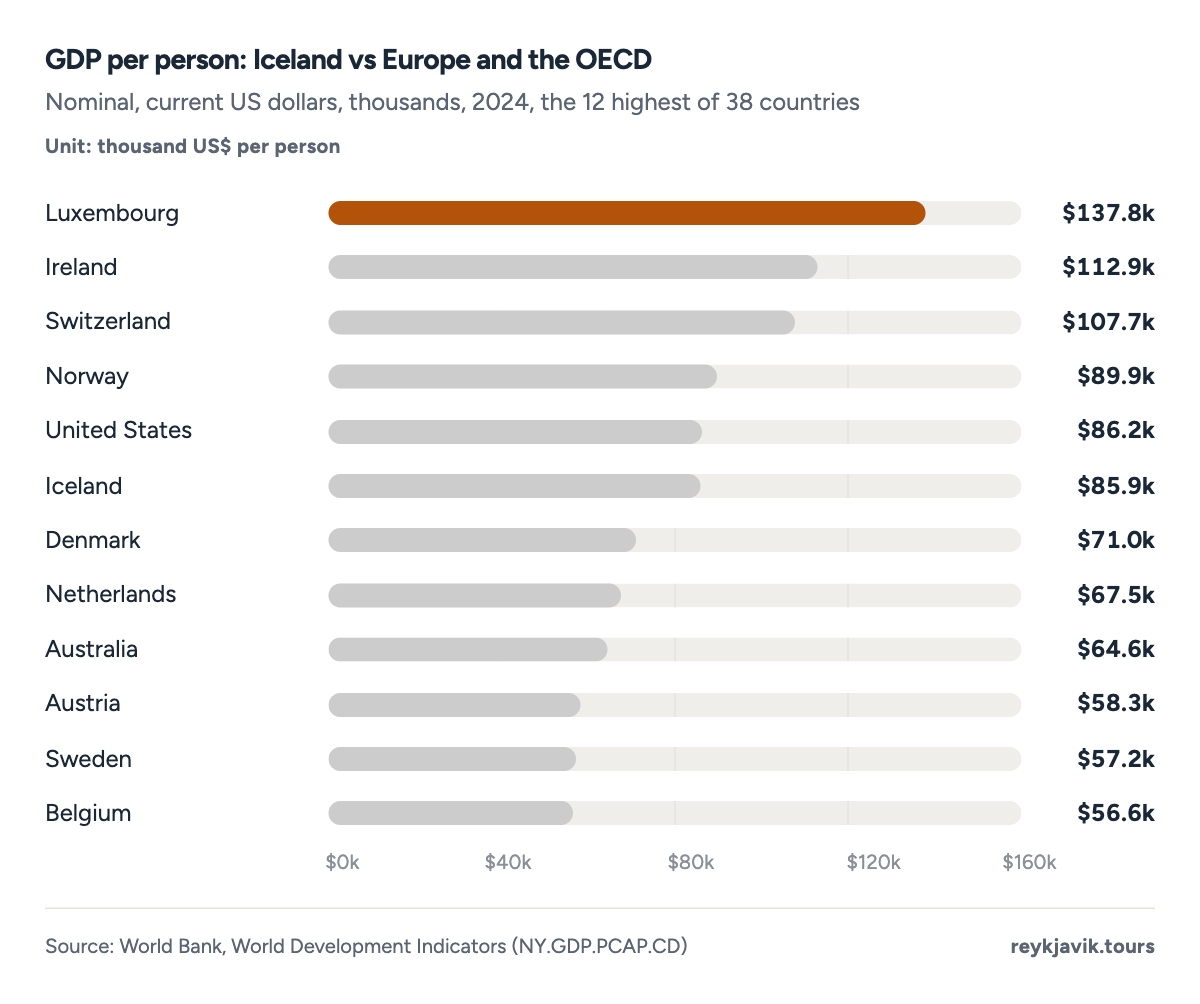
- Iceland ranked 6th with $85,863.
- Luxembourg led with $137,782.
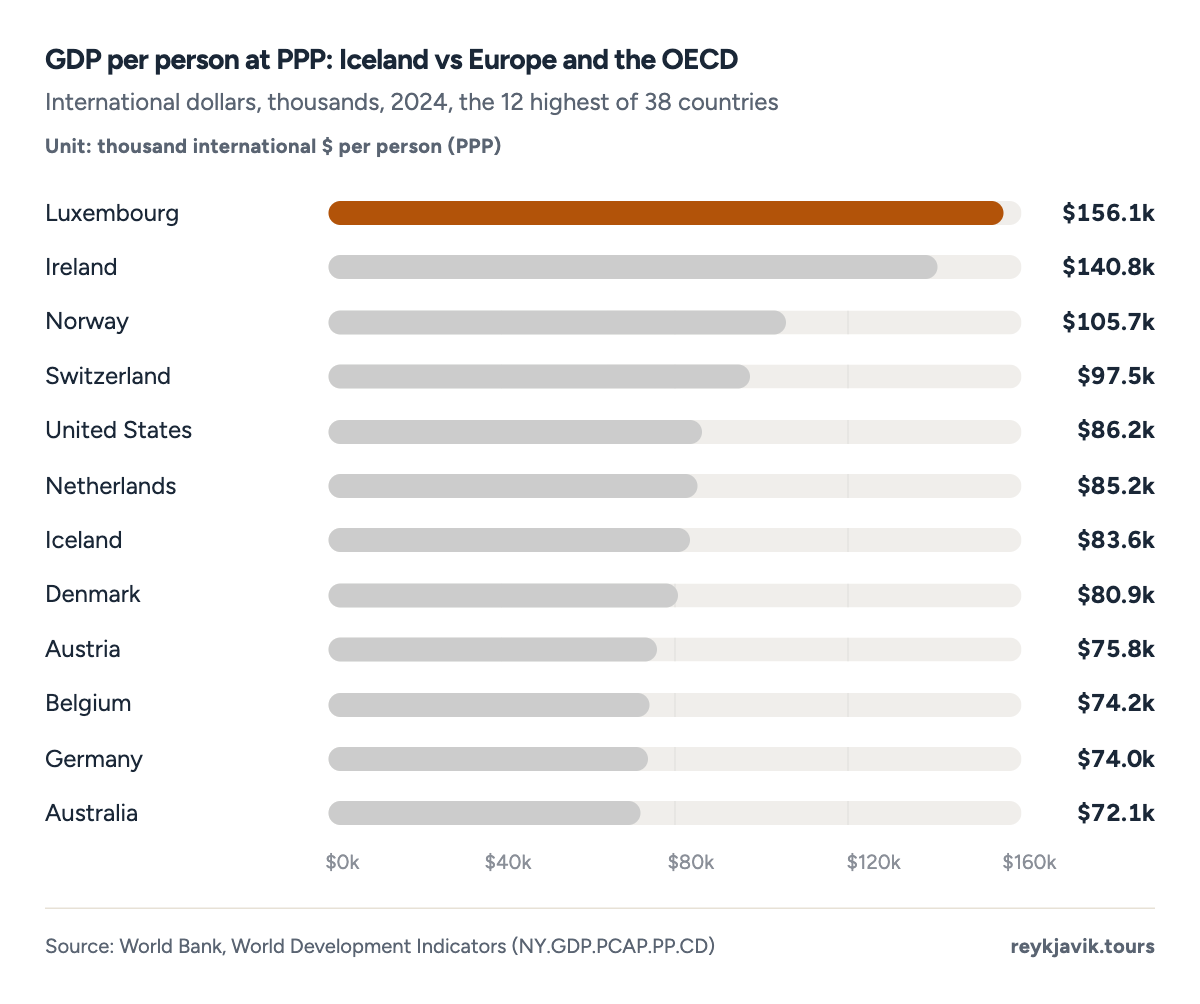
- Iceland ranked 7th at PPP.
- Norway had $105,657.
| 1 | Luxembourg | 137,782 | 156,079 |
| 2 | Ireland | 112,895 | 140,779 |
| 3 | Switzerland | 107,702 | 97,468 |
| 4 | Norway | 89,889 | 105,657 |
| 5 | United States | 86,170 | 86,170 |
| 6 | Iceland | 85,863 | 83,561 |
| 7 | Denmark | 71,026 | 80,938 |
| 8 | Netherlands | 67,465 | 85,218 |
| 9 | Australia | 64,610 | 72,118 |
| 10 | Austria | 58,269 | 75,774 |
| 11 | Sweden | 57,223 | 71,222 |
| 12 | Belgium | 56,582 | 74,225 |
| 13 | Germany | 56,104 | 73,957 |
| 14 | Canada | 55,016 | 65,483 |
| 15 | Israel | 54,217 | 57,278 |
| 16 | United Kingdom | 53,341 | 62,839 |
| 17 | Finland | 53,156 | 65,137 |
| 18 | New Zealand | 49,432 | 55,794 |
| 19 | France | 46,103 | 62,525 |
| 20 | Malta | 44,024 | 70,063 |
| 21 | Italy | 40,430 | 62,293 |
| 22 | Cyprus | 38,674 | 63,007 |
| 23 | Korea, Rep. | 36,239 | 61,051 |
| 24 | Spain | 35,327 | 58,064 |
| 25 | Slovenia | 34,301 | 57,571 |
| 26 | Japan | 33,797 | 54,156 |
| 27 | Czechia | 31,828 | 57,625 |
| 28 | Estonia | 31,428 | 50,396 |
| 29 | Lithuania | 29,604 | 55,699 |
| 30 | Portugal | 29,328 | 52,513 |
| 31 | Slovak Republic | 25,993 | 47,847 |
| 32 | Poland | 25,104 | 51,263 |
| 33 | Greece | 24,626 | 44,171 |
| 34 | Croatia | 24,050 | 49,551 |
| 35 | Latvia | 23,579 | 43,873 |
| 36 | Hungary | 23,305 | 48,540 |
| 37 | Romania | 20,080 | 49,077 |
| 38 | Bulgaria | 17,597 | 41,970 |
IMF GDP per capita: Iceland 2026 and beyond
The IMF's World Economic Outlook ranks every country it covers. For 2025 it places Iceland 6th3 in the world with $99,071, and for 2026 it forecasts $110,0483, which would lift Iceland to 5th3, behind Liechtenstein, Luxembourg, Ireland and Switzerland and just ahead of Singapore and Norway. The IMF expects total GDP of $43.8 billion3 in 2026 and GDP per person of $125,2833 by 2031. Its PPP forecast is more modest, rising from $82,730 in 2026 to $91,9913 in 2031, because a forecast in current dollars also includes inflation and the assumed exchange rate.
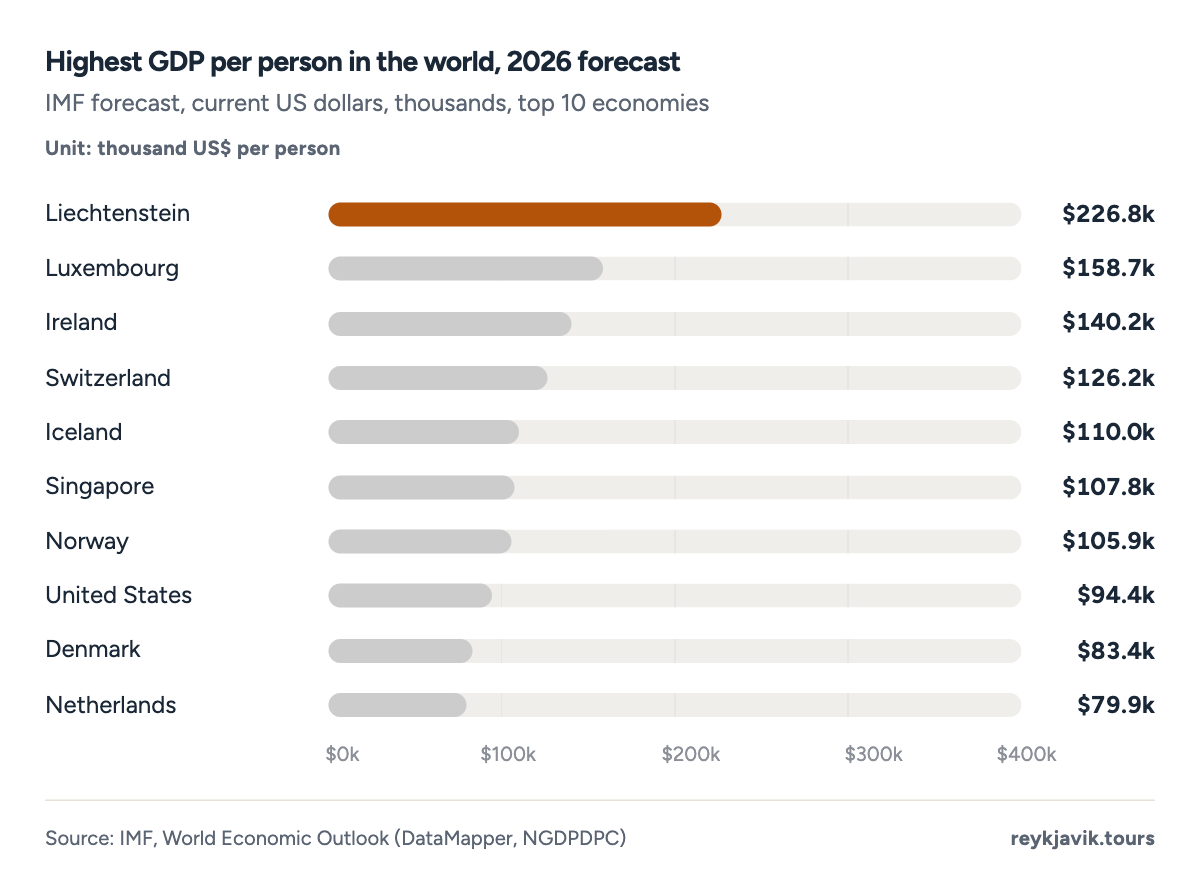
- Iceland is forecast 5th with $110,048.
- Liechtenstein leads with $226,809.
| 2024 | 86,485 | 78,600 | −1.3 | 5.9 | 60.4 |
| 2025 | 99,071 | 80,662 | 1.3 | 4.1 | 56.1 |
| 2026 | 110,048 | 82,730 | 1.9 | 4.8 | 53.6 |
| 2027 | 113,119 | 84,548 | 2.1 | 2.8 | 51.7 |
| 2028 | 115,893 | 86,171 | 2.4 | 2.5 | 49.9 |
| 2029 | 118,926 | 88,058 | 2.4 | 2.5 | 47.8 |
| 2030 | 122,074 | 90,028 | 2.4 | 2.5 | 45.4 |
| 2031 | 125,283 | 91,991 | 2.4 | 2.5 | 43.0 |
Iceland GDP by year
Iceland total GDP
Iceland's whole economy produced $38.6 billion9 of output in 2025, according to the World Bank, or ISK 4.94 trillion10 in Statistics Iceland's national accounts. That is small in world terms: the total is spread across a population of 391,8845 people in 2025. In dollars the economy was worth $22.0 billion9 in 2007, shrank to $13.2 billion9 in 2009 and has nearly tripled since.
Projection: linear trend of 2000–2025 yearly values, 95% prediction range. Our calculation, not a forecast.
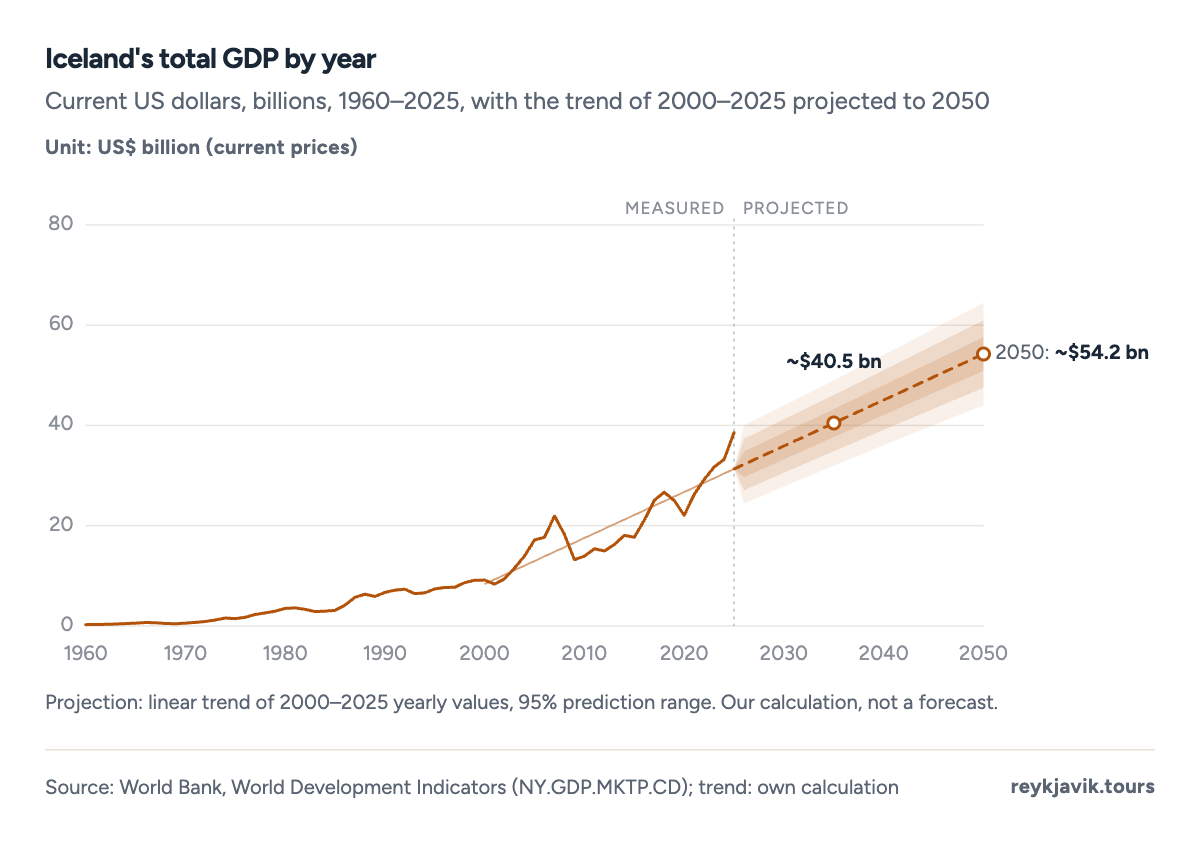
- GDP was $38.6 billion in 2025.
- It was $13.2 billion in 2009.
Iceland GDP growth rate
Measured in constant prices, Statistics Iceland's series goes back to 1946. The fastest year was 19535 with growth of 15.4%, and the deepest contraction was 2009, at -8.3%, the year after the banks failed; the World Bank records the same -8.3%9. The pandemic year 2020 was the second-worst on record at -6.6%5. Recovery was fast: 5.2%5 in 2021 and 8.9%5 in 2022. Growth then slowed to 5.2% in 2023, turned negative at -0.9%5 in 2024 and recovered to 1.1% in 2025.
Statistics Iceland's forecast expects 1.8%11 growth in 2026 and 3.2%11 in 2027, then about 2.4% a year to 2030. The IMF is similar, with 1.9%3 for 2026.
Projection: linear trend of 1990–2025 yearly values, 95% prediction range. Our calculation, not a forecast.
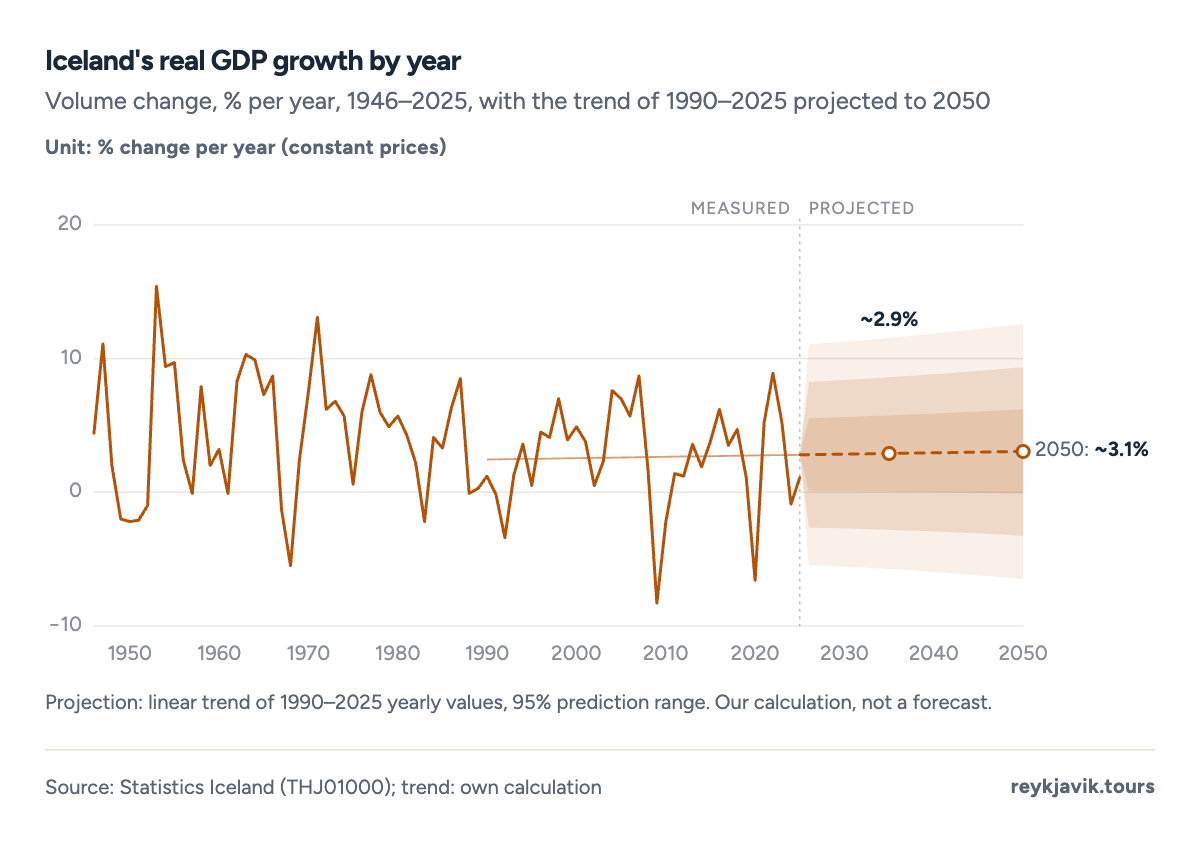
- The worst year was 2009 at -8.3%.
- Growth was 1.1% in 2025.
| 2025 | 98,323 | 83,431 | 38.58 | +1.1 | −0.3 |
| 2024 | 85,863 | 83,561 | 33.19 | −0.9 | −2.7 |
| 2023 | 82,201 | 82,257 | 31.70 | +5.2 | +2.6 |
| 2022 | 76,377 | 76,592 | 29.18 | +8.9 | +6.4 |
| 2021 | 70,425 | 62,721 | 26.23 | +5.2 | +3.6 |
| 2020 | 60,128 | 56,841 | 22.03 | −6.6 | −7.8 |
| 2019 | 69,296 | 61,270 | 24.99 | +1.1 | −0.6 |
| 2018 | 75,634 | 58,106 | 26.68 | +4.7 | +2.1 |
| 2017 | 72,976 | 56,385 | 25.06 | +3.5 | +1.0 |
| 2016 | 62,854 | 54,228 | 21.08 | +6.2 | +4.7 |
| 2015 | 53,506 | 49,716 | 17.70 | +3.8 | +2.8 |
| 2014 | 55,140 | 46,472 | 18.05 | +1.9 | +0.8 |
| 2013 | 50,173 | 44,738 | 16.24 | +3.6 | +2.5 |
| 2012 | 46,595 | 42,552 | 14.94 | +1.2 | +0.5 |
| 2011 | 48,255 | 41,400 | 15.39 | +1.4 | +2.1 |
| 2010 | 43,776 | 40,260 | 13.92 | −2.2 | −1.1 |
| 2009 | 41,484 | 42,070 | 13.21 | −8.3 | −8.6 |
| 2008 | 57,489 | 44,147 | 18.25 | +1.7 | −0.2 |
| 2007 | 70,483 | 42,060 | 21.96 | +8.7 | +6.0 |
| 2006 | 58,172 | 40,161 | 17.67 | +5.7 | +3.2 |
| 2005 | 57,784 | 37,973 | 17.15 | +7.0 | +5.3 |
| 2004 | 47,810 | 35,970 | 13.96 | +7.6 | +6.7 |
| 2003 | 39,944 | 33,084 | 11.56 | +2.3 | +1.6 |
| 2002 | 32,749 | 32,949 | 9.42 | +0.5 | −0.4 |
| 2001 | 29,208 | 32,225 | 8.32 | +3.8 | +2.5 |
| 2000 | 32,504 | 30,167 | 9.14 | +4.9 | +3.5 |
The 2008 crash in numbers
Iceland's banking system collapsed in 2008. That year the current account deficit, the gap between what the country paid abroad and what it earned, reached 23.0% of GDP12. In the aftermath, inflation hit 12.7%12 in 2008 and 12.0% in 2009, unemployment rose from 2.9%12 in 2008 to 7.6%12 in 2010, and general government spending jumped to 62.8% of GDP10 in 2008. Government liabilities climbed from 91.6% of GDP13 in 2007 to a peak of 167.1%13 in 2011.
| 2006 | 58,172 | +5.7 | 6.7 | 2.8 | 97.1 |
| 2007 | 70,483 | +8.7 | 5.1 | 2.3 | 91.6 |
| 2008 | 57,489 | +1.7 | 12.7 | 2.9 | 139.5 |
| 2009 | 41,484 | −8.3 | 12.0 | 7.2 | 157.6 |
| 2010 | 43,776 | −2.2 | 5.4 | 7.6 | 160.8 |
| 2011 | 48,255 | +1.4 | 4.0 | 7.0 | 167.1 |
| 2012 | 46,595 | +1.2 | 5.2 | 6.0 | 162.6 |
| 2025 | 1.7 | 4,988 | 4.1 | 4.2 | −2.4 |
| 2026 | 1.8 | 5,287 | 3.5 | 4.3 | −0.9 |
| 2027 | 3.2 | 5,580 | 2.7 | 4.1 | −0.8 |
| 2028 | 2.4 | 5,874 | 2.5 | 4.0 | −0.3 |
| 2029 | 2.4 | 6,176 | 2.5 | 4.0 | −0.2 |
| 2030 | 2.4 | 6,498 | 2.5 | 4.0 | 0.0 |
| 2031 | 2.3 | 6,826 | 2.5 | 4.0 | 0.0 |
Why is Iceland GDP per capita so high?
The data point to a few reasons. First, rich natural resources per person: fishing and fish processing together made up 4.7% of GDP14 in 2025, and aluminium and aluminium products earned ISK 318 billion15 ($2.5 billion) in exports. Second, tourism: foreign visitors spent ISK 646 billion15 ($5.0 billion) in 2025, and tourism's direct share of GDP was 8.8%16. Third, a large share of people work: 223,16017 people were employed in 2025 out of a population of about 391,884.
Two further factors inflate the dollar figure. Prices are high, so nominal GDP per person is well above the PPP figure, as shown above. And the exchange rate matters: when the krona strengthened in 2025, dollar GDP per person rose by 14.5% even though real GDP per person slipped by 0.3%. Working hours point the other way: the average employed person worked 1,437 hours17 in 2025, 18% fewer than in 1991, so the high output comes despite shorter working years.
Iceland GDP by industry
Statistics Iceland splits value added by activity. In 2025 real estate was the largest single activity at 12.1% of GDP14. Manufacturing followed with 9.4%14, health and social work with 9.4%, wholesale and retail trade with 8.5%14 and construction with 8.2%. The World Bank's broad split gives services 66.2%18 of GDP and industry, including construction, 20.1%.
The structure has changed a lot since 1995. Fishing fell from 8.8% of GDP14 in 1995 to 2.8%14 in 2025, and manufacturing from 15.0% to 9.4%. Accommodation and food services doubled from 1.9%14 to 3.9%, and information and communication rose from 4.2% to 5.3%14.
What is the biggest industry in Iceland?
It depends on the yardstick. By value added, real estate leads, as above. By export earnings, tourism leads: travel revenue of $5.0 billion15 made up 32.4% of all exports of goods and services in 2025. By jobs, public administration, education and health together employ the most people, 66,53817 in 2025.
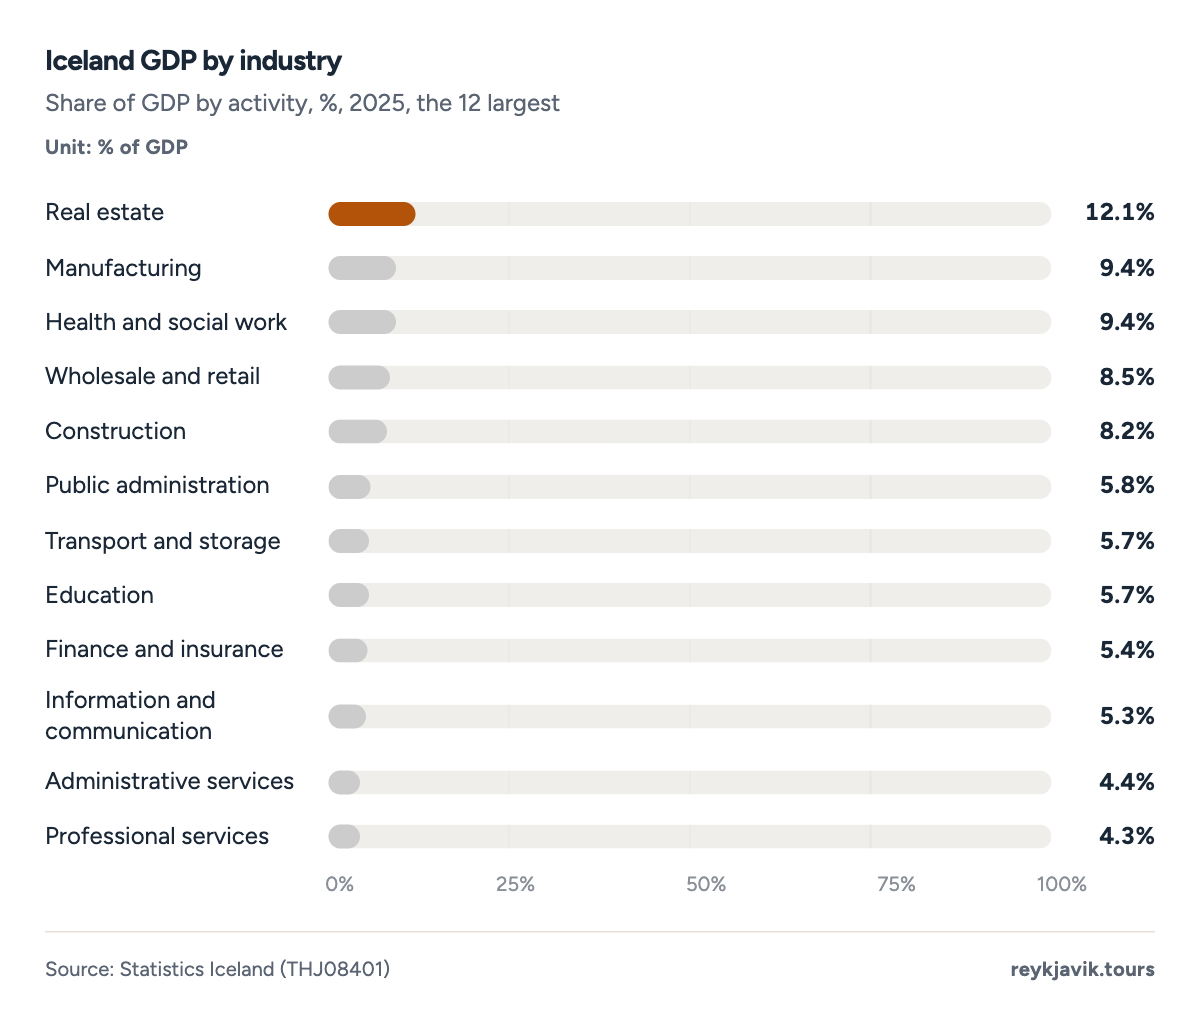
- Real estate made up 12.1% of GDP.
- Manufacturing made up 9.4%.
| 1 | Real estate | 12.1 | 10.7 | 7.6 |
| 2 | Manufacturing | 9.4 | 12.1 | 15.0 |
| 3 | Health and social work | 9.4 | 8.6 | 7.9 |
| 4 | Wholesale and retail | 8.5 | 8.3 | 11.5 |
| 5 | Construction | 8.2 | 8.5 | 7.5 |
| 6 | Public administration | 5.8 | 5.8 | 4.9 |
| 7 | Transport and storage | 5.7 | 4.8 | 6.5 |
| 8 | Education | 5.7 | 6.7 | 5.2 |
| 9 | Finance and insurance | 5.4 | 9.3 | 5.1 |
| 10 | Information and communication | 5.3 | 3.8 | 4.2 |
| 11 | Administrative services | 4.4 | 2.4 | 1.9 |
| 12 | Professional services | 4.3 | 4.3 | 3.3 |
| 13 | Agriculture, forestry, fishing | 4.1 | 5.4 | 10.4 |
| 14 | Accommodation and food | 3.9 | 1.7 | 1.9 |
| 15 | Electricity and heating | 3.6 | 3.8 | 3.5 |
| 16 | of which fishing | 2.8 | 4.3 | 8.8 |
| 17 | of which fish processing | 1.9 | 2.6 | 4.8 |
Iceland tourism percentage of GDP
Statistics Iceland's tourism satellite accounts measure tourism's direct contribution to GDP. It rose from 3.4%16 in 2009 to 8.1%16 in 2016, collapsed to 2.9%16 in the pandemic year 2020 and reached a new high of 8.8%16 in 2025, or ISK 435 billion ($3.4 billion). Tourism's share of hours worked is higher still, 9.5%16 in 2025, because tourism jobs produce less value per hour than the average.
Projection: linear trend of 2009–2025 yearly values, 95% prediction range. Our calculation, not a forecast.
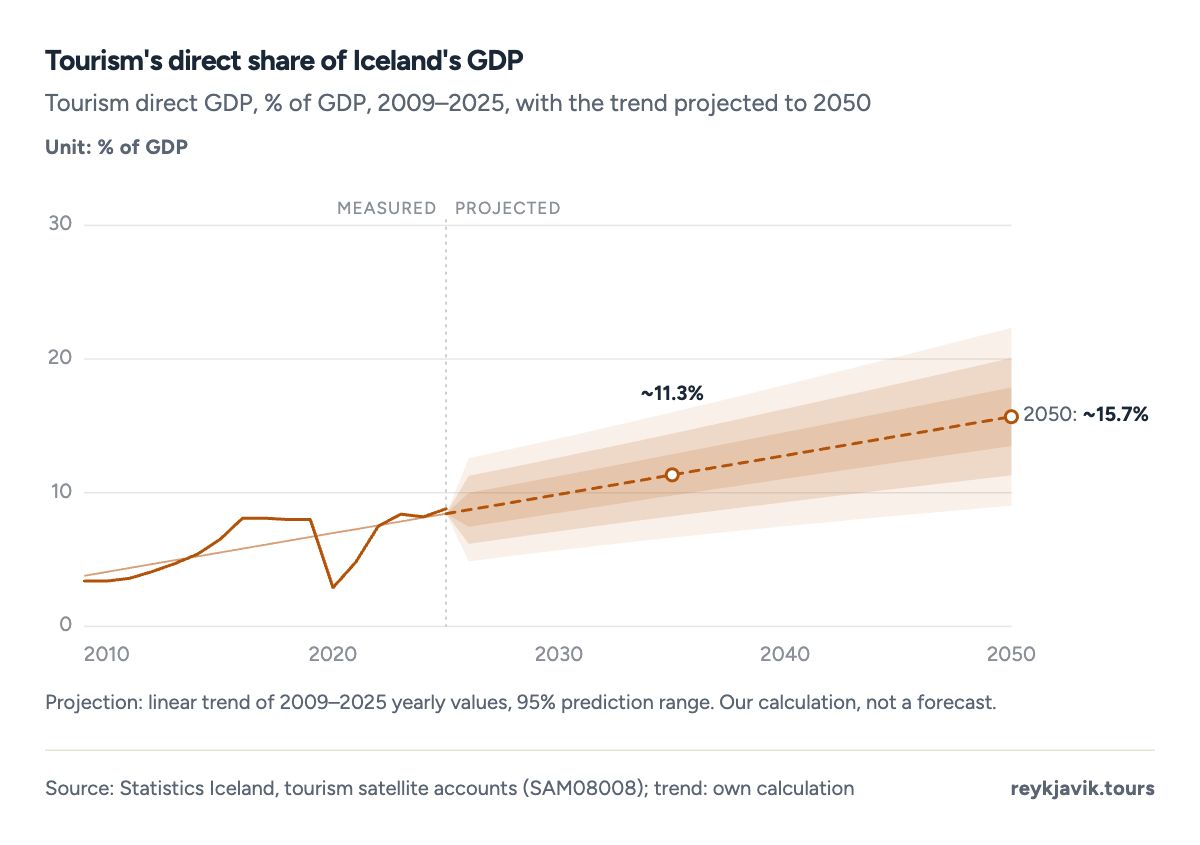
- Tourism made up 8.8% of GDP in 2025.
- It fell to 2.9% in 2020.
| 2025 | 8.8 | 3.39 | 435 | 9.5 |
| 2024 | 8.2 | 2.71 | 374 | 10.2 |
| 2023 | 8.4 | 2.67 | 369 | 10.2 |
| 2022 | 7.5 | 2.18 | 296 | 9.2 |
| 2021 | 4.8 | 1.26 | 160 | 6.4 |
| 2020 | 2.9 | 0.64 | 87 | 5.7 |
| 2019 | 8.0 | 2.00 | 245 | 10.6 |
| 2018 | 8.0 | 2.13 | 230 | 10.7 |
| 2017 | 8.1 | 2.02 | 216 | 10.7 |
| 2016 | 8.1 | 1.71 | 206 | 10.0 |
| 2015 | 6.5 | 1.14 | 151 | 8.4 |
| 2014 | 5.4 | 0.98 | 115 | 7.3 |
| 2013 | 4.7 | 0.76 | 93 | 6.5 |
| 2012 | 4.1 | 0.62 | 77 | 5.9 |
| 2011 | 3.6 | 0.56 | 65 | 5.1 |
| 2010 | 3.4 | 0.47 | 57 | 4.8 |
| 2009 | 3.4 | 0.46 | 56 | 4.6 |
Exports and trade
Iceland earns a large part of its income abroad: exports of goods and services were 40.1% of GDP12 in 2025. Their total value was ISK 2.00 trillion15, or $15.6 billion, up from $8.6 billion in 2013.
Iceland biggest exports
Four groups dominate. Travel revenue from foreign visitors brought in $5.0 billion15 (32.4%) in 2025. Manufactured goods earned $3.7 billion15 (23.9%), most of it aluminium at $2.5 billion. Marine products earned $2.8 billion15 (18.0%). All other goods and services added $4.0 billion.
Fish once made up almost all goods exports: marine products were 89.8%19 of goods exports in 1950 and 75.5%19 in 1990. By 2025 the share had fallen to 38.9%19, while aluminium and aluminium products reached 34.5%. The World Bank classifies 46.9%18 of merchandise exports as food and 36.2% as ores and metals. Farming plays a small part: what percentage of the land is arable in Iceland? Only 1.2%18 in 2023.
- Travel (foreign visitors)5.0432.4%
- Manufacturing (mostly aluminium)3.7223.9%
- Marine products2.8018%
- Other goods and services4.0125.8%
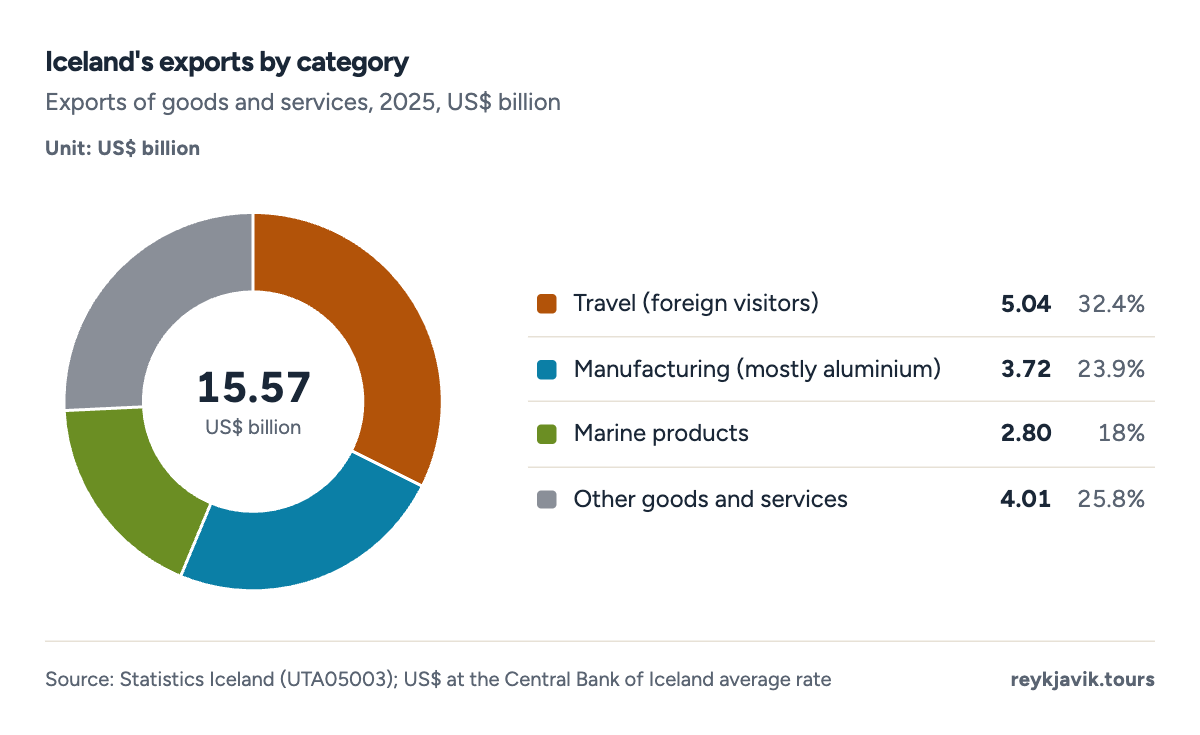
- Travel earned 32.4% of export revenue.
- Marine products earned 18.0%.
Projection: linear trend of 1990–2025 yearly values, 95% prediction range. Our calculation, not a forecast.
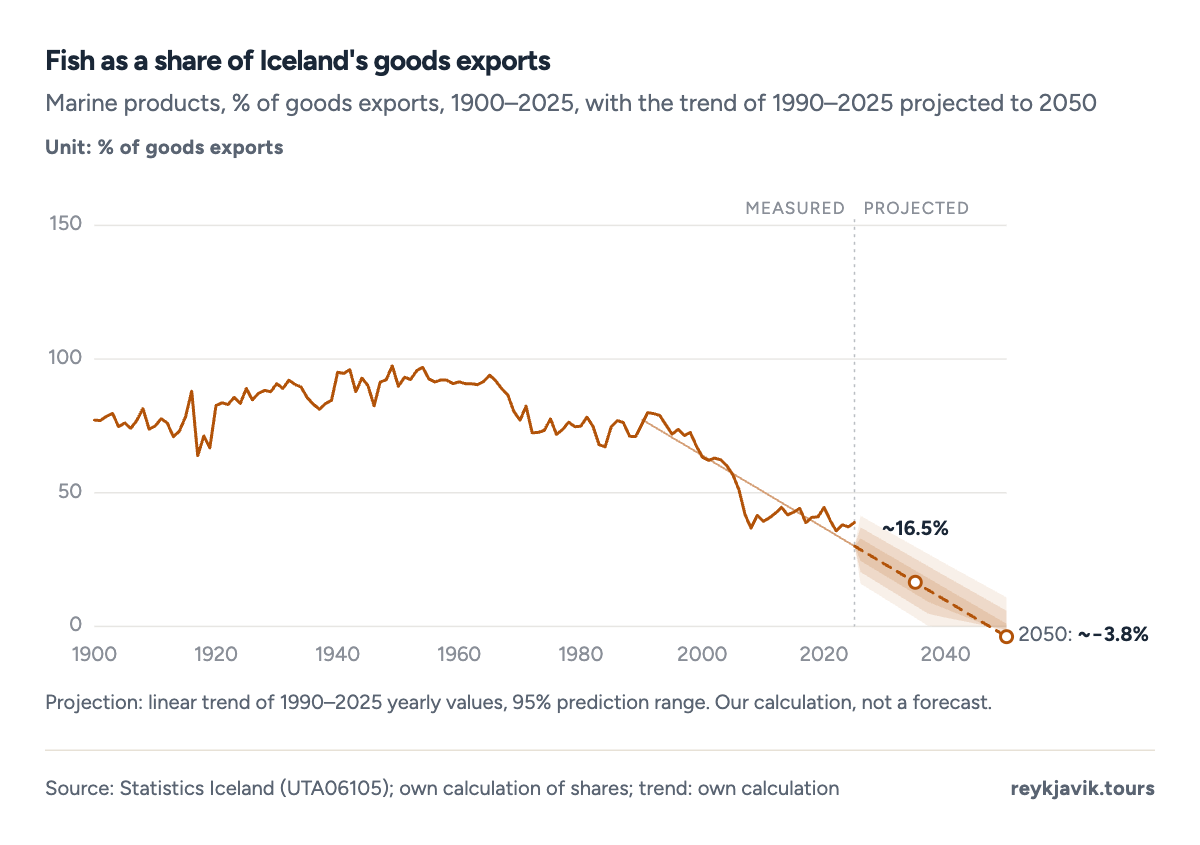
- Fish made up 89.8% of goods exports in 1950.
- The share was 38.9% in 2025.
| 2025 | 15.56 | 5.04 | 3.72 | 2.48 | 2.80 | 4.01 |
| 2024 | 14.09 | 4.51 | 3.53 | 2.27 | 2.51 | 3.54 |
| 2023 | 13.94 | 4.37 | 3.55 | 2.35 | 2.56 | 3.46 |
| 2022 | 13.61 | 3.36 | 4.21 | 2.98 | 2.67 | 3.38 |
| 2021 | 9.80 | 1.60 | 3.12 | 2.24 | 2.41 | 2.67 |
| 2020 | 7.53 | 0.83 | 2.21 | 1.54 | 2.08 | 2.41 |
| 2019 | 11.17 | 3.83 | 2.51 | 1.73 | 2.16 | 2.67 |
| 2018 | 12.39 | 4.80 | 2.97 | 2.12 | 2.31 | 2.32 |
| 2017 | 11.45 | 4.69 | 2.62 | 1.90 | 1.92 | 2.22 |
| 2016 | 10.02 | 3.85 | 2.24 | 1.51 | 2.01 | 1.93 |
| 2015 | 9.09 | 2.81 | 2.51 | 1.81 | 2.04 | 1.72 |
| 2014 | 9.19 | 2.63 | 2.66 | 1.84 | 2.12 | 1.78 |
| 2013 | 8.58 | 2.27 | 2.53 | 1.76 | 2.23 | 1.55 |
Iceland biggest trading partners
For goods, the Netherlands is by far the largest buyer: exports there were worth ISK 318 billion20 ($2.5 billion) in 2025, or 34.4% of all goods exports. The United Kingdom ($0.71 billion20) and the United States ($0.67 billion) follow. On the import side China leads with $1.30 billion20 (11.8% of goods imports), ahead of Norway and Germany. Iceland imported $11.0 billion20 of goods in 2025 and exported $7.2 billion, a goods deficit that services, mainly tourism, help to cover.
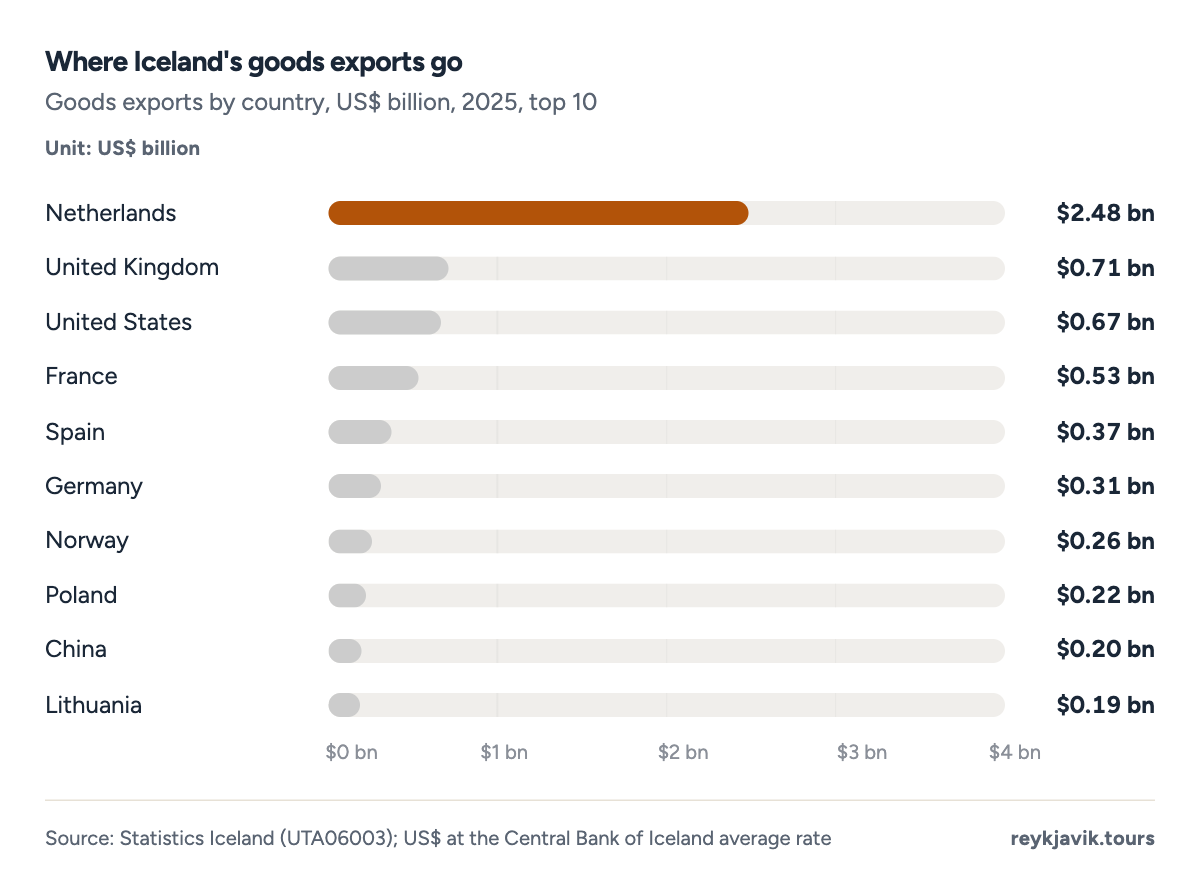
- The Netherlands took 34.4% of goods exports.
- The United States bought $0.67 billion.
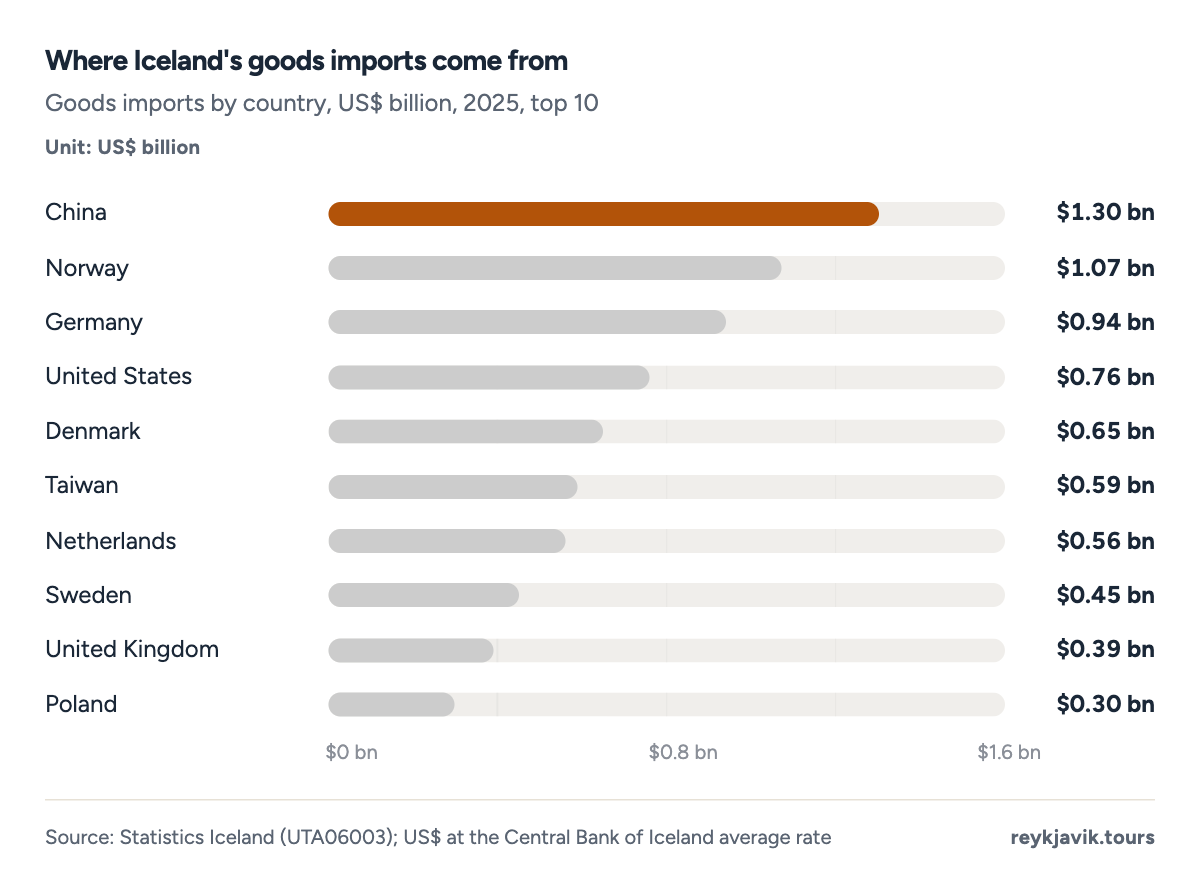
- China supplied 11.8% of goods imports.
- Norway supplied $1.07 billion.
| 1 | Netherlands | 2,475 | 34.4 | 559 |
| 2 | United Kingdom | 712 | 9.9 | 393 |
| 3 | United States | 666 | 9.3 | 760 |
| 4 | France | 525 | 7.3 | not in top 12 |
| 5 | Spain | 374 | 5.2 | not in top 12 |
| 6 | Germany | 315 | 4.4 | 942 |
| 7 | Norway | 262 | 3.6 | 1,072 |
| 8 | Poland | 217 | 3.0 | 301 |
| 9 | China | 198 | 2.8 | 1,296 |
| 10 | Lithuania | 192 | 2.7 | not in top 12 |
| 11 | Portugal | 188 | 2.6 | not in top 12 |
| 12 | Denmark | 158 | 2.2 | 650 |
Jobs, hours and the public sector
Iceland number of employees
Statistics Iceland's labour accounts count 223,16017 employed people in 2025, holding 257,30717 jobs, since some people have more than one. That is up from 179,330 people in 2008. Public administration, education and health employ the most, 66,53817 people or 29.8% of the total, followed by wholesale and retail trade (26,495), manufacturing (21,579) and construction (19,01717). Accommodation and food services employed 16,02717, and agriculture, forestry and fishing 6,867.
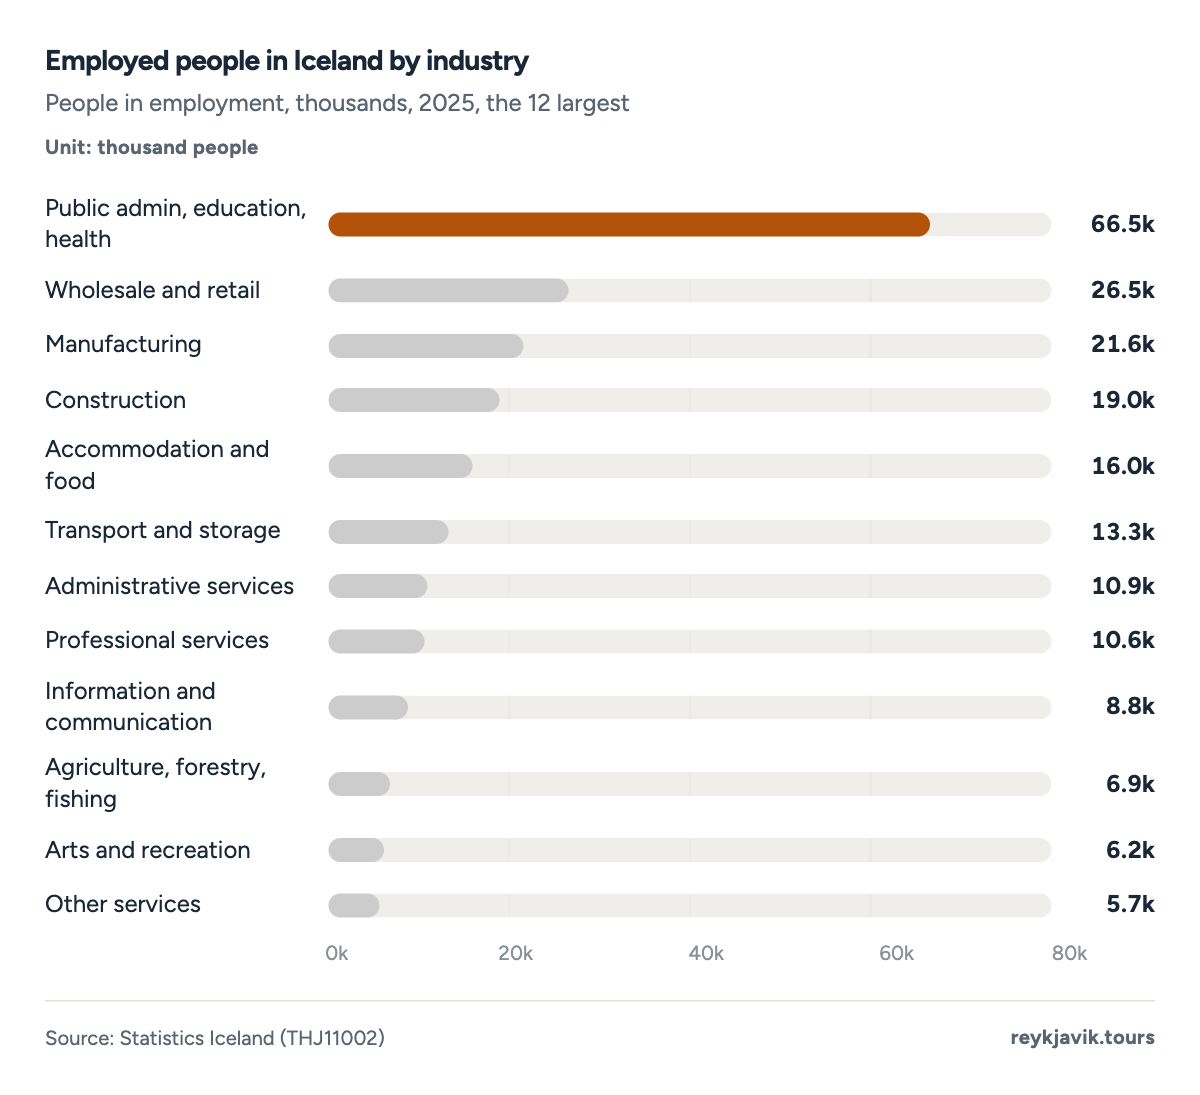
- Public administration, education and health employ 66,538.
- Construction employs 19,017.
| 1 | Public admin, education, health | 66,538 | 29.8 | 1,442 |
| 2 | Wholesale and retail | 26,495 | 11.9 | 1,238 |
| 3 | Manufacturing | 21,579 | 9.7 | 1,493 |
| 4 | Construction | 19,017 | 8.5 | 1,446 |
| 5 | Accommodation and food | 16,027 | 7.2 | 1,330 |
| 6 | Transport and storage | 13,350 | 6.0 | 1,605 |
| 7 | Administrative services | 10,948 | 4.9 | 1,386 |
| 8 | Professional services | 10,585 | 4.7 | 1,494 |
| 9 | Information and communication | 8,847 | 4.0 | 1,565 |
| 10 | Agriculture, forestry, fishing | 6,867 | 3.1 | 1,726 |
| 11 | Arts and recreation | 6,179 | 2.8 | 1,189 |
| 12 | Other services | 5,704 | 2.6 | 1,341 |
| 13 | Finance and insurance | 5,674 | 2.5 | 1,628 |
| 14 | Real estate | 1,996 | 0.9 | 1,495 |
| 15 | Electricity and heating | 1,898 | 0.9 | 1,719 |
| 16 | Water and waste | 1,297 | 0.6 | 1,610 |
Iceland average working hours
Dividing total hours worked by the number of employed people, the average person in work put in 1,437 hours17 in 2025, about 27.6 hours a week spread over a whole year including holidays. In 1991 the figure was 1,748 hours17 and in 2008 1,625. The trend line keeps falling towards 2050.
Projection: linear trend of 1991–2025 yearly values, 95% prediction range. Our calculation, not a forecast.
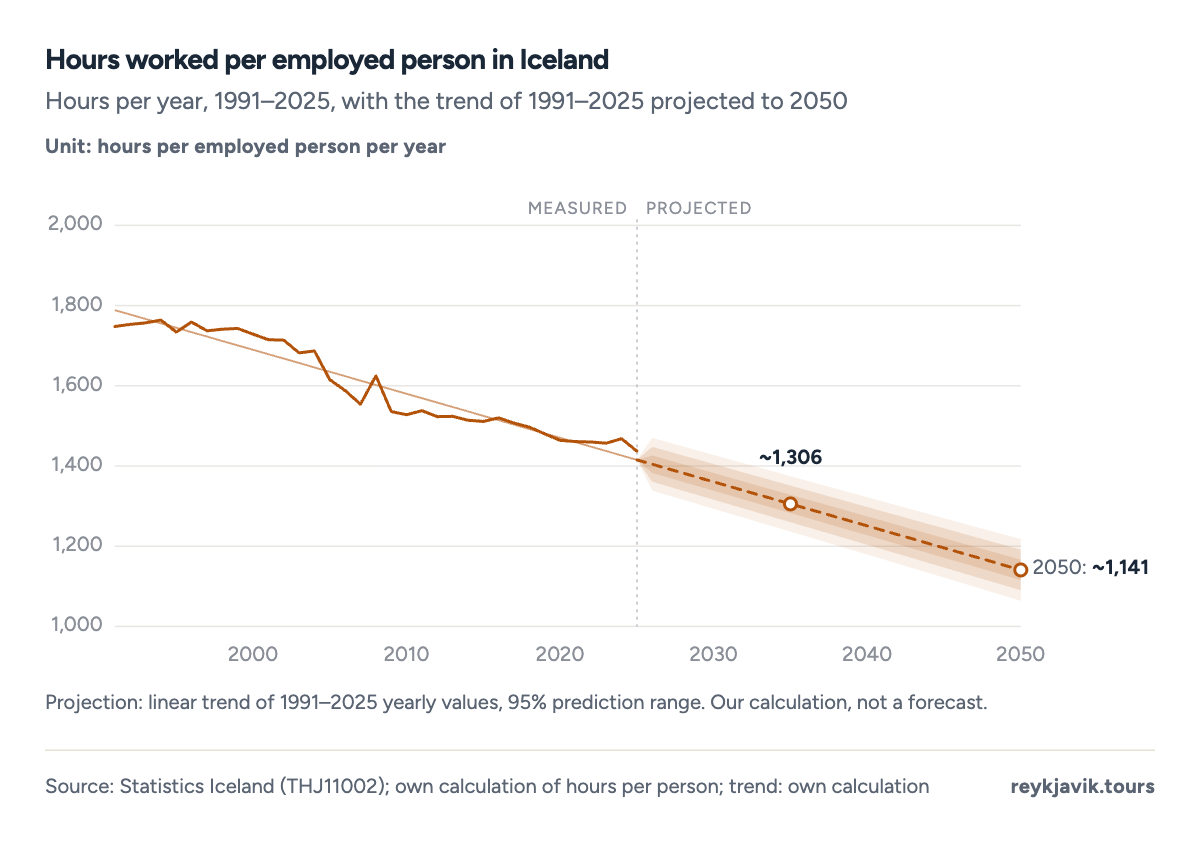
- The average was 1,437 hours in 2025.
- It was 1,748 hours in 1991.
Iceland public sector employment percentage
Register data for November show 60,22121 people working for the central government, municipalities, government enterprises and other public bodies in 2025, out of 224,33121 employed. That puts public sector employment at 26.8%21, our calculation from the register. The share peaked at 30.2%21 in the pandemic year 2020 and was 27.6% in 2008. Local government institutions employed 31,29021 people and central government institutions 23,65621.
Projection: linear trend of 2008–2025 yearly values, 95% prediction range. Our calculation, not a forecast.
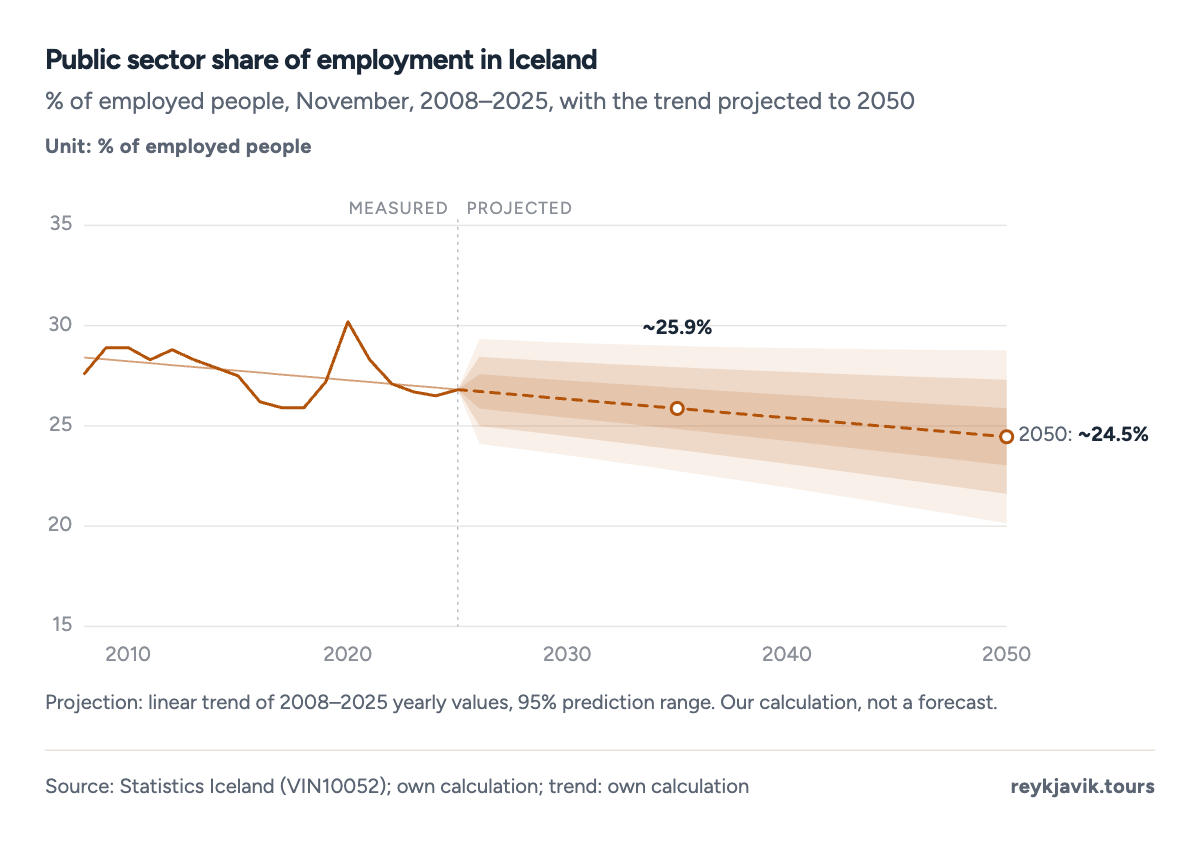
- The share was 26.8% in 2025.
- It peaked at 30.2% in 2020.
Prices and unemployment
Inflation rate of Iceland
Consumer price inflation was 4.1%12 in 2025, down from 8.7%12 in 2023. Iceland has a long history of high inflation: prices rose by 84.0%12 in 1983, the peak of the series, and by more than 10% again in 2008 and 2009. Statistics Iceland forecasts 3.5%11 for 2026 and 2.5% a year from 2028.
Unemployment rate of Iceland
The World Bank's modelled ILO estimate was 3.6%12 in 2025, against a peak of 7.6%12 in 2010 and 6.0% in the pandemic year 2021. Statistics Iceland's forecast expects 4.3%11 in 2026.
Projection: linear trend of 2000–2025 yearly values, 95% prediction range. Our calculation, not a forecast.
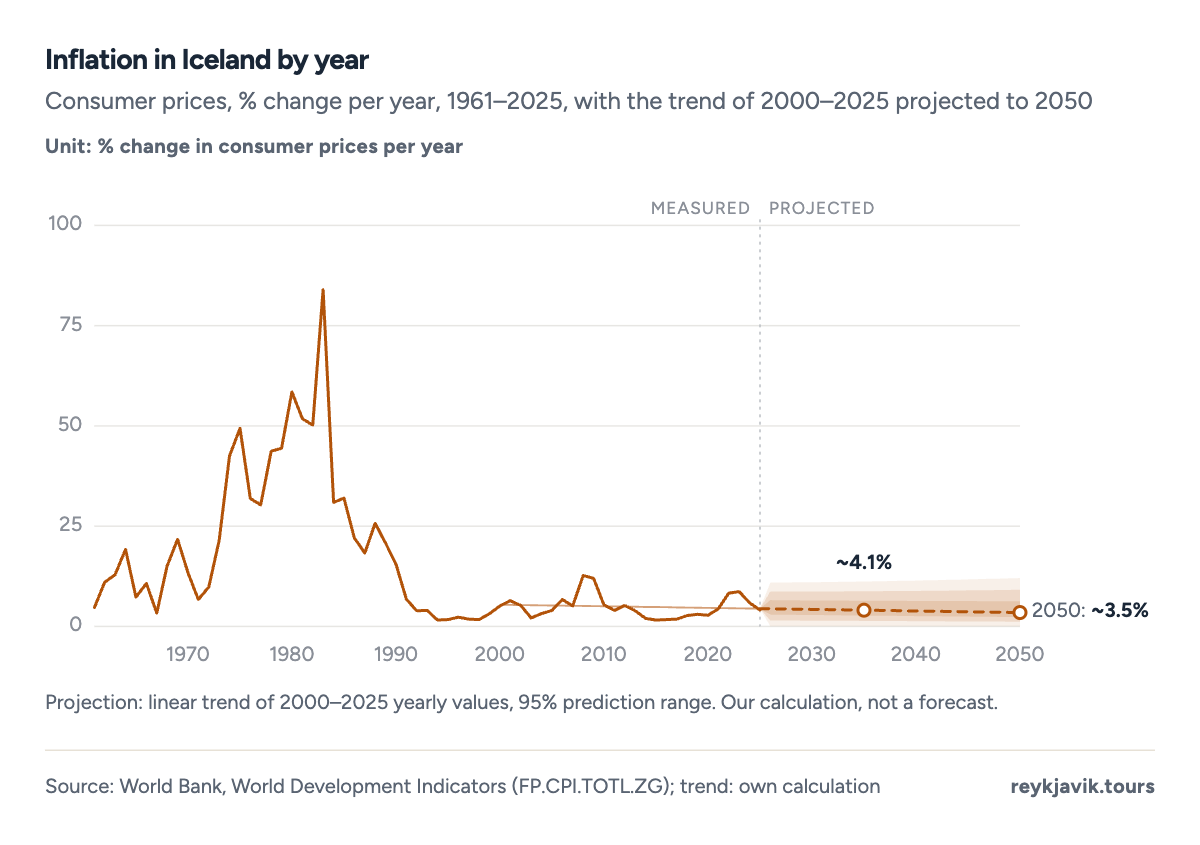
- Inflation peaked at 84.0% in 1983.
- It was 4.1% in 2025.
Projection: linear trend of 1991–2025 yearly values, 95% prediction range. Our calculation, not a forecast.
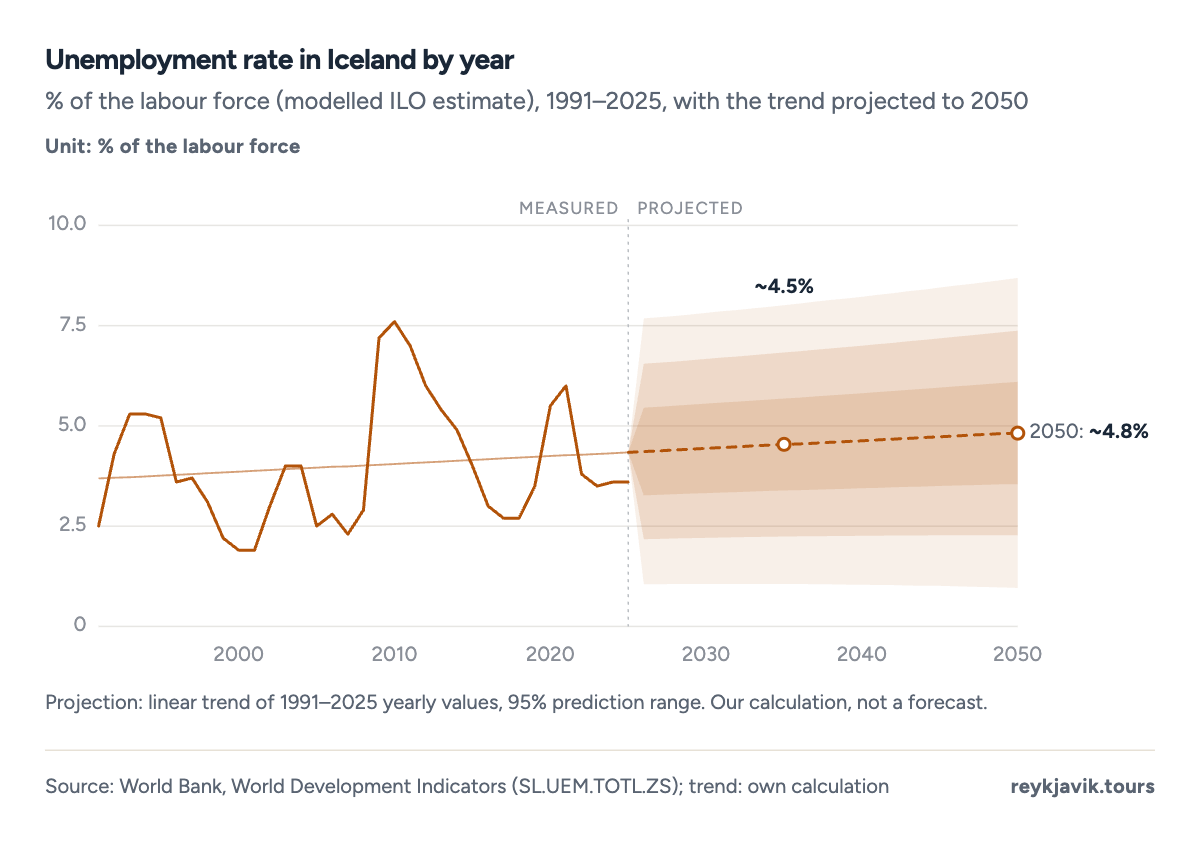
- Unemployment was 3.6% in 2025.
- It peaked at 7.6% in 2010.
How much debt does Iceland have?
Different measures give different answers. Statistics Iceland's broadest measure, total general government liabilities, was ISK 4.36 trillion13 at the end of 2025, about $34.0 billion, or 88.3% of GDP13. Subtracting the government's financial assets leaves net liabilities of ISK 1.89 trillion13 (38.2% of GDP). The IMF's narrower gross debt measure is 56.1% of GDP3 for 2025, and it expects it to fall to 43%3 by 2031. The World Bank's central government debt figure was 80.1% of GDP in 2023.
The trend is down. Liabilities peaked at 167.1% of GDP in 2011, three years after the crash, and have fallen in most years since, apart from a pandemic rise to 111.9%13 in 2020.
Iceland debt per capita
Spread over the 391,884 residents of 2025, general government liabilities come to about ISK 11.1 million13 per person, or $86,683. Net of financial assets, the figure is ISK 4.8 million, about $37,5692 per person, our calculation.
Projection: linear trend of 2005–2025 yearly values, 95% prediction range. Our calculation, not a forecast.
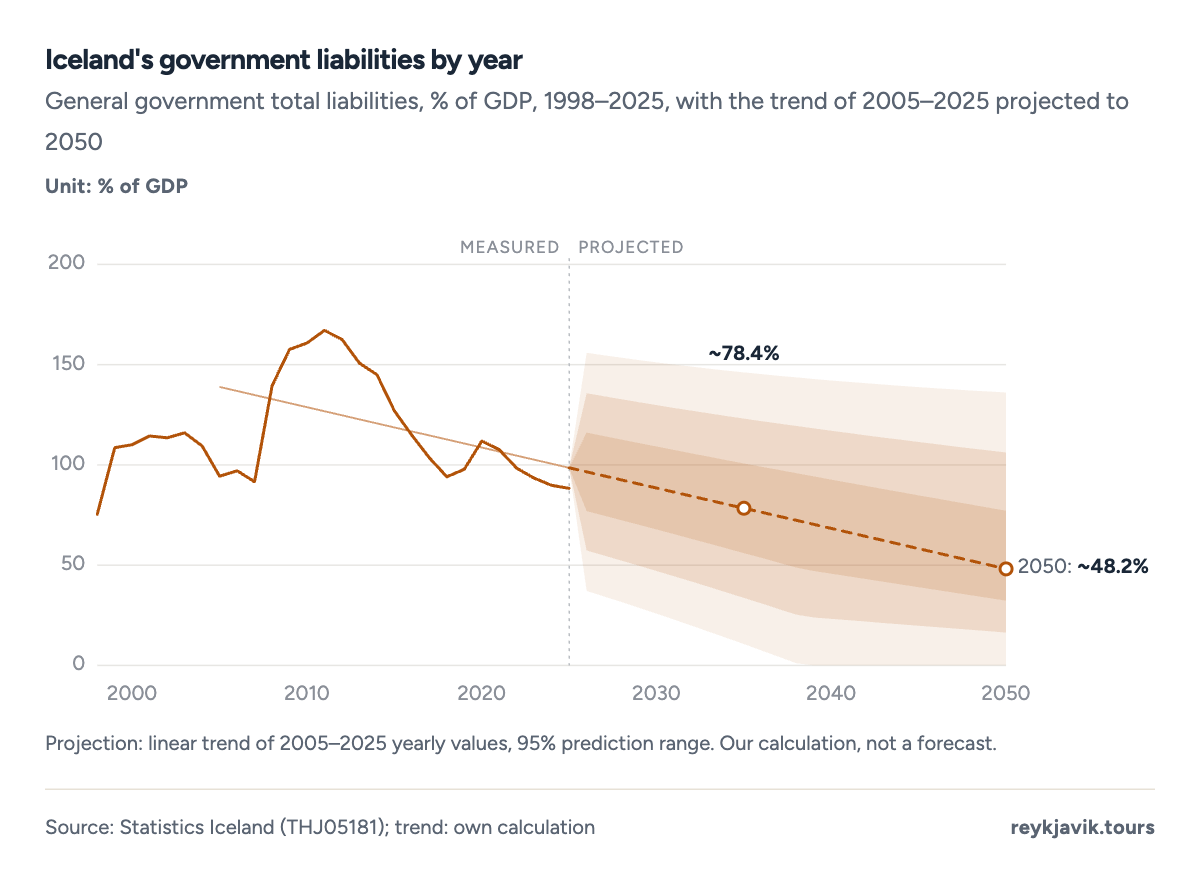
- Liabilities peaked at 167.1% of GDP in 2011.
- They were 88.3% in 2025.
Iceland public spending as percentage of GDP
General government expenditure, the state and municipalities together, was 45.7% of GDP10 in 2025, against revenue of 43.0%10, leaving a deficit of 2.6% of GDP. In 2023 spending was 45.3% of GDP. In krónur, spending came to ISK 2.26 trillion10 in 2025, or ISK 5.76 million per resident.
Social protection is the largest item at 11.03% of GDP22, followed by health (8.58%), general public services (7.87%) and education (7.03%22).
- Expenditure
- Revenue
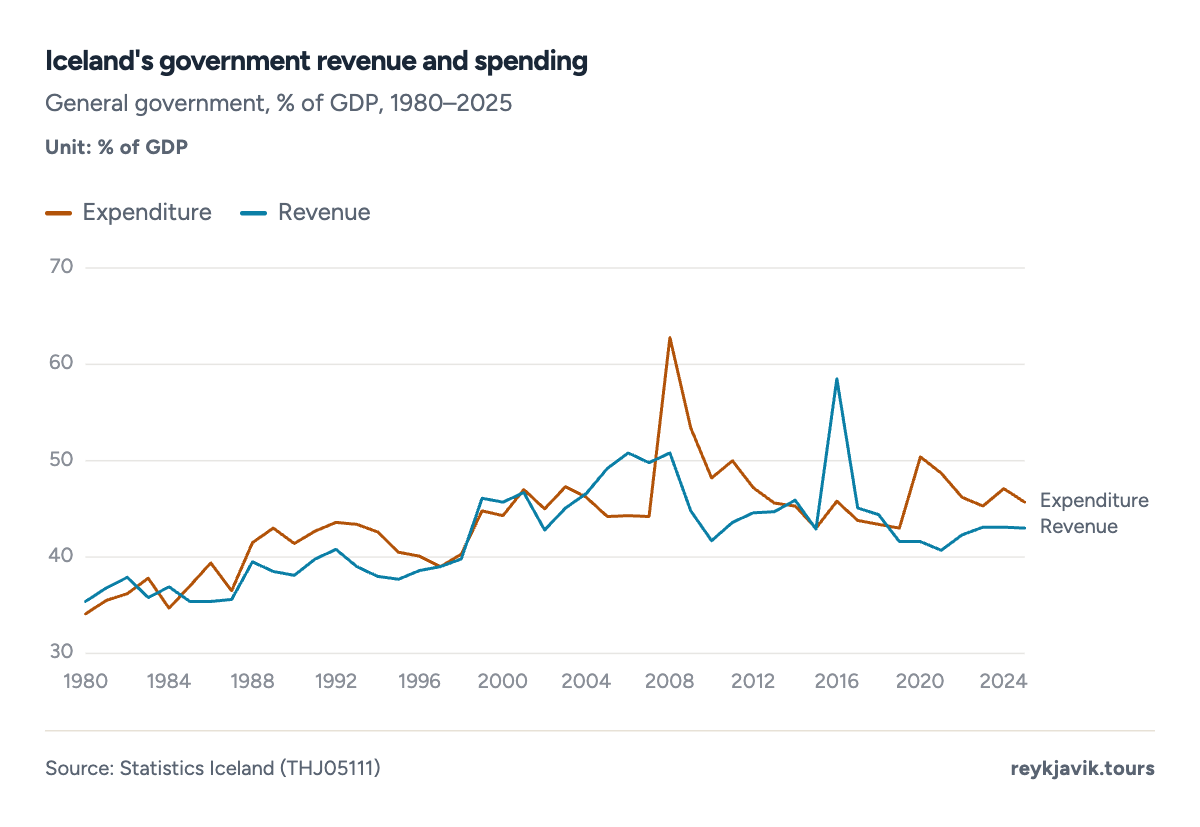
- Spending was 45.7% of GDP in 2025.
- It reached 62.8% in 2008.
- Social protection4.2424.1%
- Health3.3018.8%
- General public services3.0317.2%
- Education2.7115.4%
- Other functions4.2924.4%
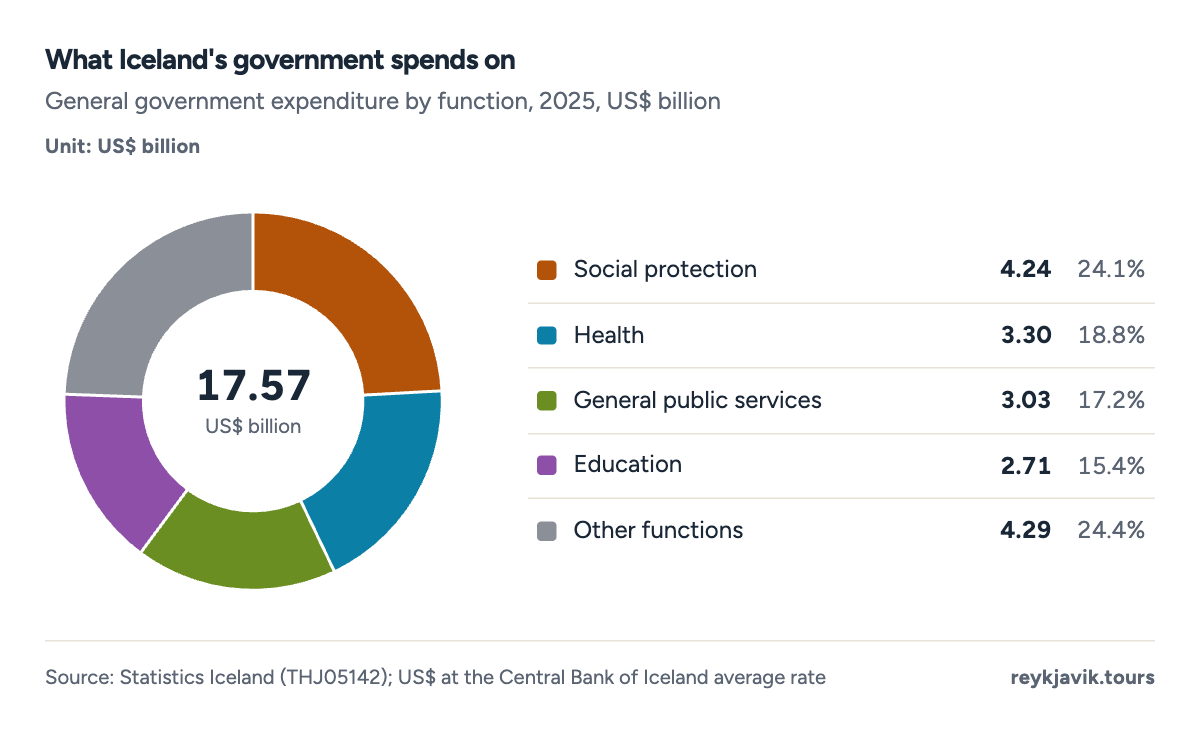
- Social protection took 24.2% of spending.
- Health took 18.8%.
| 1 | Social protection | 4,245 | 544.9 | 11.03 |
| 2 | Health | 3,304 | 424.1 | 8.58 |
| 3 | General Public service | 3,030 | 388.9 | 7.87 |
| 4 | Education | 2,707 | 347.5 | 7.03 |
| 5 | Economic affairs | 1,945 | 249.6 | 5.05 |
| 6 | Recreation, culture and religion | 1,164 | 149.4 | 3.02 |
| 7 | Public order and safety | 592 | 75.9 | 1.54 |
| 8 | Housing and community amenities | 204 | 26.2 | 0.53 |
| 9 | Defence | 102 | 13.1 | 0.27 |
| 10 | Total expenditure (all functions) | 17,573 | 2,255.9 | 45.65 |
| 2025 | 43.0 | 45.7 | −2.6 | 88.3 |
| 2024 | 43.1 | 47.1 | −4.1 | 89.8 |
| 2023 | 43.1 | 45.3 | −2.1 | 93.4 |
| 2021 | 40.7 | 48.7 | −8.0 | 107.6 |
| 2020 | 41.6 | 50.4 | −8.8 | 111.9 |
| 2019 | 41.6 | 43.0 | −1.4 | 97.8 |
| 2015 | 42.9 | 43.0 | −0.1 | 127.0 |
| 2011 | 43.6 | 50.0 | −6.4 | 167.1 |
| 2009 | 44.8 | 53.4 | −8.5 | 157.6 |
| 2008 | 50.8 | 62.8 | −12.0 | 139.5 |
| 2007 | 49.8 | 44.2 | +5.6 | 91.6 |
| 2006 | 50.8 | 44.3 | +6.4 | 97.1 |
| 2000 | 45.7 | 44.3 | +1.4 | 110.1 |
| 1990 | 38.1 | 41.4 | −3.3 | no data |
| 1980 | 35.4 | 34.1 | +1.3 | no data |
How much does Iceland spend on military?
Iceland has no armed forces. NATO describes it as the only member of the alliance without a military: "Iceland, unique among NATO Allies, does not have a military."23 Instead, the Icelandic Coast Guard and host-nation support for allied forces at Keflavík form its contribution. In the government accounts, the defence function cost ISK 13.1 billion22 in 2025, about $102 million, or 0.27% of GDP22, up from 0.21% in 2024.
Household debt
Households carry debt too. Their total financial liabilities were 77% of GDP24 in 2024, down from a peak of 114%24 in 2009. Against that, households held financial assets worth 289% of GDP.
Projection: linear trend of 2003–2024 yearly values, 95% prediction range. Our calculation, not a forecast.
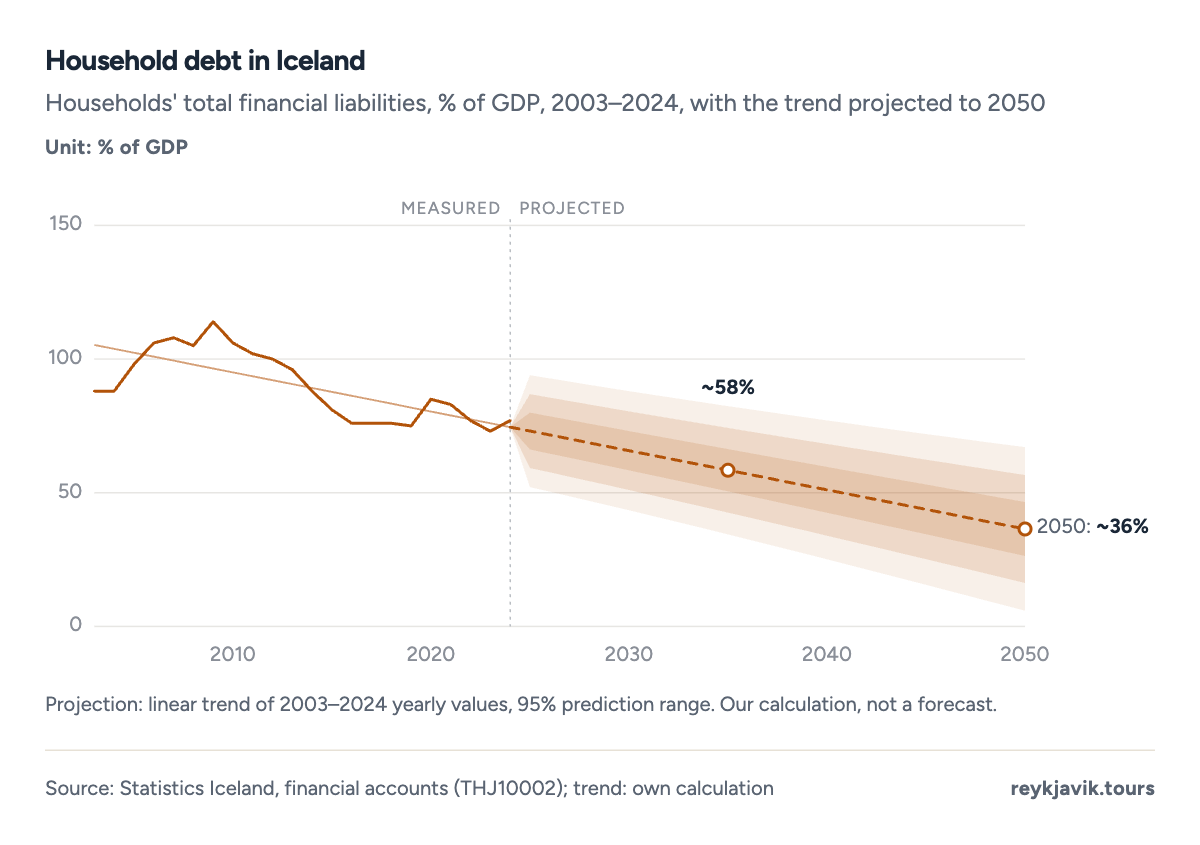
- Household debt was 77% of GDP in 2024.
- It peaked at 114% in 2009.
Projection: linear trend of 2000–2025 yearly values, 95% prediction range. Our calculation, not a forecast.
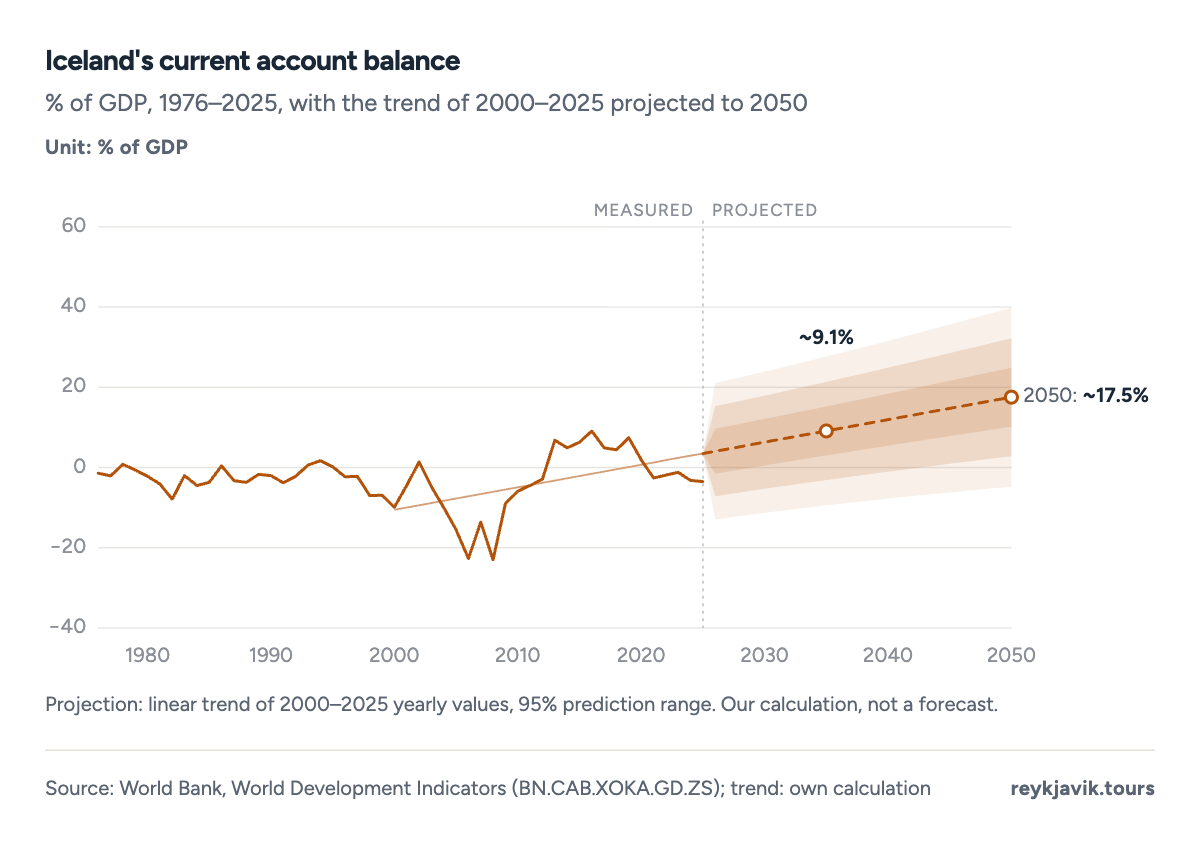
- The deficit reached -23.0% of GDP in 2008.
- The balance was -3.5% in 2025.
How much is Iceland worth?
There is no official price for a country, but the national accounts measure what it owns. Iceland's fixed capital stock, its buildings, infrastructure, machinery and other produced assets, was valued at ISK 14.6 trillion25 in 2025, about $114 billion, or 3.0 times that year's GDP. It covers produced assets only, not land or natural resources such as fish stocks.
Financial wealth is on top of that. At the end of 2024 Iceland's pension funds held financial assets equal to 188% of GDP24, about $62 billion. Taken together, the country's domestic sectors, meaning households, companies, banks, pension funds and government, held net financial assets against the rest of the world equal to 54% of GDP24, roughly $18 billion, our calculation. After the 2008 collapse the same measure was -717% of GDP24, the year the banks collapsed. It turned positive in 2017.
Projection: linear trend of 2017–2024 yearly values, 95% prediction range. Our calculation, not a forecast.
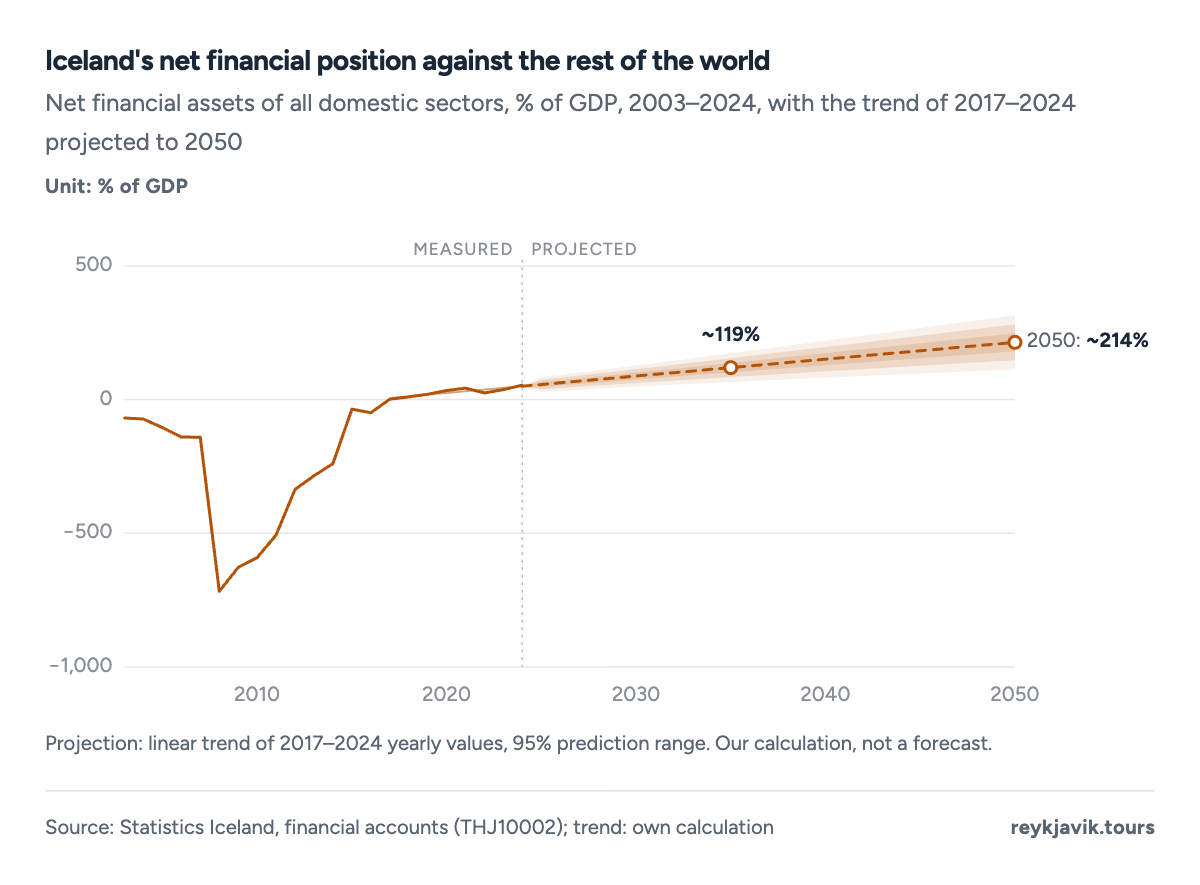
- The position was +54% of GDP in 2024.
- It was -717% in 2008.
| Fixed capital stock | 296 | 114 | 2025 |
| Pension funds' financial assets | 188 | 62 | 2024 |
| Households' financial assets | 289 | 96 | 2024 |
| Households' liabilities | 77 | 26 | 2024 |
| General government liabilities | 88.3 | 34.0 | 2025 |
| General government net financial liabilities | 38.2 | 14.7 | 2025 |
| Net financial assets vs rest of the world | +54 | +18 | 2024 |
What the numbers mean
Iceland's GDP per person is among the highest in the world, but the dollar figure is volatile. It fell by 41% between 2007 and 2009 and rose by 14.5% in 2025 alone, mostly on the exchange rate. For comparisons over time, real growth and the PPP figure are steadier guides: PPP GDP per person barely changed between 2024 and 2025.
The economy also leans on a few earners. Travel, aluminium and fish together earned about 66% of export revenue in 2025, and tourism alone was 8.8% of GDP. In 2020, when tourism's share of GDP dropped to 2.9%, GDP fell by 6.6%. Public finances, by contrast, have recovered from the crash: government liabilities are close to half of their 2011 peak relative to GDP, and the country as a whole is now a net creditor to the rest of the world.
Conclusions
- Iceland is one of the world's richest countries per person. World Bank data give $98,323 for 2025, and the IMF expects $110,048 in 2026, which would make Iceland 5th in the world.
- The headline figure depends on the krona. Dollar GDP per person rose 14.5% in 2025 while real GDP per person fell 0.3%; at PPP, Iceland's $83,431 is lower and steadier.
- Tourism has become the largest export earner. Travel brought in 32.4% of export revenue in 2025, while fish fell from 90% of goods exports in 1950 to 39% in 2025.
- The 2008 crash left deep but fading marks. Government liabilities peaked at 167.1% of GDP in 2011 and were 88.3% in 2025, and the country's net financial position swung from -717% of GDP in 2008 to +54% in 2024.
Methodology
- GDP per person 1960–2025
- IMF forecasts to 2031
- 38 countries compared
- Checked Sept 16, 2026
Definition. GDP per capita is gross domestic product divided by the population. Nominal figures use market exchange rates in current US dollars; PPP figures use purchasing power parities in international dollars. GNI per capita adds net income from abroad (World Bank Atlas method).
Data sources. GDP per capita, PPP, GNI, total GDP, growth, inflation, unemployment, current account and arable land from the World Bank's World Development Indicators;1 forecasts and world ranking from the IMF's World Economic Outlook;3 national accounts, industries, tourism, exports, trading partners, employment, hours, public sector, government finances, capital stock and financial accounts from Statistics Iceland's PX tables;5 yearly USD/ISK averages from the Central Bank of Iceland;2 military status from NATO.23
Calculations. ISK amounts are converted to US dollars at each year's average Central Bank of Iceland rate. Shares of exports, marine share of goods exports, public sector share (central and local government institutions, government enterprises and other public bodies in November register data), hours per person, debt per person and US$ values of balance-sheet ratios are our calculations. Trend projections are least-squares lines with a 95% prediction range, not forecasts.
Limitations. World Bank, IMF and Statistics Iceland figures differ slightly because of revisions, population measures and exchange rates. The 2025 World Bank figures are the first estimates. Government liabilities (Statistics Iceland) are a broader measure than IMF gross debt. The capital stock excludes land and natural resources, so it is not a full value of the country. No official list of the largest companies exists, so none is shown.
Sources
- World Bank. “World Development Indicators: GDP per capita (current US$), NY.GDP.PCAP.CD, Iceland.” World Bank. data.worldbank.org. Accessed 16 Sept. 2026. Back to text
- Central Bank of Iceland (Seðlabanki Íslands). “Official exchange rate, USD/ISK (yearly averages computed from daily rates).” Central Bank of Iceland. sedlabanki.is. Accessed 16 Sept. 2026. Back to text
- International Monetary Fund. “World Economic Outlook database (DataMapper): GDP per capita, PPP per capita, real GDP growth, inflation, unemployment, gross government debt.” IMF. imf.org. Accessed 16 Sept. 2026. Back to text
- Statistics Iceland (Hagstofa Íslands). “GDP per capita 1980–2024 (THJ01401).” Statistics Iceland. px.hagstofa.is. Accessed 16 Sept. 2026. Back to text
- Statistics Iceland (Hagstofa Íslands). “Overview of Gross Domestic Product and Gross National Income 1945–2025 (THJ01000).” Statistics Iceland. px.hagstofa.is. Accessed 16 Sept. 2026. Back to text
- World Bank. “World Development Indicators: GDP per capita, PPP (current international $), NY.GDP.PCAP.PP.CD.” World Bank. data.worldbank.org. Accessed 16 Sept. 2026. Back to text
- World Bank. “World Development Indicators: GNI per capita, Atlas method (NY.GNP.PCAP.CD) and PPP (NY.GNP.PCAP.PP.CD).” World Bank. data.worldbank.org. Accessed 16 Sept. 2026. Back to text
- World Bank. “World Development Indicators: GDP per capita, current US$ and PPP, 38 European and OECD countries.” World Bank. data.worldbank.org. Accessed 16 Sept. 2026. Back to text
- World Bank. “World Development Indicators: GDP (current US$), NY.GDP.MKTP.CD, and GDP growth (annual %), NY.GDP.MKTP.KD.ZG.” World Bank. data.worldbank.org. Accessed 16 Sept. 2026. Back to text
- Statistics Iceland (Hagstofa Íslands). “General government main aggregates 1980–2025 (THJ05111).” Statistics Iceland. px.hagstofa.is. Accessed 16 Sept. 2026. Back to text
- Statistics Iceland (Hagstofa Íslands). “Economic forecast: main indicators 2025–2031 (THJ07000).” Statistics Iceland. px.hagstofa.is. Accessed 16 Sept. 2026. Back to text
- World Bank. “World Development Indicators: inflation, consumer prices (FP.CPI.TOTL.ZG), unemployment (SL.UEM.TOTL.ZS), current account balance (BN.CAB.XOKA.GD.ZS), exports of goods and services (NE.EXP.GNFS.ZS), central government debt (GC.DOD.TOTL.GD.ZS).” World Bank. data.worldbank.org. Accessed 16 Sept. 2026. Back to text
- Statistics Iceland (Hagstofa Íslands). “General government financial assets and liabilities 1998–2025 (THJ05181).” Statistics Iceland. px.hagstofa.is. Accessed 16 Sept. 2026. Back to text
- Statistics Iceland (Hagstofa Íslands). “Gross domestic product by activity, share of GDP 1995–2025 (THJ08401).” Statistics Iceland. px.hagstofa.is. Accessed 16 Sept. 2026. Back to text
- Statistics Iceland (Hagstofa Íslands). “Exports of goods and services by main category, quarterly (UTA05003).” Statistics Iceland. px.hagstofa.is. Accessed 16 Sept. 2026. Back to text
- Statistics Iceland (Hagstofa Íslands). “Tourism satellite accounts: tourism direct GDP and hours worked (SAM08008).” Statistics Iceland. px.hagstofa.is. Accessed 16 Sept. 2026. Back to text
- Statistics Iceland (Hagstofa Íslands). “Employment and hours worked by economic activity 1991–2025 (THJ11002).” Statistics Iceland. px.hagstofa.is. Accessed 16 Sept. 2026. Back to text
- World Bank. “World Development Indicators: arable land (% of land area), AG.LND.ARBL.ZS; food and ores and metals exports (% of merchandise exports).” World Bank. data.worldbank.org. Accessed 16 Sept. 2026. Back to text
- Statistics Iceland (Hagstofa Íslands). “Exports by main categories 1840–2025 (UTA06105).” Statistics Iceland. px.hagstofa.is. Accessed 16 Sept. 2026. Back to text
- Statistics Iceland (Hagstofa Íslands). “Imports and exports by countries 2025 (UTA06003).” Statistics Iceland. px.hagstofa.is. Accessed 16 Sept. 2026. Back to text
- Statistics Iceland (Hagstofa Íslands). “Employed persons by economic sector, register data, November (VIN10052).” Statistics Iceland. px.hagstofa.is. Accessed 16 Sept. 2026. Back to text
- Statistics Iceland (Hagstofa Íslands). “General government total expenditure by functions 1998–2025 (THJ05142).” Statistics Iceland. px.hagstofa.is. Accessed 16 Sept. 2026. Back to text
- NATO. “Iceland and NATO.” North Atlantic Treaty Organization. nato.int. Accessed 16 Sept. 2026. Back to text
- Statistics Iceland (Hagstofa Íslands). “Financial assets and liabilities as a share of GDP 2003–2024 (THJ10002).” Statistics Iceland. px.hagstofa.is. Accessed 16 Sept. 2026. Back to text
- Statistics Iceland (Hagstofa Íslands). “Capital stock 1945–2025 (THJ03201).” Statistics Iceland. px.hagstofa.is. Accessed 16 Sept. 2026. Back to text
About the author
Laufey turns public statistics on tourism and travel into research people can check and cite.
Every figure on this page links to its source. How we research
Related research
More data on Iceland's weather and travel from Reykjavik Tours.
- EconomyAverage Salary in Iceland (2026 Data)$8,242 average monthly salary, full-timeRead the research →
- EconomyAverage Cost of Living in Iceland (2026 Data)$3,679/month average cost of living in Iceland (single person)Read the research →
- HousingAverage Rent in Iceland (2026 Data)ISK 269k average monthly rent in IcelandRead the research →
- HousingHow Much Is a House in Iceland? (2026 Data)$467k-779k typical capital-region apartmentRead the research →
- TransportHow Many Airports in Iceland? (2026 Data)33 airports in IcelandRead the research →
- Travel costsHow Much Are Hotels in Iceland? (2026 Data)$196 a night for a typical hotel roomRead the research →