Average Rent in Iceland (2026 Data)
Rent in Iceland by apartment size and city: the official rent index 2008-2025, current Reykjavik and regional rents, affordability against wages.
- Published
- Updated
- 8 sources
- 12 statistics
- 10 min read

- M.Sc. in Atmospheric Sciences, University of Iceland (Háskóli Íslands), with a minor thesis on North Atlantic storm-track variability
- Former research assistant at the Icelandic Meteorological Office (Veðurstofa Íslands), working on subarctic climate modeling and volcanic-ash dispersion forecasting
- B.A. in Sociology, also from the University of Iceland, with fieldwork on rural depopulation and tourism's impact on small fishing communities (Westfjords focus)
- Grew up in Akureyri, spent seven years living in Reykjavík and two in a small village in the Westfjords - brings first-hand experience of Iceland's regional weather extremes and community life
- Fluent in Icelandic and English; has translated Icelandic Met Office public advisories for international outlets
- Published field notes and data-driven pieces on glacier retreat (Vatnajökull), aurora forecasting, and the socioeconomic effects of overtourism in the Golden Circle

- M.A. in Journalism, University of Iceland, with additional coursework in Environmental Communication at the University of Bergen (Norway), giving a comparative Nordic lens
- 12+ years in Icelandic media, including editorial roles at RÚV (Iceland's national broadcaster) covering weather-related public safety reporting (storms, volcanic eruptions, road closures)
- Former fact-checking lead for a travel-and-culture desk, specializing in verifying tourism statistics, safety advisories, and climate data against primary sources (Vedur.is, Statistics Iceland)
- Has overseen editorial standards for bilingual (Icelandic/English) publications, ensuring both cultural nuance and accuracy for international readers
- Advocate for citing primary sources (Icelandic Met Office, Icelandic Tourist Board / Ferðamálastofa) rather than secondhand reporting
Key findings
- ISK 269kThe average registered market rent in Iceland is about ISK 269k (~$2,100) a month.
- 250-350kA capital-region one-bedroom rents for ISK 250-350k per month (2026).
- +75%Rents are up +75% since 2008 - and have never fallen on an annual basis.
- 35-40%The median renter spends 35-40% of net pay on rent - at the overburden threshold.
- 20-30%Regional towns rent 20-30% below Reykjavik for equivalent space.
- $1,600Reykjavik one-bedroom city-centre rents top the Nordic capitals at about $1,600.
The average rent in Iceland is about ISK 269,000 per month - roughly $2,100 - for a registered market-rent unit in 20261, with capital-region one-bedroom flats quoting ISK 220,000-300,0002 and two-bedrooms reaching ISK 450,000. And the rent index tells a starker story than any single number: rents have risen about 75% since 2008 and have never fallen on an annual basis3.
Iceland rents are the expensive end of an expensive country - Reykjavik's one-bedroom city-centre rents top every other Nordic capital in crowdsourced data4. This page gives the official index, the current levels by size and region, and the affordability arithmetic that explains why renting in Iceland has become a national political topic.
How much is rent in Iceland?
What is the average rent in Iceland? For 2026 the working numbers are these - and they are ranges, not points, because Icelandic landlords price by view, postcode and renovation vintage within the same building. A studio or one-bedroom apartment in the capital region costs ISK 250,000-350,000 a month (about $1,950-2,730), a two-bedroom runs ISK 300,000-450,000 ($2,340-3,500), and the national average across all registered units is ISK 268,9261, about $2,0951. Outside the capital the same money buys noticeably more: regional one-bedrooms commonly list 20-30% below the Reykjavik equivalents2.
The Iceland average rent is the same story expressed as a single number. How much is rent in Iceland in US dollars? The ISK 269,000 average converts to about $2,0955 at the 2025 rate - but the dollar figure has swung between $1,800 and $2,300 over two years purely on the exchange rate, which is why long-stay renters negotiate in krona and short-stay visitors see dollar listings5. How much is rent in Iceland per month for a family? A comfortable three-bedroom in the capital lists from ISK 450,000, and family houses - rare in central Reykjavik - rent from ISK 550,000 upward2. The waiting lists for subsidised family housing stretch years, which funnels exactly the households with the least slack into the most expensive segment of the private market - the arithmetic that keeps the rental question at the centre of every budget debate2. The US-dollar versions of every figure move with the krona: the same ISK 269,000 flat that cost $1,900 in early 2024 briefly cost under $1,800 a year later without any rent change at all - the dollar answer is a currency answer as much as a market one5.
The numbers include heating and water - Icelandic rentals come with geothermal hot water as standard - but exclude electricity and, in most contracts, the deposit, which by law can reach three months' rent held in a blocked account2.
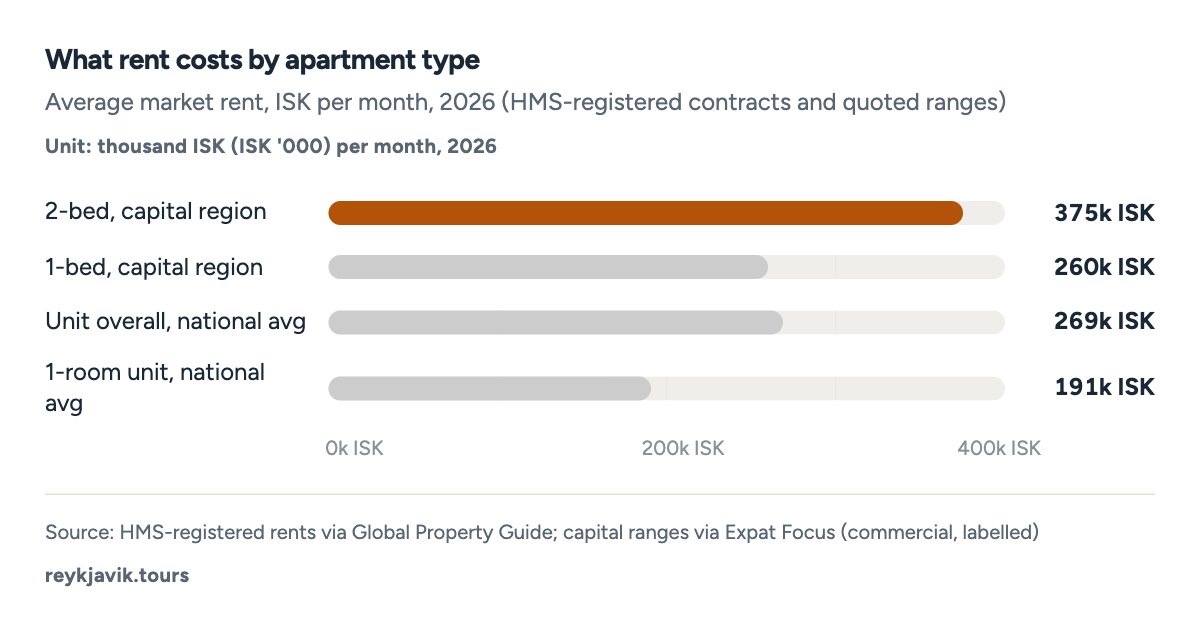
- The average registered market rent is about ISK 269,000 a month - roughly $2,100.
- A capital-region two-bedroom costs about ISK 375,000 ($2,900) a month.
- Even a one-room unit averages ISK 191,000 ($1,490).
| 1-room unit (national avg) | 190,843 | 1,487 |
| Unit overall (national avg) | 268,926 | 2,095 |
| 1-bed, capital region | 260,000 | 2,025 |
| 2-bed, capital region | 375,000 | 2,921 |
The rent index: 75% up and never down
The official rent subindex has climbed about 75% since 20083, and its shape is the housing shortage made visible. The index accelerated sharply in 2017-2019, when record tourism, new household formation and stagnant supply collided; it kept climbing through the pandemic; and in 2024-2025 it continued at rates well above the general CPI trend shown in the comparison chart3.
The average rent in Iceland 2025 profile by size, compiled from listings: studios from about ISK 190,000, one-bedrooms 220,000-300,000, two-bedrooms 300,000-450,000, and family houses from ISK 550,000 - with central-postcode premiums of 10-20% over the commuting districts for the same square metres2.
Two features make Icelandic renting unusual. First, nearly all rents are inflation-indexed - the contract rises automatically with the CPI, so real rents never fall even when nominal increases pause. Second, there is effectively no rent control on new contracts, which keeps the market liquid but leaves tenants exposed to the market rate at every renewal2. How the index is built explains its personality: Statistics Iceland samples registered rents across the country, weights them by dwelling type and publishes the subindex monthly, so the index follows sitting contracts as much as new lets. A landlord and tenant signing an indexed five-year contract in 2015 still move the 2025 index with each automatic increase - newcomers pay the jump immediately, while the statistics absorb it over years of indexed steps3.
How the index is built explains its personality. Statistics Iceland samples registered rents across the country, weights them by dwelling type, and publishes the subindex monthly - which means the index follows sitting contracts as much as new lets. A landlord and tenant signing an indexed five-year contract in 2015 are still moving the 2025 index with each automatic increase. This is why the index's climb feels slower than the market's: newcomers pay the jump immediately, while the statistics absorb it over years of indexed steps3.
Projection: linear trend of 2008–2025 yearly values, 95% prediction range. Our calculation, not a forecast.
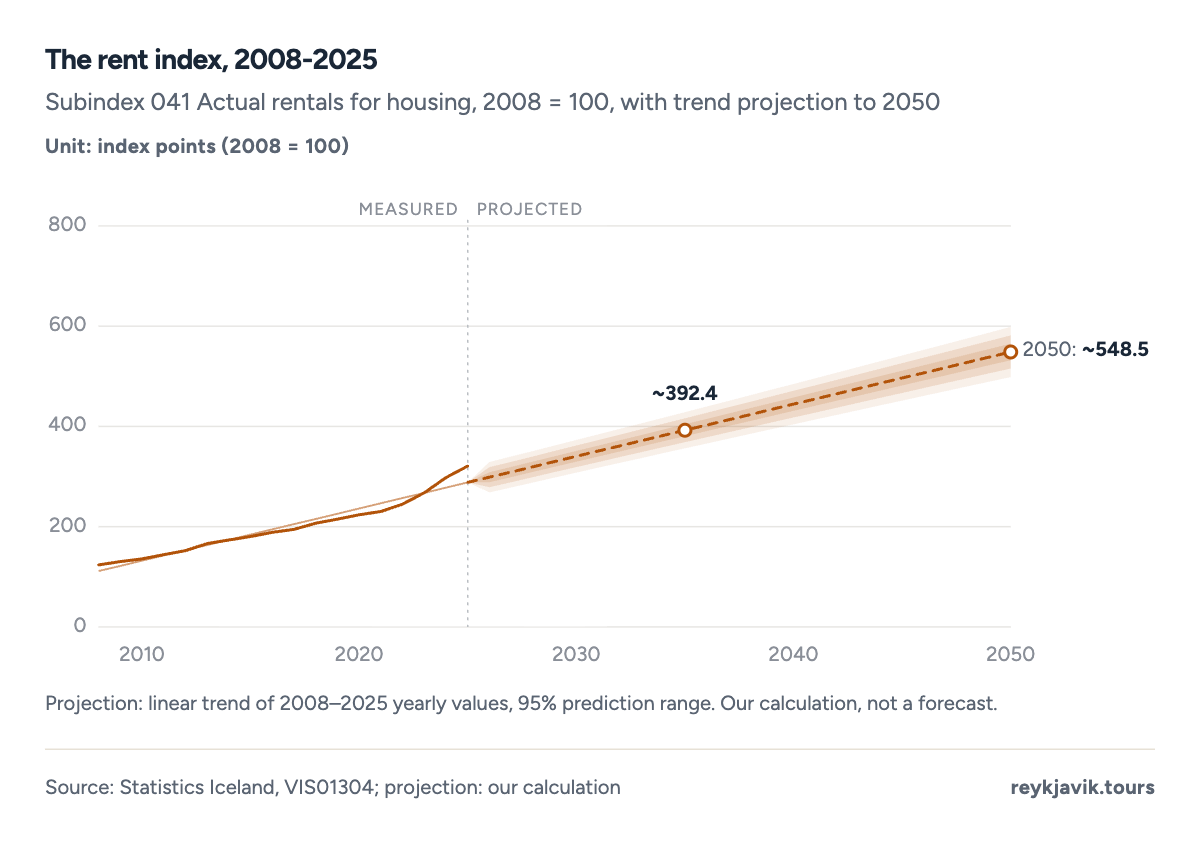
- Rents have risen about 75% since 2008, and never fallen year-on-year.
- The steepest jumps came in 2017-2019, when the tourism boom met a housing shortage.
- The projection points past 190 index points by the mid-2030s - our calculation, not a forecast.
| 2010 | 135.8 |
| 2015 | 180.3 |
| 2020 | 223.7 |
| 2025 | 320.9 |
Rent vs wages: the affordability line
Dividing the rent index by the wage index shows what renting does to a payslip: since 2008, rents have outpaced wages for most of the period, and the ratio sits well above its 2008 starting point6. The exceptions - years when wage settlements outran rent hikes - are recent, which is the first statistical good news for tenants in the series7.
In cash terms, the average ISK 269,000 rent consumes roughly 35-40% of a median net salary in Reykjavik6 - the classic overburden threshold is 40%, so the median renter sits at the edge of it, and anyone earning below the median crosses it. This is why rental affordability, not house prices, dominates Icelandic housing politics today7.
And the average rent in Iceland including the extras? Add the deposit lock-up (up to three months' rent), the optional furniture premium of 10-20%, and utilities in the darker months - the real monthly cost of occupying a Reykjavik flat runs ISK 30,000-60,000 above the headline rent for a typical household2. The affordability line in the chart already includes the rent itself but not these add-ons; the honest all-in figure for a capital one-bedroom is closer to $2,300-2,600 a month once everything is counted6.
Projection: linear trend of 2008–2025 yearly values, 95% prediction range. Our calculation, not a forecast.
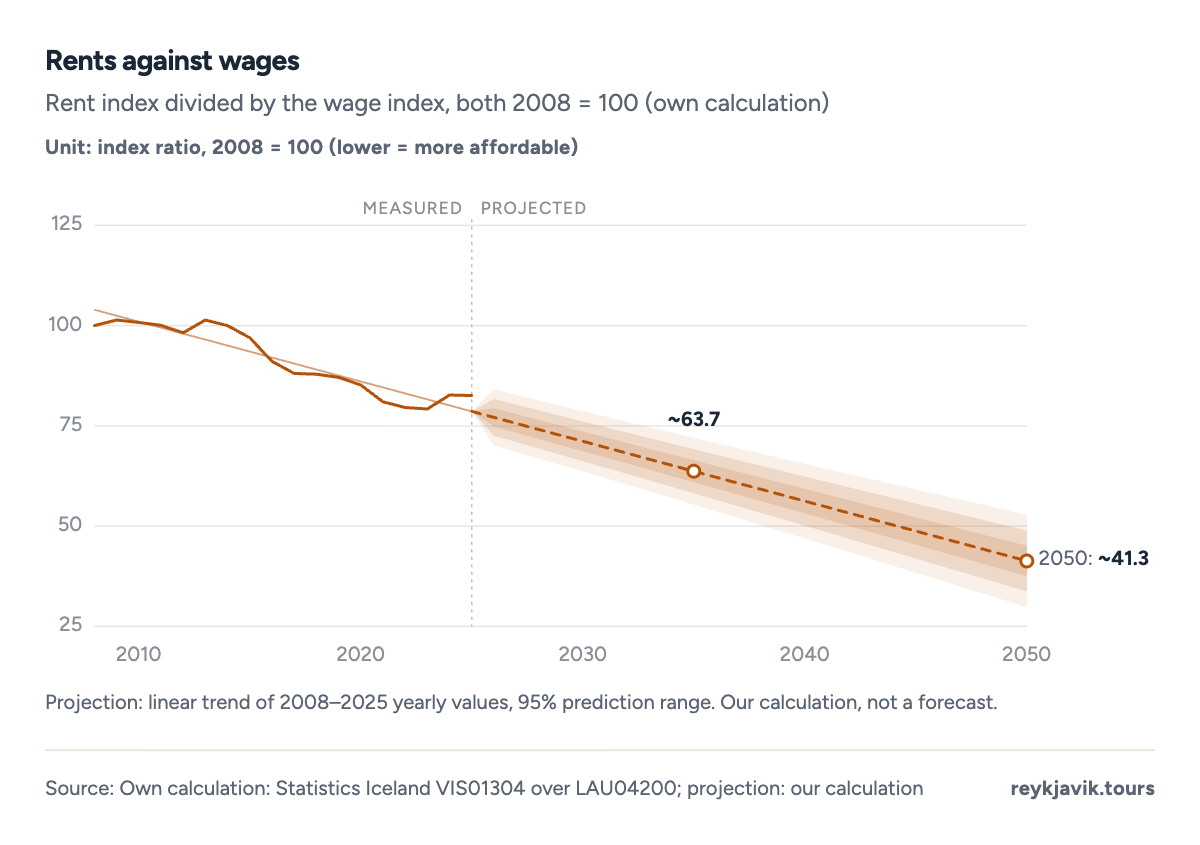
- Rents rose faster than wages for most of 2008-2025.
- The affordability line improves only in years when wage settlements beat rent hikes.
| 2008 | 123.7 | 117.9 | 100.0 |
| 2012 | 152.3 | 142.5 | 125.4 |
| 2016 | 188.6 | 155.5 | 167.3 |
| 2020 | 223.7 | 173.6 | 212.2 |
| 2024 | 297.9 | 225.7 | 291.2 |
- House prices
- Rents
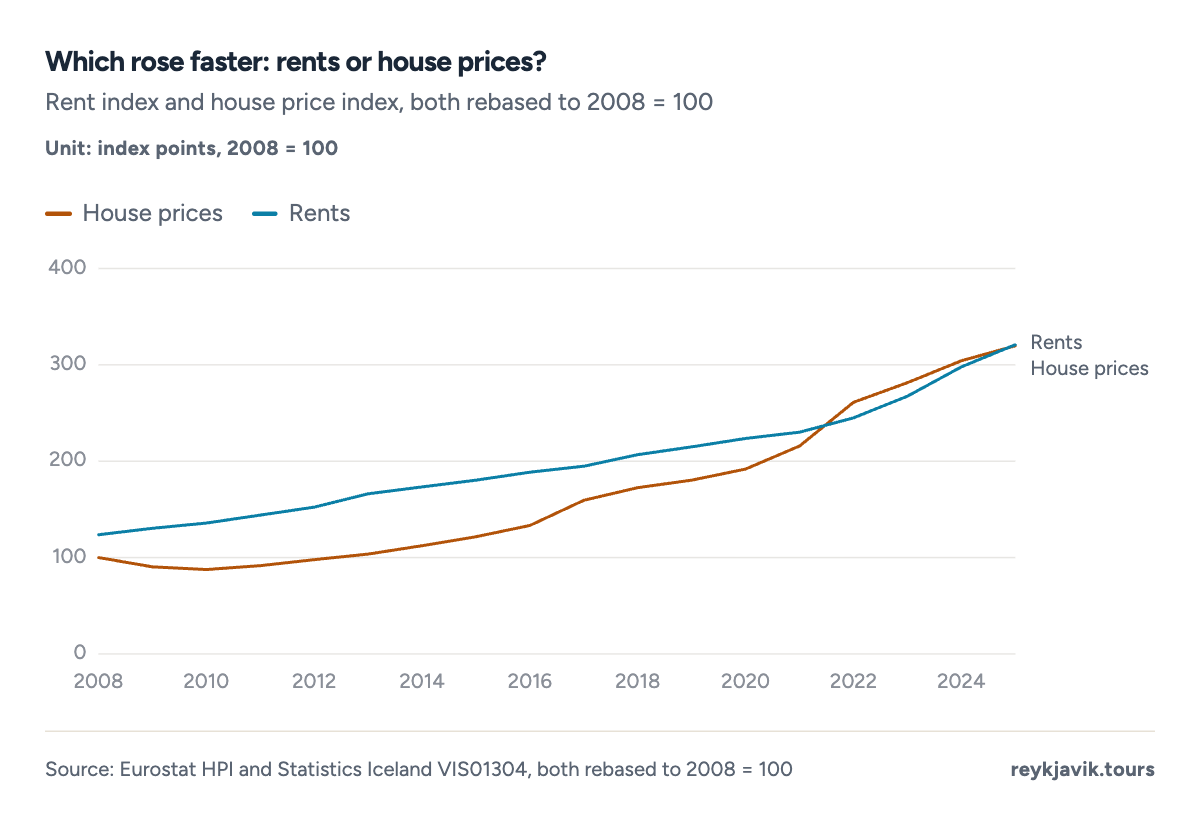
- House prices roughly doubled from 2008 to 2021 before rents caught up.
- Since 2022 the two lines finally move together - the classic catch-up pattern.
- In 2008-2020 renting was the relative bargain; that window has closed.
| Reykjavik | 4,041 |
| Kópavogur | 3,810 |
| National average | 3,639 |
| Bulgaria | 10.5 |
| Iceland | 8.4 |
| Romania | 8.4 |
| Greece | 8.1 |
| EU-27 average | 4.6 |
Rent per square metre: the regions compared
Measured per square metre - the fairest way to compare flats of different sizes - Reykjavik tops Iceland at ISK 4,041 per month1, Kopavogur follows at 3,8101, and the national average is 3,6391 (February 2025, registered contracts)1. The spread between the capital and the national average is only about 11% - far narrower than the gap in purchase prices, which is another way of saying the rental premium for living in the capital is real but moderate once flat size is accounted for.
Rents versus house prices: which rose faster?
House prices won the 2010s. Rebased to a common 2008 starting point, the purchase index roughly doubled by 2021 while the rent index rose about 50% - a decade in which buying was visibly cheaper per year than renting, and Icelanders who stretched into a purchase in 2015 were the winners of the following decade8. The convergence came after 2021: three years of double-digit rent increases brought the lines together, and since 2023 both have moved in lockstep3.
The same comparison across the EU puts Iceland's rents among the fastest-growing on the continent: 8.4%8 rent growth in 2024, behind only Bulgaria's 10.5% and level with Romania, against an EU-27 average of about 4.6%8. Iceland is a small market where rents now behave like prices - fast, thin-margin and unforgiving of timing mistakes.
Reykjavik against the regions
Renting in Reykjavik costs a premium of roughly 20-30% over the regional towns for equivalent space2, and the gap widened during the tourism boom when capital-region flats converted to short-term stays. Akureyri, the second city, offers the best value of the larger markets; the west and south coast towns price closer to the capital as Ring Road tourism grew2.
The compensation for capital prices is supply depth: hundreds of listings turn over monthly in Reykjavik, while regional markets can hold fewer than a dozen active rentals at any moment. The practical consequence: regional renters wait less for cheaper flats, but have far fewer options when they need to move2. The rental geography mirrors the population one - two of every three Icelanders live in the southwest, and the listings follow them. Akureyri in the north is the one regional market with real depth, which is why the university town's rents run closer to the capital's than its distance suggests2.
Inside the capital, the average rent in Reykjavik proper runs above the regional-average figure - the 101 and 105 postcodes (downtown and Vesturbær) command premiums of 10-15% over Breiðholt and Árbær, and how much is rent in Reykjavik depends more on postcode than on building age2. Newer numbers tell the same story: the average rent Reykjavik 2025 listings showed one-bedrooms holding above ISK 250,000 even as the pace of increases slowed, and family apartments in the commuting belt of Kópavogur and Garðabær cleared at ISK 350,000-450,0002. The rents rose fastest exactly where the demand is deepest - and the demand is deepest where the jobs are.
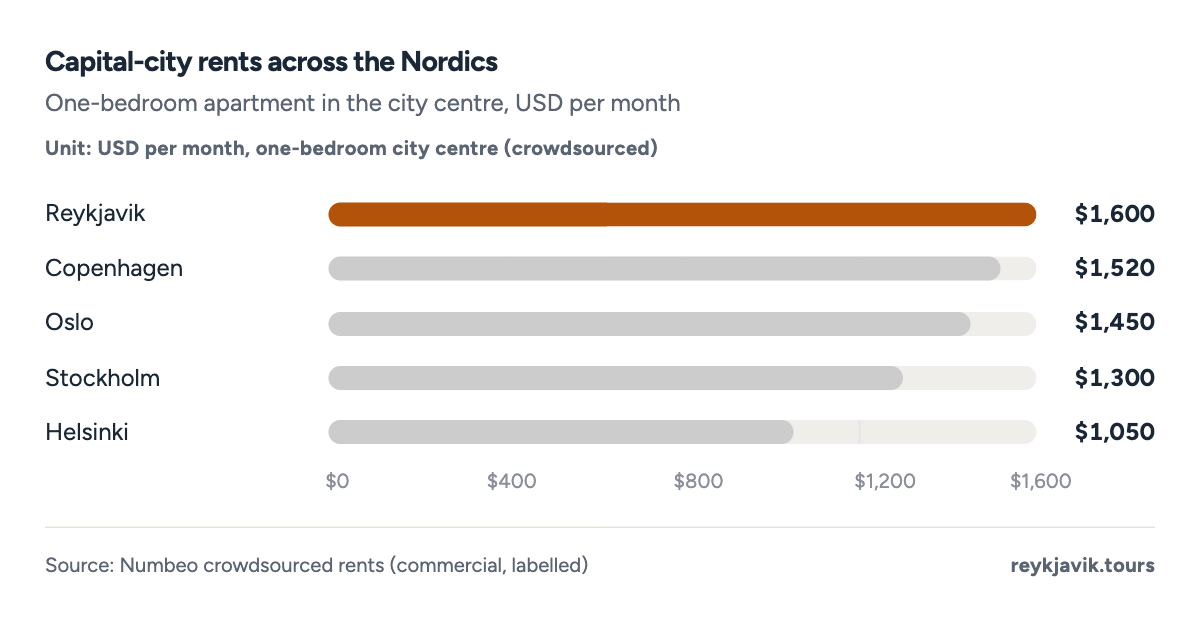
- Reykjavik's one-bedroom city-centre rent tops the Nordic capitals in crowdsourced data.
- Helsinki is the regional bargain at about a third less than Reykjavik.
| Reykjavik | 1,600 |
| Copenhagen | 1,520 |
| Oslo | 1,450 |
| Stockholm | 1,300 |
| Helsinki | 1,050 |
Why Reykjavik rents are so high: three causes, one correction
The first cause is the tourism conversion. From 2015 to 2019, thousands of capital-region apartments moved from long-term tenants to short-term guests at the exact moment Iceland's job market was pulling in workers at record speed - a demand surge and a supply cut arriving together. Registration rules introduced since 2017 pushed many flats back to the long-term market, but the rents never returned to their pre-boom path2.
The second is construction arithmetic. New builds in Reykjavik rent at rates that justify construction costs of ISK 900,000-plus per square metre - and everything in that number, from timber to the crane operator's overtime, arrives through an import chain. The third is the wage settlements themselves: every general wage agreement has lifted the rents of the following year, because landlords know precisely what tenants can now afford7.
The correction arrived the same way. When Iceland's tourist numbers dipped and the new-builds of 2019-2023 finally completed, the rental market softened for the first time in a decade - asking rents stagnated through 2024-2025 even as the index of sitting contracts kept climbing. The two rent markets of Iceland - sitting tenants on indexed contracts and new arrivals quoting market rates - now move at visibly different speeds, which is exactly what the index-versus-listings comparison shows3.
Rent or buy: the Icelandic arithmetic
With average rents near ISK 269,000 and a typical capital apartment costing ISK 80M, the buy-side arithmetic needs the mortgage section of our house-prices page: at an 8% policy rate with inflation-indexed principal, the monthly payment on a fully mortgaged ISK 80M would be brutal - which is why Icelandic buyers bring 20-30% equity or a Housing Fund loan with subsidised rates6. For the tenants who can assemble that equity, buying usually wins from year six onward; for everyone else, the rent is the price of flexibility in a market where the deposit alone equals three months of the average salary2.
The krona adds one more layer. Foreign-earning remote workers who pay rent in ISK while earning in dollars or euros have watched their effective rents fall with the currency since 2022 - the opposite of locals, whose ISK wages fought ISK rents in a race the wages only began winning in 20247. Renting in Iceland, in short, is a different financial experience depending on which currency your income arrives in - and that is not a detail, it is the defining feature of the market's last three years6.
The rent index itself: how Iceland measures renting
Iceland is unusual in publishing a dedicated rent index inside its CPI at all. The index is built from registered rents across the country, weighted by dwelling type and size, and it moves monthly. Because it feeds the CPI directly - housing is the single heaviest weight in the Icelandic basket - every rent settlement in the country mechanically nudges the national inflation figure the central bank targets3.
That feedback loop is why rent politics in Iceland are so heated: a landlord raising a sitting tenant's rent is not just moving one household's budget, it is nudging the national inflation number that anchors every other wage and price negotiation in the country. Add the student angle - Iceland's university population doubles Reykjavik's young-adult headcount each autumn - and the rental market's tightness becomes a question of who gets the flats at all: students queue for student housing years ahead, and the private market prices the rest by ability to pay rather than need3. The index's slow, relentless climb since 2008 - visible in the chart above - is the statistical shadow of that feedback loop3.
Conclusions
- Expect ISK 250,000-350,000 ($1,950-2,730) a month for a capital-region one-bedroom, and ISK 269,000 as the national registered-market average - a figure that has risen every single year since the index began1.
- Rents have risen about 75% since 2008 without a single down year - the steepest stretch came in 2017-20193.
- The affordability ratio has worsened for most of the period: rents have outrun wages, and the median renter spends 35-40% of net pay on housing6.
- Reykjavik carries a 20-30% premium over regional towns - but offers market depth no region matches2.
- Indexation is the trap and the shield of Icelandic renting: real rents never fall, but neither do they jump with the market - the CPI clause cuts both ways3.
Methodology
- Rent index: 2008-2025, subindex 041 Actual rentals for housing (Statistics Iceland)
- Market rent levels: HMS-registered contracts Feb 2026 and quoted capital-region ranges
- Wage comparison: wage index 2008-2025 (Statistics Iceland)
Definition. The rent index (subindex 041) tracks contracted rents for dwellings, indexed to 2008 = 100. Registered market rent is the rent of newly registered contracts as compiled by HMS and reported via Global Property Guide. Affordability ratio = rent index divided by the wage index, both rebased to a common year.
Data sources. Statistics Iceland VIS01304 (CPI subindices 2008-2025, incl. 041 Actual rentals) and LAU04200 (wage index); HMS-registered market rents reported by Global Property Guide; Expat Focus and Guide to Iceland rent ranges (commercial, labelled); Numbeo for Nordic capital comparison (crowdsourced, labelled); Central Bank of Iceland for the 2025 USD/ISK average of 128.37.
Calculations. Annual index values are monthly averages. USD conversions divide ISK by 128.37. The affordability ratio divides the rent index by the wage index, both rebased to 2008 = 100. The projection is an ordinary least-squares trend with a 95% prediction interval, computed by the renderer.
Limitations. The rent index covers contracted rents including indexed legacy contracts, so it moves slower than newly quoted market rents. Registered-contract averages weight by actual transactions. Numbeo and Expat Focus figures are crowdsourced or editorial and move with the market. Regional averages are not published officially; regional statements rest on listing-site observations.
Sources
- Global Property Guide (HMS data). “Average market rent in newly registered contracts, Feb 2026.” commercial, labelled, 2026. globalpropertyguide.com. Accessed 2026-09-17. Back to text
- Expat Focus / Guide to Iceland. “Typical capital-area rents by apartment size, early 2026.” commercial, labelled, 2026. expatfocus.com. Accessed 2026-09-17. Back to text
- Statistics Iceland. “CPI subindex 041 Actual rentals for housing, 2008-2025 (VIS01304).” Statistics Iceland, 2025. hagstofa.is. Accessed 2026-09-17. Back to text
- Numbeo. “Reykjavik rents per centre/suburbs and Nordic capital comparison.” Numbeo (crowdsourced, labelled), 2026. numbeo.com. Accessed 2026-09-17. Back to text
- Central Bank of Iceland. “Average USD/ISK 2025 (128.37).” Central Bank of Iceland, 2026. cb.is. Accessed 2026-09-17. Back to text
- Reykjavik Tours. “Own affordability ratio and midpoints (labelled).” own calculation, 2026. reykjavik.tours. Accessed 2026-09-17. Back to text
- Statistics Iceland. “Wage index, annual averages 1989-2025 (LAU04200).” Statistics Iceland, 2026. hagstofa.is. Accessed 2026-09-17. Back to text
- Eurostat. “Rent price growth 2024, Iceland and EU (prc_hpi_a / press compilation).” European Commission, 2025. ec.europa.eu. Accessed 2026-09-17. Back to text
About the author
Laufey turns public statistics on tourism and travel into research people can check and cite.
Every figure on this page links to its source. How we research
Related research
More data on Iceland's weather and travel from Reykjavik Tours.
- HousingHow Much Is a House in Iceland? (2026 Data)$467k-779k typical capital-region apartmentRead the research →
- EconomyAverage Salary in Iceland (2026 Data)$8,242 average monthly salary, full-timeRead the research →
- EconomyAverage Cost of Living in Iceland (2026 Data)$3,679/month average cost of living in Iceland (single person)Read the research →
- TransportHow Many Airports in Iceland? (2026 Data)33 airports in IcelandRead the research →
- Travel costsHow Much Are Hotels in Iceland? (2026 Data)$196 a night for a typical hotel roomRead the research →
- Travel planningHow Many Miles Is the Ring Road in Iceland? (2026 Data)822 mi the Ring Road around IcelandRead the research →