Average Salary in Iceland (2026 Data)
What full-time employees earn on average and at the median, pay for 26 jobs, the gender pay gap, take-home pay after tax, agreed minimum wages and how Iceland compares.
- Published
- Updated
- 16 sources
- 188 statistics
- 11 min read

- M.Sc. in Atmospheric Sciences, University of Iceland (Háskóli Íslands), with a minor thesis on North Atlantic storm-track variability
- Former research assistant at the Icelandic Meteorological Office (Veðurstofa Íslands), working on subarctic climate modeling and volcanic-ash dispersion forecasting
- B.A. in Sociology, also from the University of Iceland, with fieldwork on rural depopulation and tourism's impact on small fishing communities (Westfjords focus)
- Grew up in Akureyri, spent seven years living in Reykjavík and two in a small village in the Westfjords - brings first-hand experience of Iceland's regional weather extremes and community life
- Fluent in Icelandic and English; has translated Icelandic Met Office public advisories for international outlets
- Published field notes and data-driven pieces on glacier retreat (Vatnajökull), aurora forecasting, and the socioeconomic effects of overtourism in the Golden Circle

- M.A. in Journalism, University of Iceland, with additional coursework in Environmental Communication at the University of Bergen (Norway), giving a comparative Nordic lens
- 12+ years in Icelandic media, including editorial roles at RÚV (Iceland's national broadcaster) covering weather-related public safety reporting (storms, volcanic eruptions, road closures)
- Former fact-checking lead for a travel-and-culture desk, specializing in verifying tourism statistics, safety advisories, and climate data against primary sources (Vedur.is, Statistics Iceland)
- Has overseen editorial standards for bilingual (Icelandic/English) publications, ensuring both cultural nuance and accuracy for international readers
- Advocate for citing primary sources (Icelandic Met Office, Icelandic Tourist Board / Ferðamálastofa) rather than secondhand reporting
Key findings
- $8,242The average salary in Iceland is $8,242 a month (ISK 1,058,000) for full-time employees in 2025.
- $7,385The median full-time salary is $7,385 a month, and 64% of employees earn less than the average.
- 70.6%A median earner keeps about 70.6% of gross pay after income tax and pension contributions in 2026.
- $16,896Medical doctors earn $16,896 a month on average, about 3.4 times a child-care worker.
- 10.4%Women earned 10.4% less per hour than men in 2024, the unadjusted gender pay gap.
- $100,605Iceland has the highest average annual wage in the OECD, $100,605 in purchasing power terms.
- $3,970Retail workers' agreed starting wage is $3,970 a month in 2026; Iceland has no statutory minimum wage.
- 7.9%Wages in Iceland rose 7.9% in 2025, measured by the Statistics Iceland wage index.
Measured in purchasing power, Iceland pays the highest average wage in the OECD: $100,6051 a year in 2025, ahead of Luxembourg and Switzerland. In krónur, full-time employees earned an average of ISK 1,058,0002 a month in 2025, which is $8,2423 at the Central Bank's average exchange rate for the year.4 That average hides a wide spread: 64% of employees earn less, a doctor earns about 3.4 times3 as much as a child-care worker, and income tax and pension contributions take about 29.4%3 of a median pay slip.
This report brings together Statistics Iceland's earnings survey and tax-register income data, the 2026 tax rates, collective agreements and OECD and World Bank comparisons. It shows the average and median salary, pay in 26 common jobs, the gender pay gap, what is left after tax, the lowest agreed wages and how Iceland compares with other rich countries.
What the average salary in Iceland includes
Statistics Iceland's earnings survey covers a little under 100,000 employees and publishes several averages, so it matters which one is quoted.2 In 2025, full-time employees earned an average of $8,2423 a month (ISK 1,058,000) in total earnings, and a median of $7,3853 (ISK 948,000). Total earnings include overtime and every other payment.
Regular earnings, which leave out overtime, averaged ISK 913,0002 ($7,112), and basic earnings had a median of ISK 757,0002. Statistics Iceland's headline figure, ISK 816,0002 of regular earnings, is lower again because it includes part-time employees counted as if they worked full time.
Men averaged ISK 1,139,0002 ($8,873) in total earnings and women ISK 974,0002 ($7,587). Full-time employees were paid for 173.4 hours2 a month on average, down from 184 hours2 in 2014.
- Average
- Median
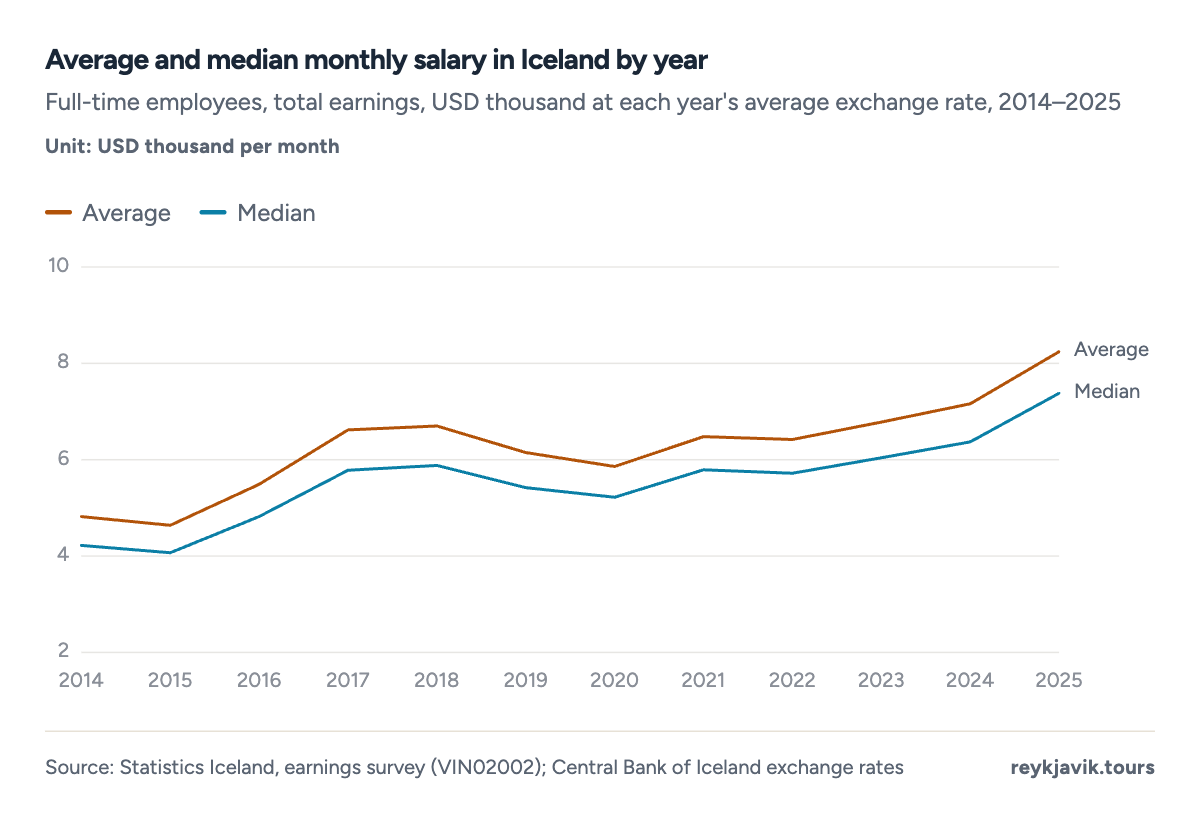
- The average reached $8,242 a month in 2025.
- In 2014 it was $4,822.
In krónur, the average rose 87.9%3 between 2014 and 2025, from ISK 563,000 to ISK 1,058,000. In dollars the rise was smaller, 70.9%3, and less steady: the dollar value fell from $6,6993 in 2018 to $5,8623 in 2020 while krónur pay kept rising, because the króna weakened.4
| Total earnings, average | 1,058 | $8,242 |
| Total earnings, median | 948 | $7,385 |
| Total earnings, lower quartile | 772 | $6,014 |
| Total earnings, upper quartile | 1,193 | $9,293 |
| Regular earnings, average | 913 | $7,112 |
| Regular earnings, median | 826 | $6,435 |
| Basic earnings, median | 757 | $5,897 |
| Men, total earnings, average | 1,139 | $8,873 |
| Men, total earnings, median | 1,007 | $7,845 |
| Women, total earnings, average | 974 | $7,587 |
| Women, total earnings, median | 902 | $7,027 |
| 2025 | 1,058 | 948 | $8,242 | $7,385 |
| 2024 | 987 | 878 | $7,156 | $6,366 |
| 2023 | 935 | 834 | $6,776 | $6,044 |
| 2022 | 870 | 775 | $6,423 | $5,721 |
| 2021 | 823 | 736 | $6,478 | $5,793 |
| 2020 | 793 | 706 | $5,862 | $5,219 |
| 2019 | 754 | 665 | $6,148 | $5,422 |
| 2018 | 726 | 637 | $6,699 | $5,877 |
| 2017 | 707 | 617 | $6,621 | $5,778 |
| 2016 | 663 | 582 | $5,494 | $4,823 |
| 2015 | 612 | 536 | $4,642 | $4,065 |
| 2014 | 563 | 493 | $4,822 | $4,223 |
Average annual salary in Iceland
Twelve months at the 2025 average come to $98,9023 (ISK 12.7 million), and twelve months at the median to $88,6193. The OECD's Taxing Wages report puts the average wage in Iceland at ISK 12.4 million5 a year in 2025. Collective agreements add fixed bonuses on top of monthly pay: in 2026, retail and office staff under the LÍV–SA agreement receive a holiday bonus of ISK 62,0006 and a December bonus of ISK 114,0006.
Average hourly wage in Iceland
Dividing average total earnings by average paid hours gives ISK 6,1013 an hour in 2025, or $47.533. Because doctors are paid for more hours, the gap between jobs is a little narrower per hour: pay works out at ISK 11,4523 for doctors and ISK 3,9353 for child-care workers. The agreed daytime rate for a new adult retail worker is ISK 2,8686 an hour in 2026.
How pay is spread
Averages are pulled up by high earners. In 2025, 64%2 of full-time employees earned less than the average of total earnings. The lowest-paid tenth earned under ISK 640,0002 ($4,986) a month and the best-paid tenth over ISK 1,551,0002 ($12,082). The middle half of employees earned between ISK 772,0002 and ISK 1,193,0002.
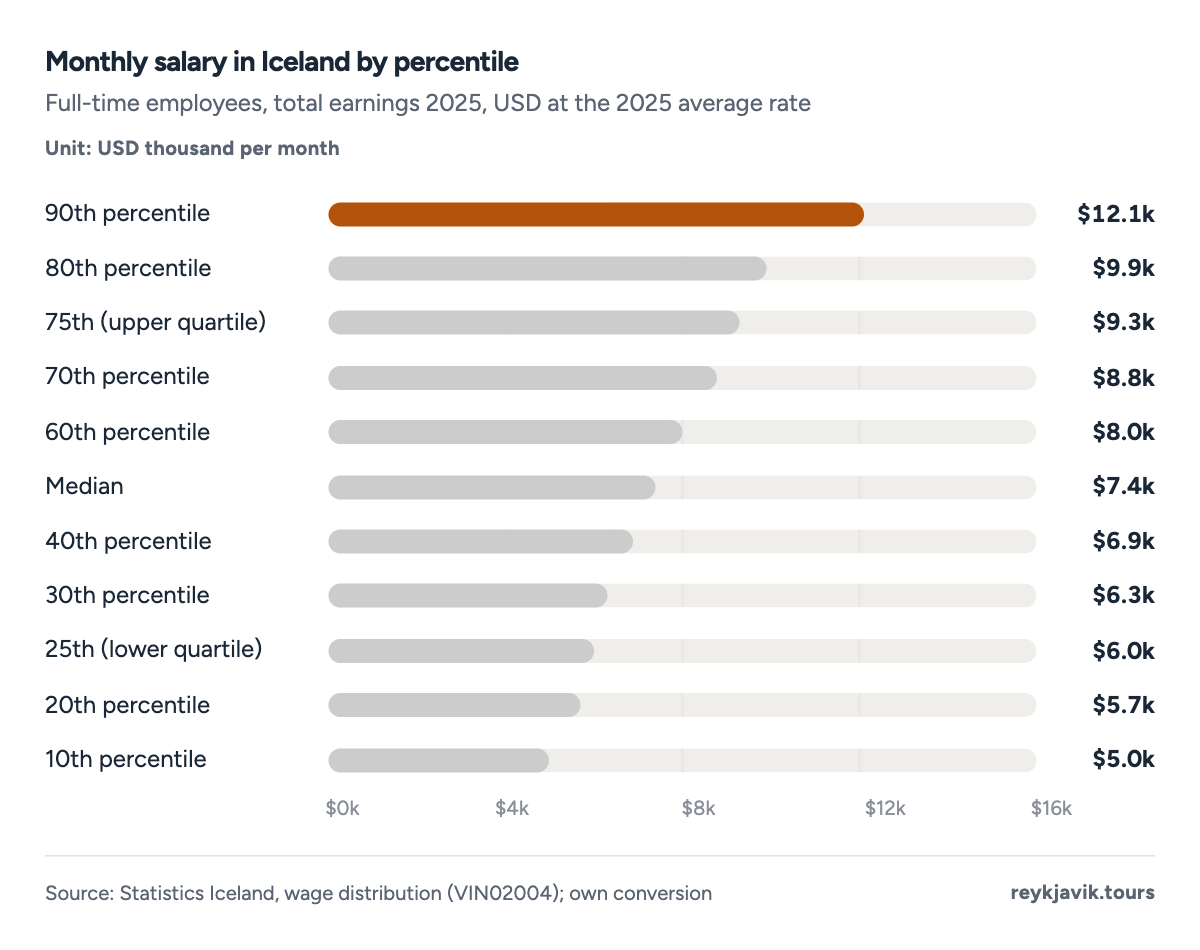
- The best-paid tenth earn more than $12,082 a month.
- The lowest-paid tenth earn under $4,986.
| 90th percentile | 1,551 | $12,082 |
| 80th percentile | 1,273 | $9,917 |
| 75th (upper quartile) | 1,193 | $9,293 |
| 70th percentile | 1,125 | $8,764 |
| 60th percentile | 1,027 | $8,000 |
| Median | 948 | $7,385 |
| 40th percentile | 881 | $6,863 |
| 30th percentile | 810 | $6,310 |
| 25th (lower quartile) | 772 | $6,014 |
| 20th percentile | 731 | $5,694 |
| 10th percentile | 640 | $4,986 |
| Average | 1,058 | $8,242 |
Iceland median income
Tax returns give a wider view than the earnings survey, because they include everyone with income, such as part-time workers, pensioners and students, not only full-time employees. The median total income in 2025 was ISK 8,754,0007 a year ($68,194), against a mean of ISK 10,542,0007 ($82,122). Among people aged 25–64 with income from work, the median income from work was ISK 9,803,0007, the lowest tenth received under ISK 3,662,0007 and the top 1% over ISK 34,049,0007.
| 99th percentile | 34,049 | $265,241 |
| 95th percentile | 21,180 | $164,992 |
| 90th percentile | 17,350 | $135,156 |
| 80th percentile | 14,045 | $109,410 |
| 70th percentile | 12,219 | $95,186 |
| 60th percentile | 10,934 | $85,176 |
| Median | 9,803 | $76,365 |
| 40th percentile | 8,677 | $67,594 |
| 30th percentile | 7,490 | $58,347 |
| 20th percentile | 6,000 | $46,740 |
| 10th percentile | 3,662 | $28,527 |
| Average | 10,563 | $82,286 |
How much do jobs pay in Iceland?
Managers top the occupational groups with ISK 1,634,0002 ($12,729) a month on average, followed by technicians and associate professionals at ISK 1,154,0002 and professionals at ISK 1,131,0002. Elementary occupations average ISK 766,0002. Craft and trades workers earn ISK 1,088,0002, close to professionals, and are paid for more hours: 182.4 hours2 a month against 169.8 for managers.
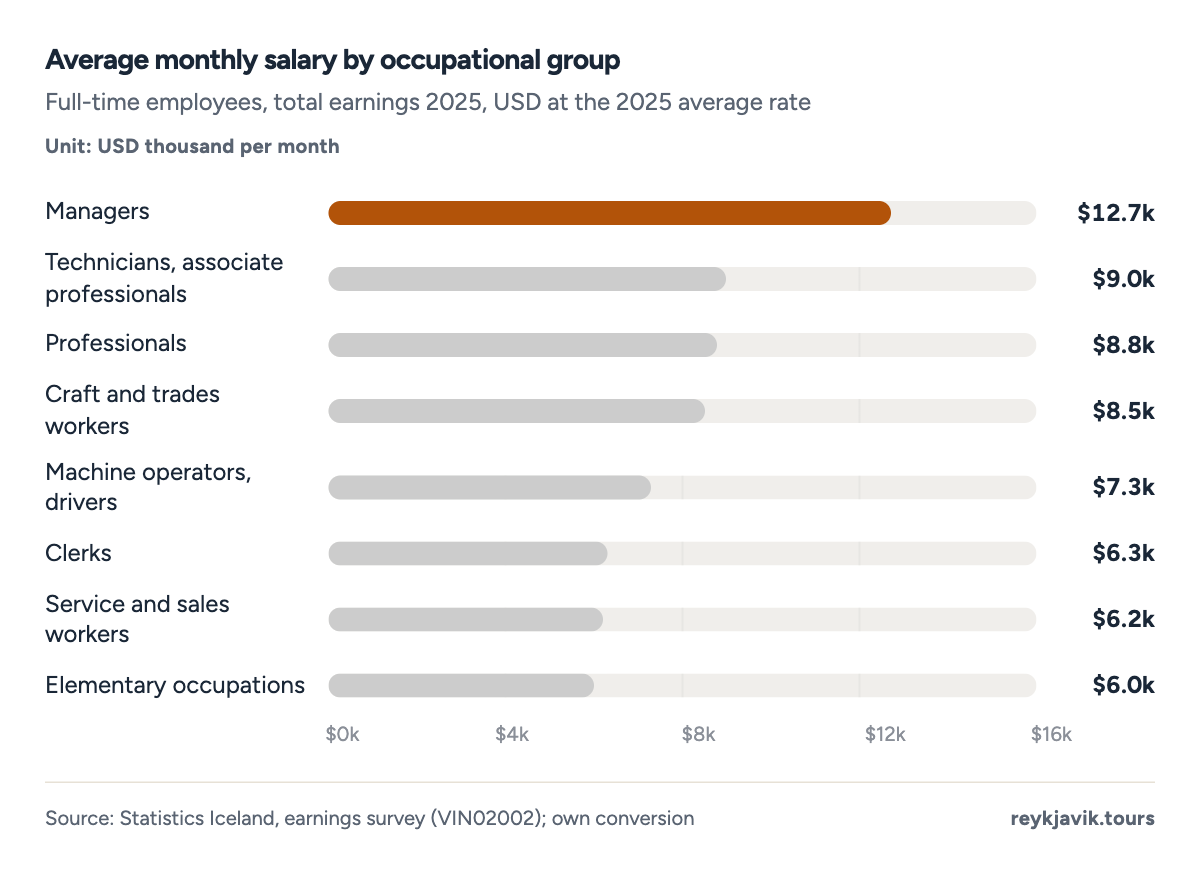
- Managers average $12,729 a month.
- Elementary occupations average $5,967.
Among the 26 common jobs in this report, directors and chief executives earn the most, ISK 2,535,0002 ($19,748) a month, and child-care workers the least, ISK 641,0002 ($4,993). Child-care workers also saw the fastest pay growth of the jobs listed: their average earnings rose 102%3 between 2015 and 2025, against 65%3 for chief executives. How much do lawyers make in Iceland? Legal professionals average ISK 1,358,0002 ($10,579) a month, and accountants ISK 1,180,0002.
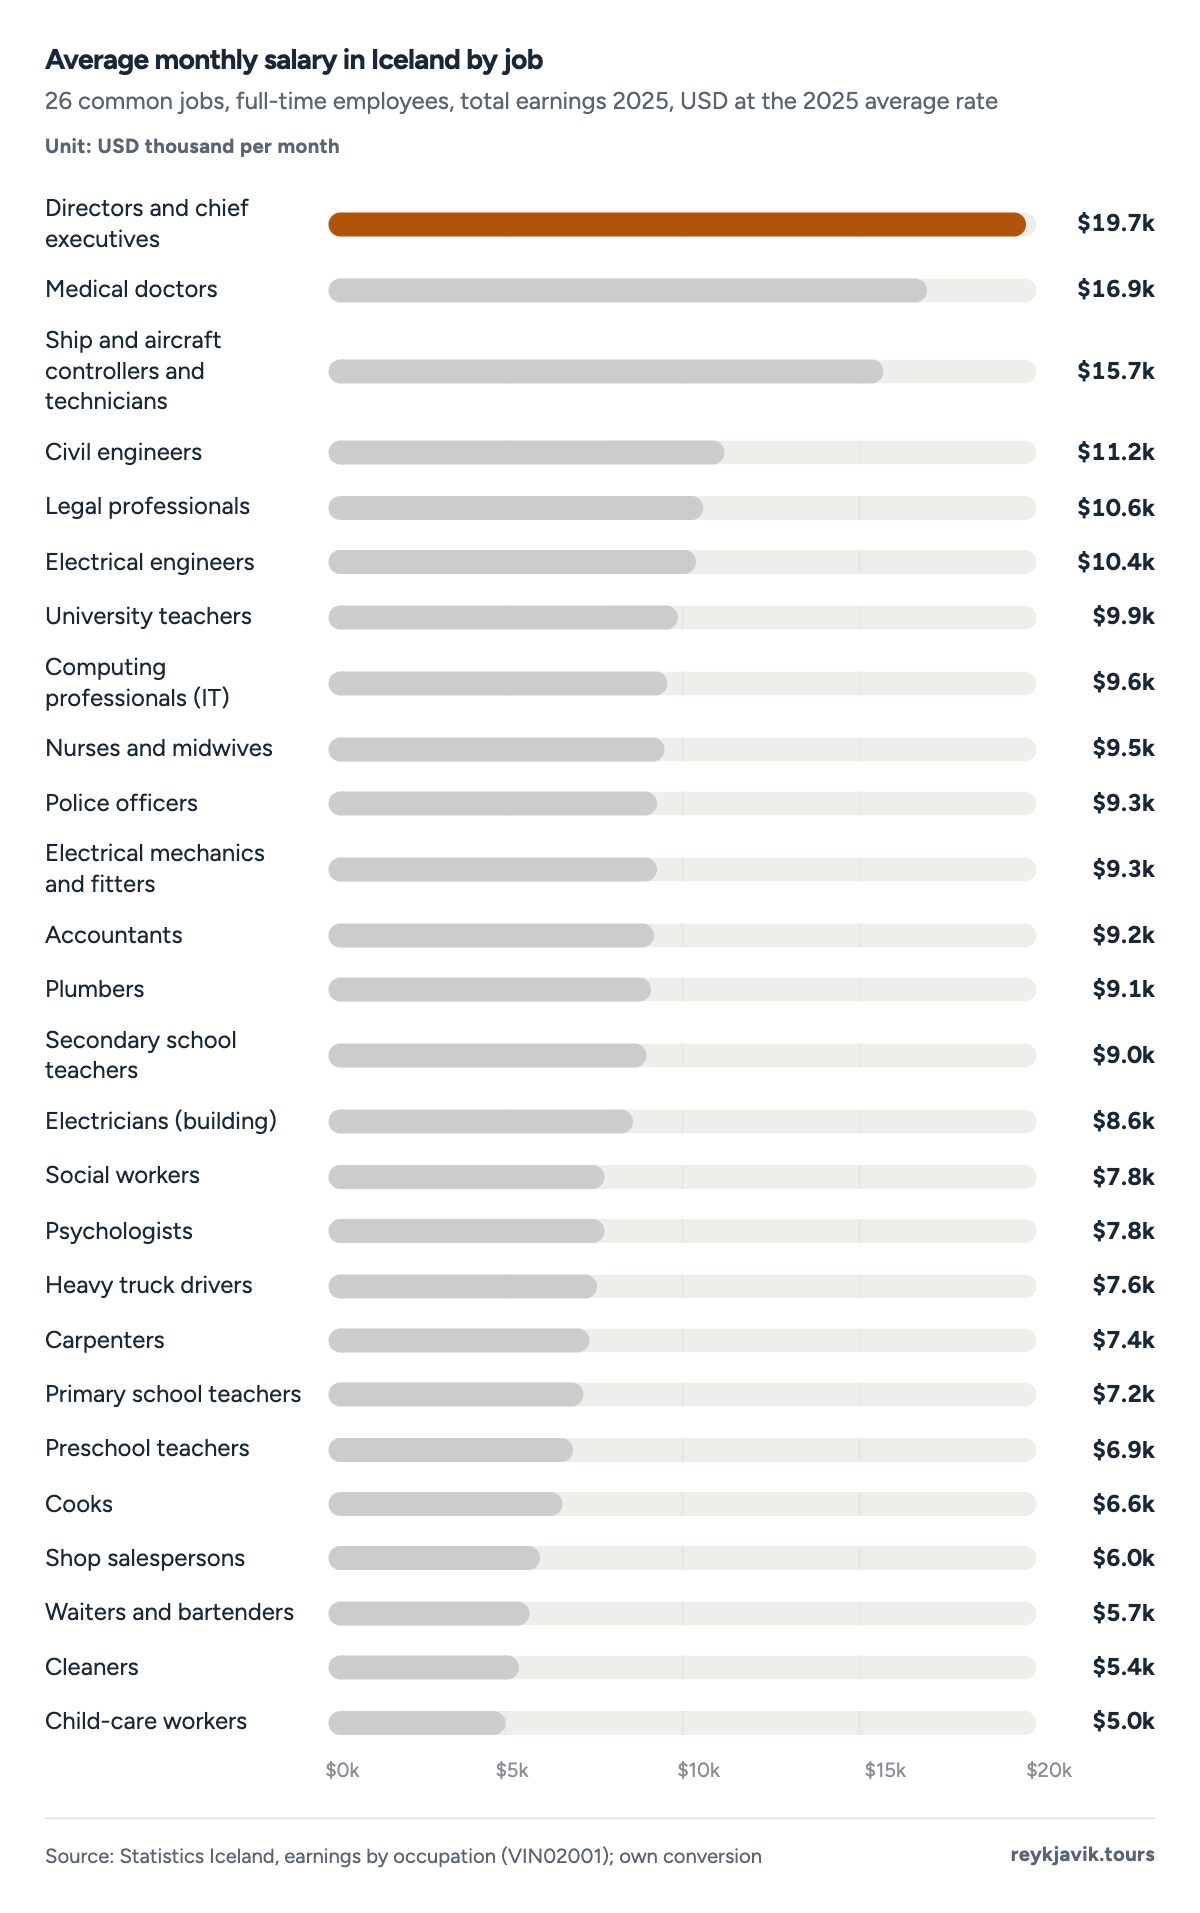
- Doctors average $16,896 a month.
- Child-care workers average $4,993.
| 1 | Directors and chief executives | 2,535 | 2,173 | $19,748 | 15,134 |
| 2 | Medical doctors | 2,169 | 1,993 | $16,896 | 11,452 |
| 3 | Ship and aircraft controllers and technicians | 2,020 | 2,144 | $15,736 | 11,792 |
| 4 | Civil engineers | 1,440 | 1,335 | $11,218 | 8,649 |
| 5 | Legal professionals | 1,358 | 1,213 | $10,579 | 8,083 |
| 6 | Electrical engineers | 1,341 | 1,329 | $10,446 | 8,020 |
| 7 | University teachers | 1,276 | 1,252 | $9,940 | 7,350 |
| 8 | Computing professionals (IT) | 1,232 | 1,193 | $9,597 | 7,558 |
| 9 | Nurses and midwives | 1,217 | 1,179 | $9,480 | 7,340 |
| 10 | Police officers | 1,193 | 1,147 | $9,293 | 6,657 |
| 11 | Electrical mechanics and fitters | 1,188 | 1,148 | $9,254 | 6,495 |
| 12 | Accountants | 1,180 | 1,040 | $9,192 | 6,909 |
| 13 | Plumbers | 1,162 | 1,143 | $9,052 | 6,670 |
| 14 | Secondary school teachers | 1,154 | 1,128 | $8,990 | 5,784 |
| 15 | Electricians (building) | 1,098 | 1,047 | $8,553 | 6,307 |
| 16 | Social workers | 997 | 988 | $7,767 | 6,079 |
| 17 | Psychologists | 997 | 995 | $7,767 | 6,105 |
| 18 | Heavy truck drivers | 971 | 956 | $7,564 | 4,700 |
| 19 | Carpenters | 956 | 922 | $7,447 | 5,356 |
| 20 | Primary school teachers | 919 | 914 | $7,159 | 5,125 |
| 21 | Preschool teachers | 890 | 902 | $6,933 | 5,365 |
| 22 | Cooks | 847 | 821 | $6,598 | 4,667 |
| 23 | Shop salespersons | 771 | 731 | $6,006 | 4,264 |
| 24 | Waiters and bartenders | 726 | 691 | $5,656 | 4,158 |
| 25 | Cleaners | 696 | 655 | $5,422 | 3,973 |
| 26 | Child-care workers | 641 | 625 | $4,993 | 3,935 |
By industry, electricity and heat supply pays the most, ISK 1,402,0002 ($10,922) a month, followed by finance and insurance at ISK 1,372,0002. Accommodation and food services pays the least at ISK 859,0002, even though its employees are paid for 186.3 hours2 a month. Education is second lowest at ISK 907,0002.
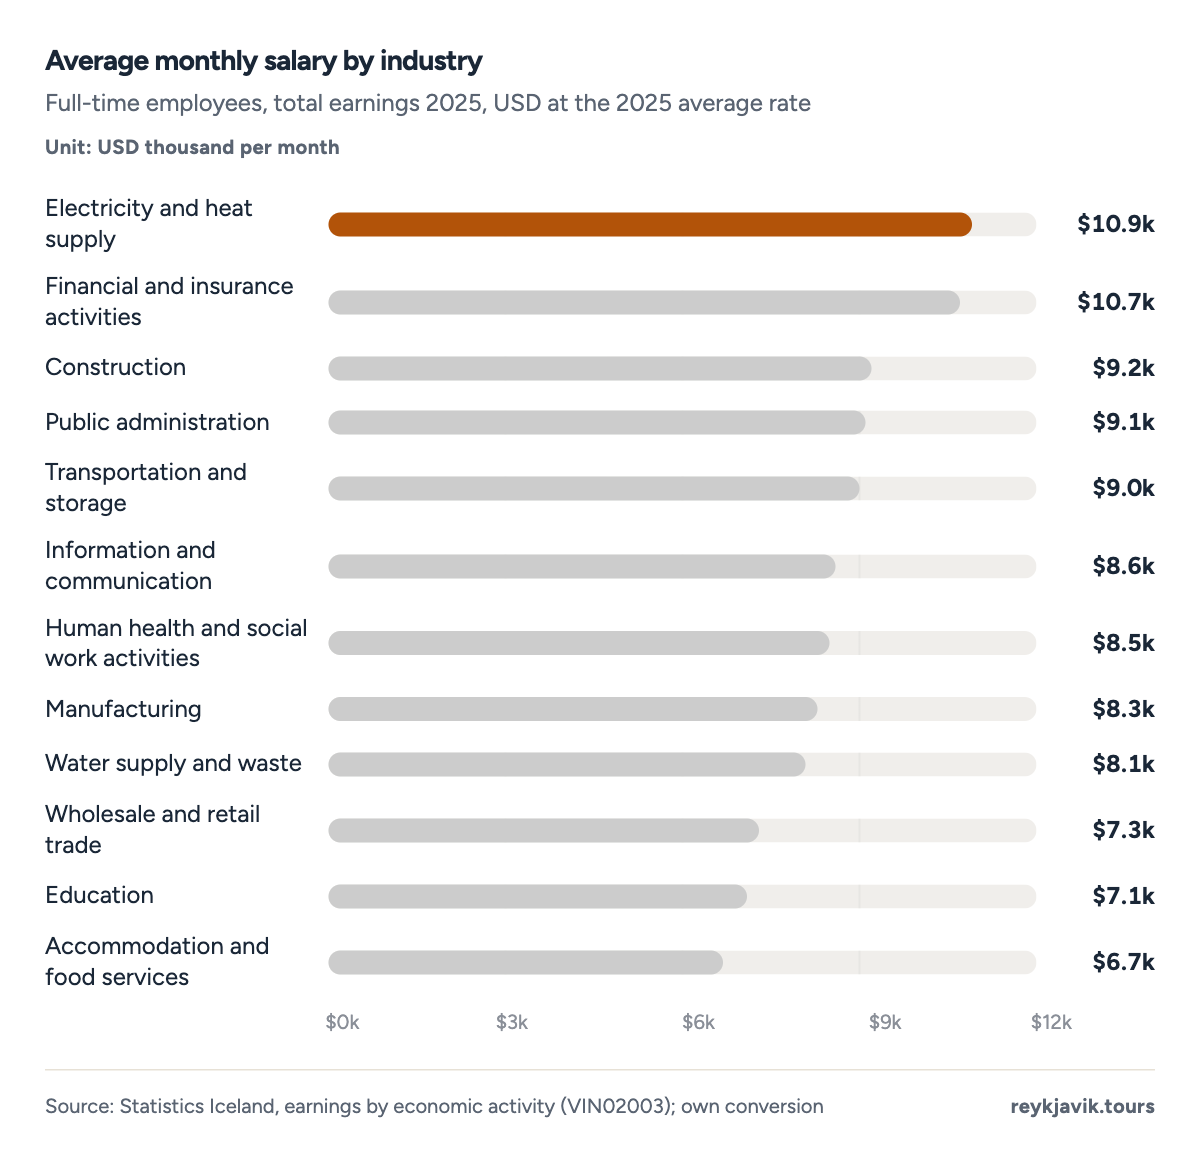
- Electricity and heat supply averages $10,922 a month.
- Accommodation and food services averages $6,692.
| 1 | Electricity and heat supply | 1,402 | 1,353 | $10,922 | 176.5 |
| 2 | Financial and insurance activities | 1,372 | 1,176 | $10,688 | 159.3 |
| 3 | Construction | 1,186 | 1,150 | $9,239 | 175.6 |
| 4 | Public administration | 1,162 | 1,073 | $9,052 | 172.0 |
| 5 | Transportation and storage | 1,150 | 939 | $8,958 | 176.0 |
| 6 | Information and communication | 1,098 | 961 | $8,553 | 167.4 |
| 7 | Human health and social work activities | 1,085 | 961 | $8,452 | 169.1 |
| 8 | Manufacturing | 1,063 | 966 | $8,281 | 175.2 |
| 9 | Water supply and waste | 1,037 | 977 | $8,078 | 195.4 |
| 10 | Wholesale and retail trade | 935 | 836 | $7,284 | 175.1 |
| 11 | Education | 907 | 889 | $7,066 | 173.5 |
| 12 | Accommodation and food services | 859 | 797 | $6,692 | 186.3 |
Central government employees earn the most on average, ISK 1,142,0002, ahead of the private sector at ISK 1,089,0002. Municipal employees average ISK 909,0002. The public sector matters more for women: about 40%2 of employed women work in it, against 17%2 of men.
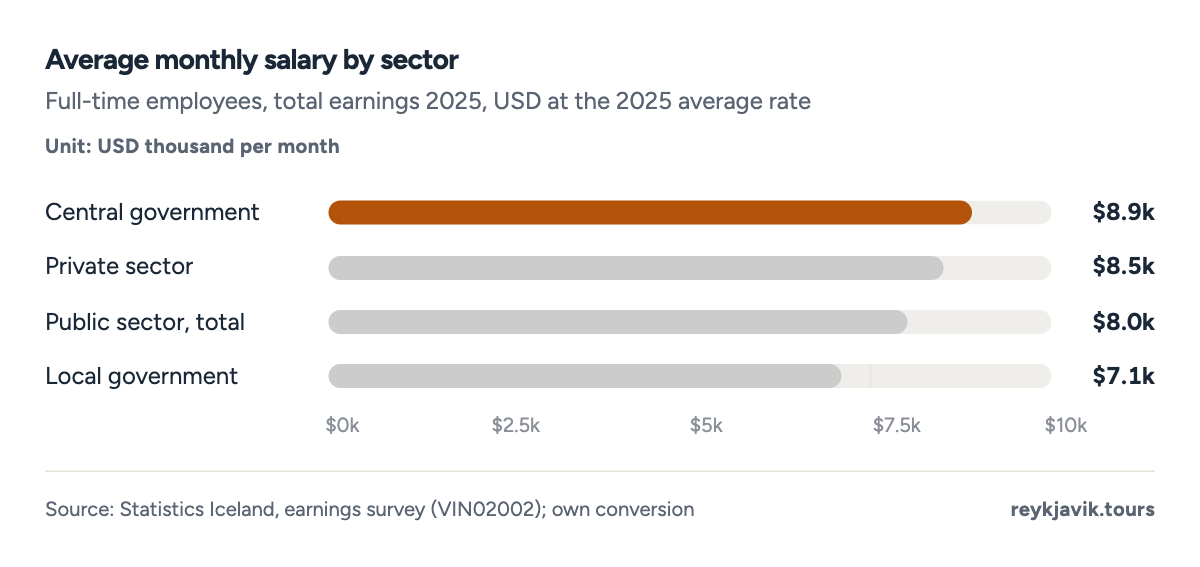
- Central government pays $8,896 a month on average.
- Local government pays $7,081.
How much do doctors make in Iceland?
Medical doctors earn ISK 2,169,0002 a month on average, or $16,8963, with a median of ISK 1,993,0002. That pay comes with long hours: doctors are paid for 189.4 hours2 a month, against 173.4 for all full-time employees. The median for male doctors was ISK 2,320,0002 and for female doctors ISK 1,747,0002.
How much do nurses make in Iceland?
Nurses and midwives earn ISK 1,217,0002 ($9,480) a month on average, with a median of ISK 1,179,0002. Their pay has risen faster than in most of the jobs listed: the average was ISK 659,0002 in 2015, an increase of 85%3 in ten years.
How much do teachers make in Iceland?
It depends on the school. University teachers average ISK 1,276,0002 a month, upper secondary teachers ISK 1,154,0002 ($8,990), primary school teachers ISK 919,0002 ($7,159) and preschool teachers ISK 890,0002. Secondary teachers are paid for 199.5 hours2 a month, the most of any teaching group, and preschool teachers' pay has doubled since 2015, up 100%3.
How much do electricians make in Iceland?
Building electricians earn ISK 1,098,0002 ($8,553) a month on average, and electrical and electronic mechanics and fitters ISK 1,188,0002. Electrical engineers average ISK 1,341,0002 ($10,446).
Iceland gender pay gap percentage
Statistics Iceland measures the unadjusted gender pay gap as the difference between men's and women's average hourly earnings, without adjusting for job, hours or experience.8 The gap was 10.4%8 in 2024, up from 8.6%8 in 2022 but about half the 20.5%8 of 2008. In this measure, men earned ISK 4,9908 an hour and women ISK 4,4808.
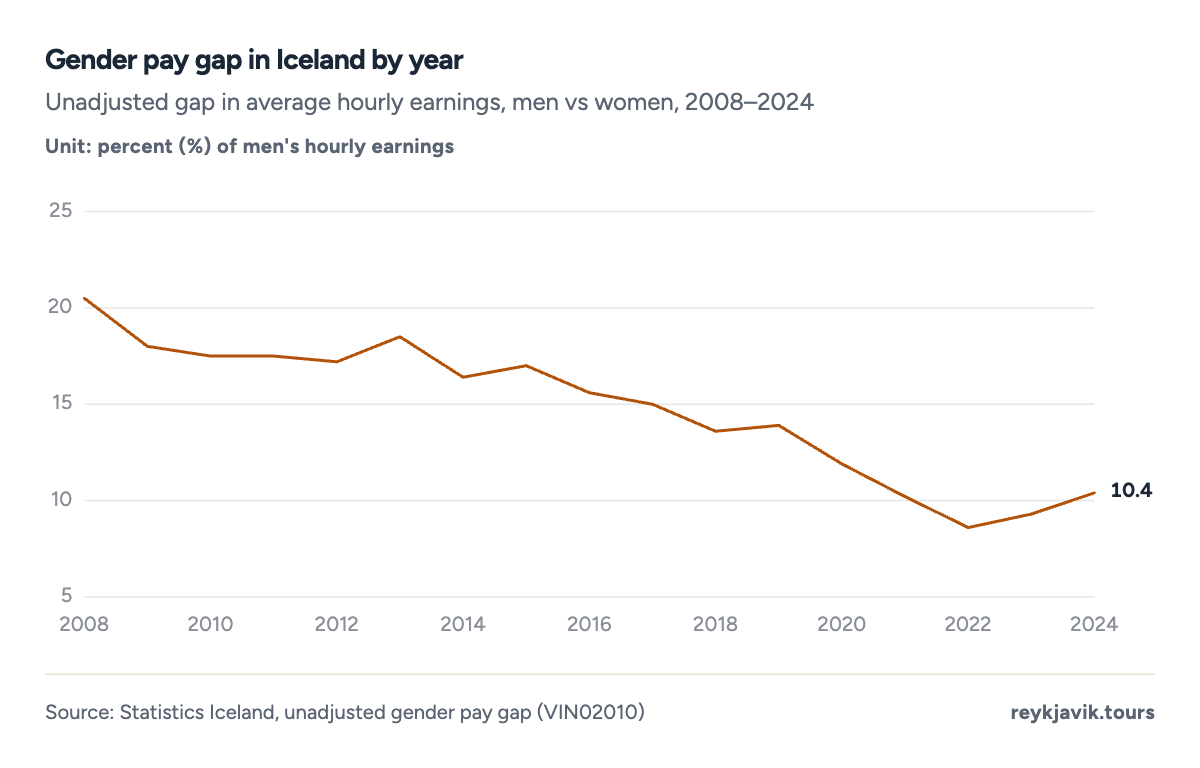
- The gap was 10.4% in 2024.
- It was lowest in 2022 at 8.6%.
The gap is widest in finance and insurance, 26.1%8, and among technicians and associate professionals, 24.8%8. It is small in health and social work, 3.0%8, and reversed among clerks, where women earn 5.2%8 more per hour than men. It also widens with age up to 64: 0.7%8 for employees aged 24 and younger, 16.7%8 for those aged 55 to 64. The private sector gap, 15.2%8, is about twice the public sector's.
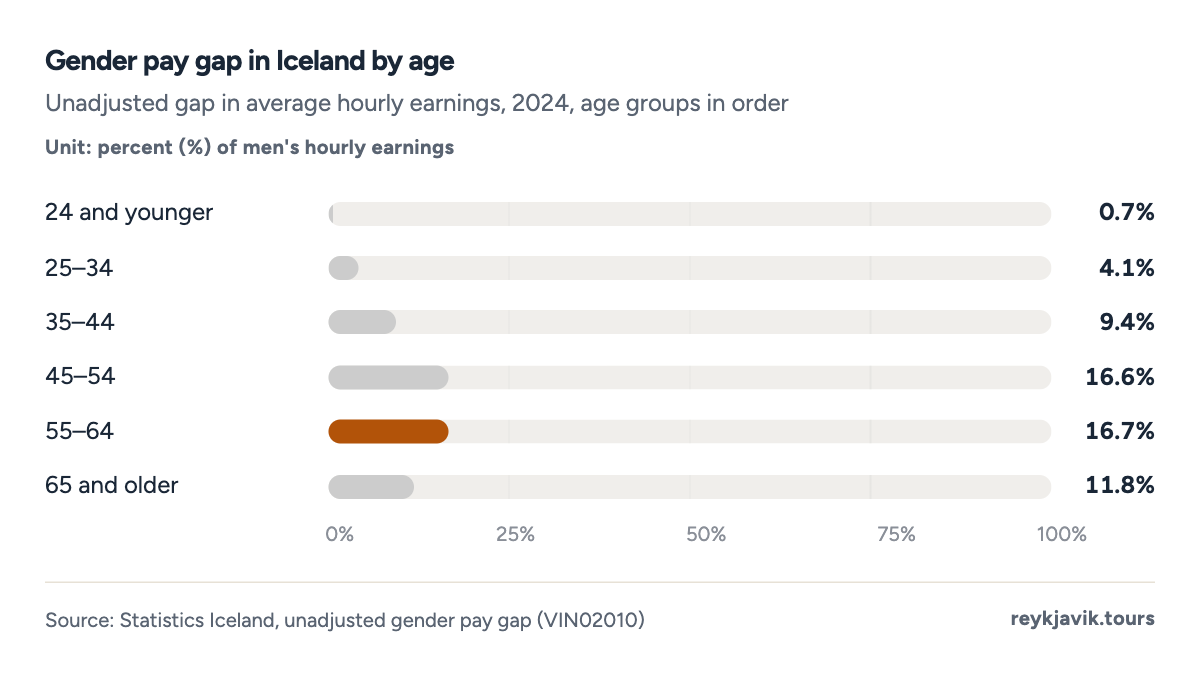
- The gap is 0.7% for employees aged 24 and younger.
- It reaches 16.7% at ages 55–64.
| 1 | Financial and insurance activities (K) | +26.1% |
| 2 | Technicians and associate professionals (3) | +24.8% |
| 3 | Transportation and storage (H) | +23.7% |
| 4 | Craft and related workers (7) | +20.8% |
| 5 | 55 to 64 years old | +16.7% |
| 6 | 45 to 54 years old | +16.6% |
| 7 | Managers (1) | +15.6% |
| 8 | Private sector | +15.2% |
| 9 | Professionals (2) | +14.5% |
| 10 | Manufacturing (C) | +12.9% |
| 11 | 65 years old and older | +11.8% |
| 12 | General, machine and specialized workers | +11.5% |
| 13 | Total - excluding public administration (O) | +11.1% |
| 14 | Total | +10.4% |
| 15 | Full-time | +10.3% |
| 16 | 35 to 44 years old | +9.4% |
| 17 | Wholesale and retail trade; repair of motor vehicles (G) | +8.4% |
| 18 | Public sector, central government | +7.7% |
| 19 | Public sector, total | +7.3% |
| 20 | Information and communication (J) | +7.3% |
| 21 | Service workers and shop and market sales workers (5) | +7.2% |
| 22 | Elementary occupations (9) | +5.9% |
| 23 | Public administration and defence; compulsory social sec. (O) | +4.1% |
| 24 | 25 to 34 years old | +4.1% |
| 25 | Public sector, local government | +4.0% |
| 26 | Education (P) | +3.7% |
| 27 | Human health and social work activities (Q) | +3.0% |
| 28 | Accomodation and food service activities (I) | +2.3% |
| 29 | Part-time | +1.7% |
| 30 | Electricity, gas, steam, and air conditioning supply (D) | +1.6% |
| 31 | 24 years old and younger | +0.7% |
| 32 | Water supply; waste management (E) | −4.0% |
| 33 | Clerks (4) | −5.2% |
| 2024 | 10.4% | 4,990 | 4,480 |
| 2023 | 9.3% | 4,720 | 4,290 |
| 2022 | 8.6% | 4,250 | 3,890 |
| 2021 | 10.2% | 4,120 | 3,700 |
| 2020 | 11.9% | 3,930 | 3,460 |
| 2019 | 13.9% | 3,610 | 3,110 |
| 2018 | 13.6% | 3,500 | 3,020 |
| 2017 | 15.0% | 3,480 | 2,960 |
| 2016 | 15.6% | 3,290 | 2,780 |
| 2015 | 17.0% | 3,010 | 2,500 |
| 2014 | 16.4% | 2,790 | 2,330 |
| 2013 | 18.5% | 2,720 | 2,220 |
| 2012 | 17.2% | 2,530 | 2,090 |
| 2011 | 17.5% | 2,430 | 2,000 |
| 2010 | 17.5% | 2,270 | 1,870 |
| 2009 | 18.0% | 2,160 | 1,770 |
| 2008 | 20.5% | 2,110 | 1,680 |
Pay in a job is only part of the story. Tax registers show what people actually receive over a whole year.
Average income in Iceland
Statistics Iceland's income statistics come from tax returns and count all income, including pensions, benefits and capital income. In 2025 the mean total income per person was ISK 10,542,0007 ($82,122), about ISK 878,5003 a month. It rose 5.7%7 from 2024, or 1.6%7 after inflation. Income from work averaged ISK 7,150,0007 a year. After taxes and pension contributions, mean disposable income was ISK 7,821,0007, and the median ISK 6,698,0007.
Men's mean total income was ISK 11,549,0007 and women's ISK 9,522,0007. Income from work climbs until the early fifties: among people with such income, it peaks at ISK 12,184,0007 a year at ages 50–54, where men average ISK 13,718,0007 and women ISK 10,555,0007.
Projection: linear trend of 2009–2025 yearly values, 95% prediction range. Our calculation, not a forecast.
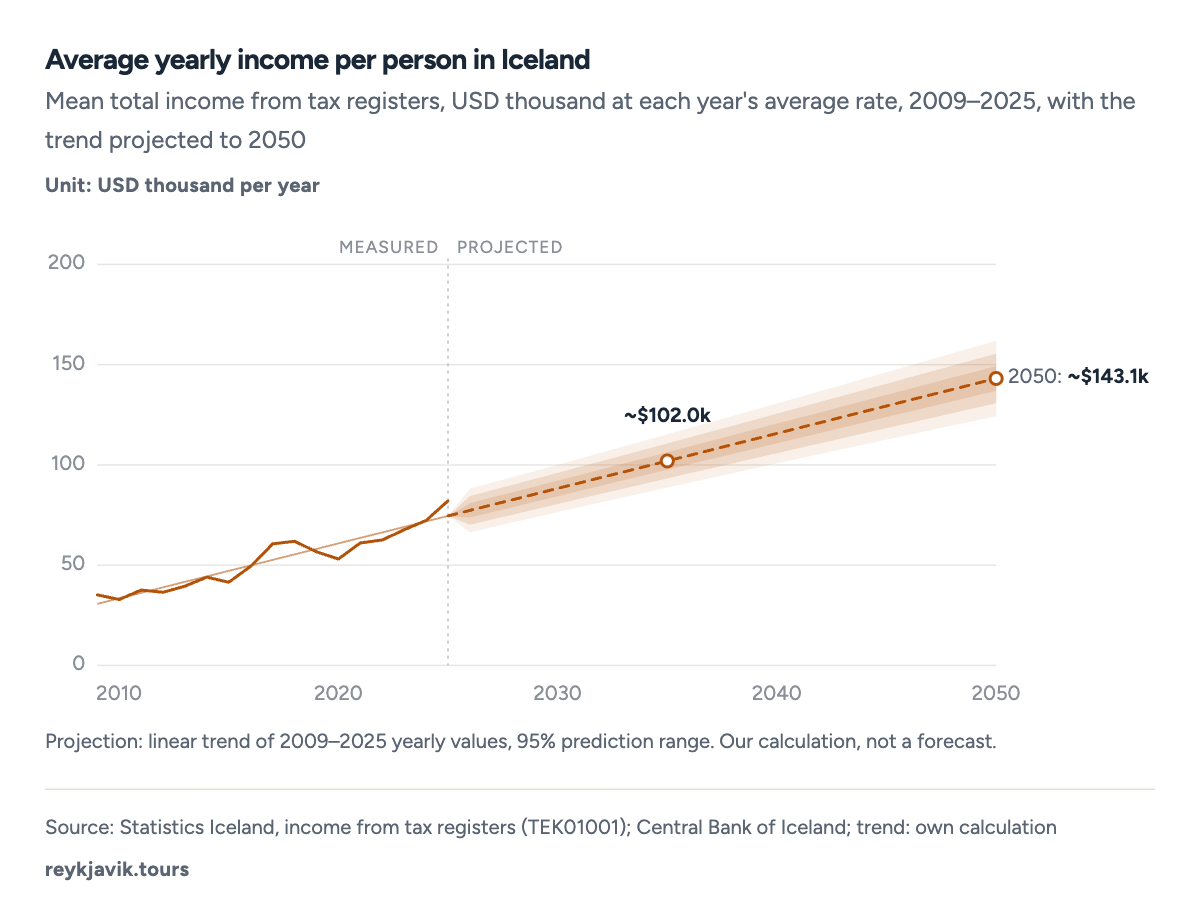
- Mean income reached $82.1k in 2025.
- It was $32.9k in 2010.
- Men
- Women
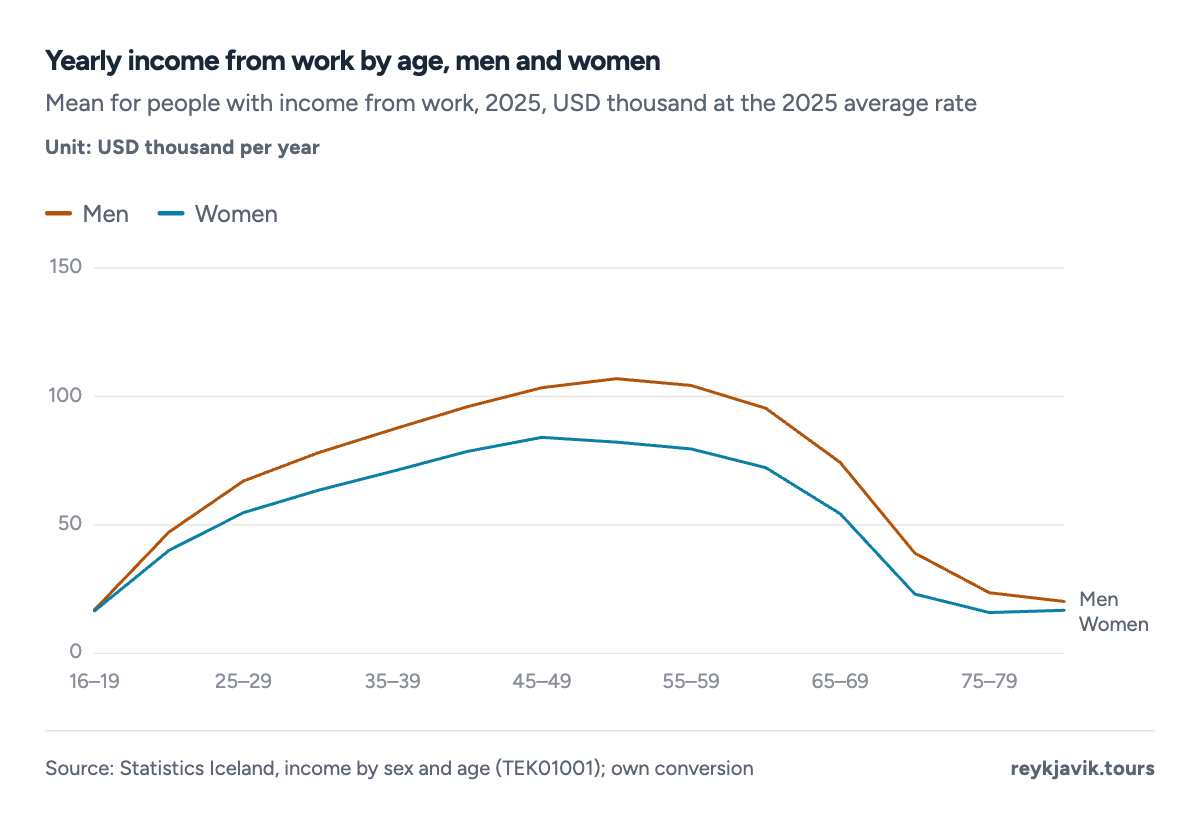
- Men's income from work peaks at $106.9k at ages 50–54.
- Women's peaks at $84.1k at ages 45–49.
Income rises with education. For people aged 25–64 with income from work, the median was ISK 8,478,0007 a year with basic education, ISK 9,722,0007 with a vocational qualification, ISK 12,240,0007 with a master's degree and ISK 14,116,0007 with a doctorate. Vocational graduates out-earn those with a general upper secondary education, whose median was ISK 8,297,0007.
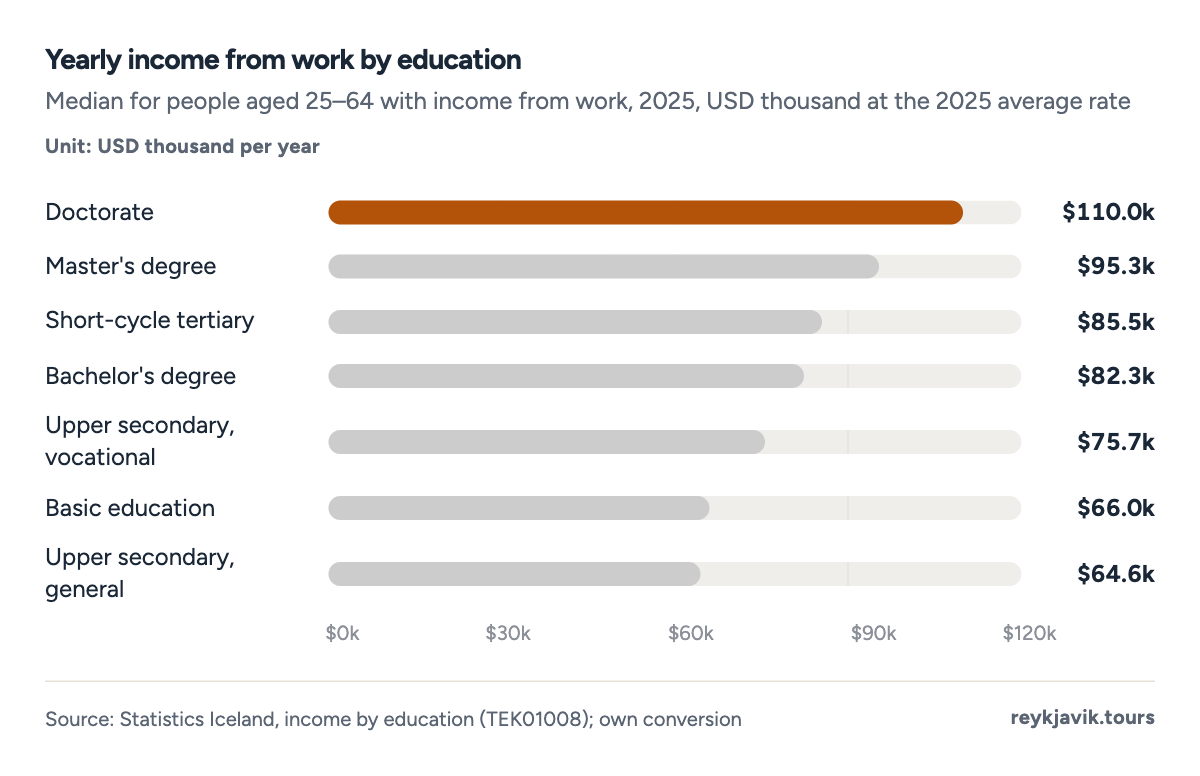
- A doctorate brings a median of $110.0k a year.
- Basic education brings $66.0k.
| 1 | Doctorate | 14,116 | $109,963 | 9,616 | +46.8% |
| 2 | Master's degree | 12,240 | $95,349 | 7,486 | +63.5% |
| 3 | University, all | 11,181 | $87,100 | 6,273 | +78.2% |
| 4 | Short-cycle tertiary | 10,970 | $85,456 | 6,035 | +81.8% |
| 5 | Bachelor's degree | 10,563 | $82,286 | 5,832 | +81.1% |
| 6 | Upper secondary, vocational | 9,722 | $75,734 | 5,260 | +84.8% |
| 7 | Upper secondary, all | 9,024 | $70,297 | 4,881 | +84.9% |
| 8 | Basic education | 8,478 | $66,043 | 4,379 | +93.6% |
| 9 | Upper secondary, general | 8,297 | $64,633 | 4,202 | +97.5% |
| 2025 | 10,542 | 8,754 | 7,821 | $82,122 |
| 2024 | 9,973 | 8,288 | 7,413 | $72,305 |
| 2023 | 9,347 | 7,722 | 6,905 | $67,742 |
| 2022 | 8,475 | 6,940 | 6,230 | $62,565 |
| 2021 | 7,763 | 6,258 | 5,755 | $61,102 |
| 2020 | 7,180 | 5,924 | 5,249 | $53,079 |
| 2019 | 6,950 | 5,746 | 5,069 | $56,665 |
| 2018 | 6,710 | 5,526 | 4,884 | $61,912 |
| 2017 | 6,475 | 5,208 | 4,765 | $60,639 |
| 2016 | 5,974 | 4,794 | 4,394 | $49,507 |
| 2015 | 5,466 | 4,353 | 4,025 | $41,456 |
| 2014 | 5,141 | 4,057 | 3,773 | $44,034 |
| 2013 | 4,832 | 3,806 | 3,542 | $39,532 |
| 2012 | 4,569 | 3,597 | 3,354 | $36,537 |
| 2011 | 4,360 | 3,425 | 3,223 | $37,564 |
| 2010 | 4,018 | 3,176 | 3,007 | $32,924 |
| 2009 | 4,346 | 3,365 | 3,345 | $35,165 |
Reykjavik average salary and income by municipality
There is no official salary figure by town, so tax-register income is the closest measure. Reykjavík residents had a mean total income of ISK 10,434,0007 ($81,281) in 2025, slightly below the national mean. The highest incomes are in two of the capital's neighbouring municipalities, Seltjarnarnes at ISK 13,893,0007 and Garðabær at ISK 13,229,0007. Akureyri, the largest town in the north, averaged ISK 10,140,0007, and the lowest mean among all 62 municipalities was ISK 6,871,0007 in Eyja- og Miklaholtshreppur.
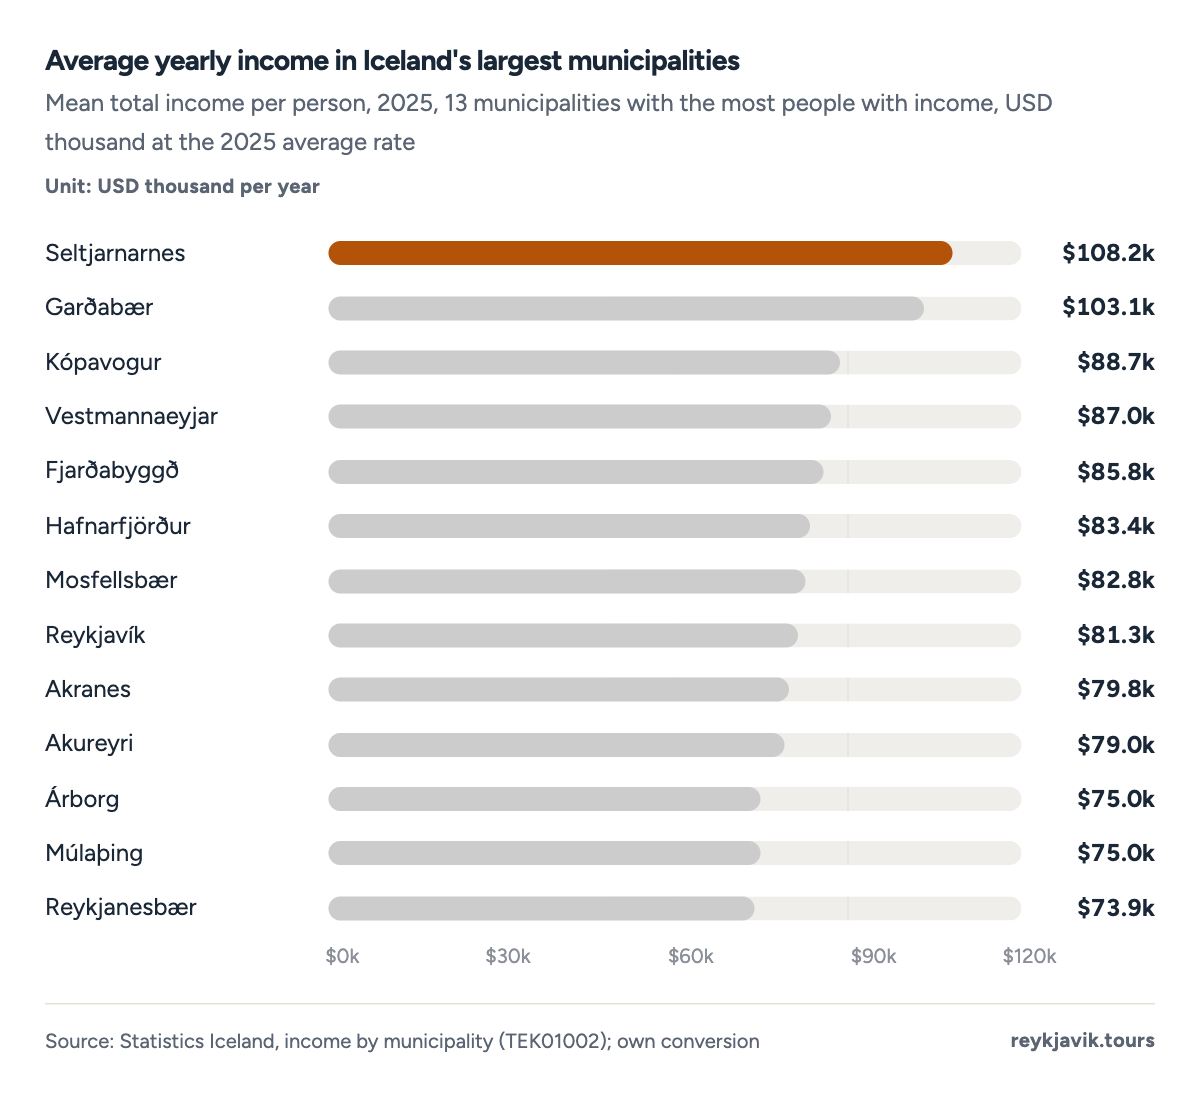
- Seltjarnarnes has the highest mean at $108.2k.
- Reykjavík's mean is $81.3k.
| 1 | Seltjarnarnes | 13,893 | $108,226 | 3,220 | +107.4% |
| 2 | Garðabær | 13,229 | $103,054 | 14,638 | +91.5% |
| 3 | Grindavíkurbær | 12,054 | $93,900 | 703 | +108.7% |
| 4 | Snæfellsbær | 11,747 | $91,509 | 1,197 | +97.7% |
| 5 | Kjósarhreppur | 11,536 | $89,865 | 259 | +101.2% |
| 6 | Kópavogur | 11,386 | $88,697 | 28,903 | +95.8% |
| 7 | Grundarfjarðarbær | 11,265 | $87,754 | 593 | +83.7% |
| 8 | Grýtubakkahreppur | 11,243 | $87,583 | 273 | +87.5% |
| 9 | Dalvíkurbyggð | 11,222 | $87,419 | 1,418 | +132.3% |
| 10 | Vestmannaeyjar | 11,167 | $86,991 | 3,305 | +85.8% |
| 11 | Fjarðabyggð | 11,013 | $85,791 | 3,738 | +82.1% |
| 12 | Skorradalshreppur | 10,945 | $85,261 | 49 | +118.2% |
| 13 | Sveitarfélagið Hornafjörður | 10,829 | $84,358 | 1,816 | +87.8% |
| 14 | Fjallabyggð | 10,780 | $83,976 | 1,485 | +99.4% |
| 15 | Eyjafjarðarsveit | 10,771 | $83,906 | 844 | +126.0% |
| 16 | Hafnarfjörður | 10,708 | $83,415 | 23,053 | +93.6% |
| 17 | Mosfellsbær | 10,626 | $82,776 | 9,767 | +85.0% |
| 18 | Skeiða- og Gnúpverjahreppur | 10,552 | $82,200 | 470 | +141.8% |
| 19 | Árneshreppur | 10,497 | $81,771 | 47 | +104.3% |
| 20 | Reykjavík | 10,434 | $81,281 | 98,497 | +89.3% |
| 21 | Mýrdalshreppur | 10,262 | $79,941 | 584 | +126.0% |
| 22 | Akranes | 10,249 | $79,840 | 6,063 | +92.3% |
| 23 | Hörgársveit | 10,189 | $79,372 | 655 | +136.8% |
| 24 | Hvalfjarðarsveit | 10,141 | $78,998 | 607 | +94.5% |
| 25 | Akureyri | 10,140 | $78,990 | 14,940 | +99.7% |
| 26 | Ísafjarðarbær | 10,124 | $78,866 | 2,800 | +90.8% |
| 27 | Sveitarfélagið Skagaströnd | 10,120 | $78,835 | 332 | +70.1% |
| 28 | Vopnafjarðarhreppur | 10,075 | $78,484 | 471 | +104.9% |
| 29 | Svalbarðsstrandarhreppur | 10,049 | $78,282 | 379 | +95.8% |
| 30 | Kaldrananeshreppur | 9,859 | $76,801 | 82 | +116.5% |
| 31 | Vesturbyggð | 9,855 | $76,770 | 937 | +100.7% |
| 32 | Skagafjörður | 9,789 | $76,256 | 3,150 | +106.2% |
| 33 | Bolungarvík | 9,722 | $75,734 | 745 | +78.0% |
| 34 | Rangárþing ytra | 9,722 | $75,734 | 1,388 | +104.7% |
| 35 | Flóahreppur | 9,667 | $75,306 | 524 | +112.2% |
| 36 | Múlaþing | 9,633 | $75,041 | 3,654 | +94.0% |
| 37 | Sveitarfélagið Árborg | 9,633 | $75,041 | 9,132 | +98.6% |
| 38 | Norðurþing | 9,563 | $74,496 | 2,218 | +96.9% |
| 39 | Stykkishólmur | 9,560 | $74,472 | 925 | +74.7% |
| 40 | Langanesbyggð | 9,559 | $74,464 | 390 | +105.0% |
| 41 | Reykjanesbær | 9,490 | $73,927 | 15,736 | +90.8% |
| 42 | Sveitarfélagið Ölfus | 9,459 | $73,685 | 2,035 | +94.4% |
| 43 | Bláskógabyggð | 9,422 | $73,397 | 893 | +104.1% |
| 44 | Borgarbyggð | 9,252 | $72,073 | 2,873 | +104.5% |
| 45 | Strandabyggð | 9,129 | $71,115 | 305 | +93.4% |
| 46 | Hrunamannahreppur | 9,101 | $70,897 | 617 | +121.1% |
| 47 | Rangárþing eystra | 9,092 | $70,827 | 1,464 | +102.1% |
| 48 | Hveragerði | 9,080 | $70,733 | 2,346 | +101.6% |
| 49 | Grímsnes- og Grafningshreppur | 9,018 | $70,250 | 478 | +115.8% |
| 50 | Þingeyjarsveit | 8,978 | $69,938 | 1,036 | +110.2% |
| 51 | Súðavíkurhreppur | 8,899 | $69,323 | 163 | +80.4% |
| 52 | Sveitarfélagið Vogar | 8,885 | $69,214 | 1,366 | +92.8% |
| 53 | Reykhólahreppur | 8,804 | $68,583 | 174 | +97.2% |
| 54 | Húnabyggð | 8,788 | $68,458 | 1,006 | +96.2% |
| 55 | Suðurnesjabær | 8,783 | $68,419 | 3,010 | +85.4% |
| 56 | Ásahreppur | 8,717 | $67,905 | 207 | +54.8% |
| 57 | Húnaþing vestra | 8,574 | $66,791 | 899 | +114.3% |
| 58 | Skaftárhreppur | 8,366 | $65,171 | 389 | +85.5% |
| 59 | Dalabyggð | 8,301 | $64,665 | 487 | +88.1% |
| 60 | Tjörneshreppur | 7,497 | $58,401 | 45 | +96.6% |
| 61 | Fljótsdalshreppur | 7,097 | $55,286 | 77 | +85.3% |
| 62 | Eyja- og Miklaholtshreppur | 6,871 | $53,525 | 75 | +39.9% |
Average salary in Iceland after tax
Income tax is withheld from every pay slip. In 2026 the combined state and municipal rate is 31.49%9 on monthly income up to ISK 498,122, 37.99%9 on income up to ISK 1,398,450 and 46.29%9 above that, with the municipal part based on an average of 14.94%9. Everyone gets a personal tax credit of ISK 72,4929 a month, which is subtracted from the tax. Employees also pay 4%9 of wages into a pension fund, which is deducted before tax is calculated.
On those rules, a median salary of ISK 948,000 leaves about ISK 669,2113 a month ($5,516): ISK 240,8693 goes in income tax and ISK 37,920 into the pension fund, so the employee keeps 70.6%. The average salary of ISK 1,058,000 leaves ISK 734,6933 ($6,055). Tax takes a smaller share of low pay because the credit is fixed: a retail starting wage of ISK 481,643 leaves ISK 389,2673, 80.8% of gross, while ISK 2,000,000 leaves 62.6%3.
- Take-home pay66970.6%
- Income tax24125.4%
- Pension contribution384%
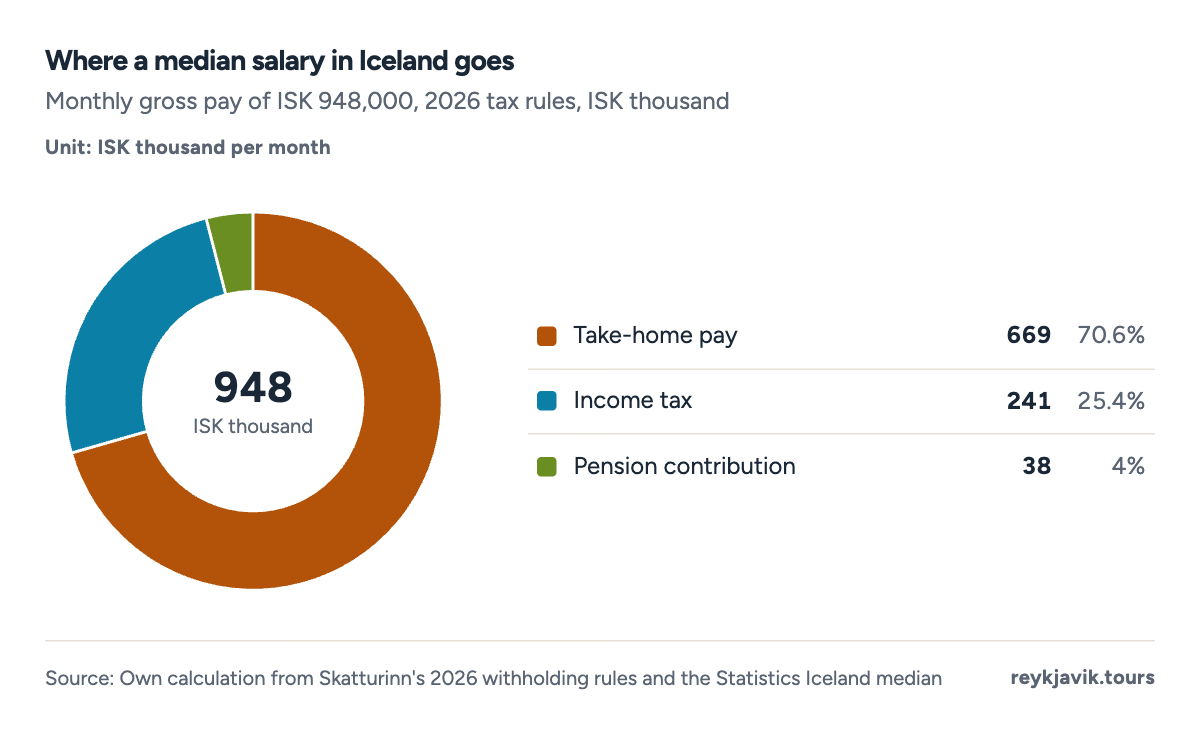
- Take-home pay is ISK 669.2k of ISK 948k.
- Income tax takes ISK 240.9k.
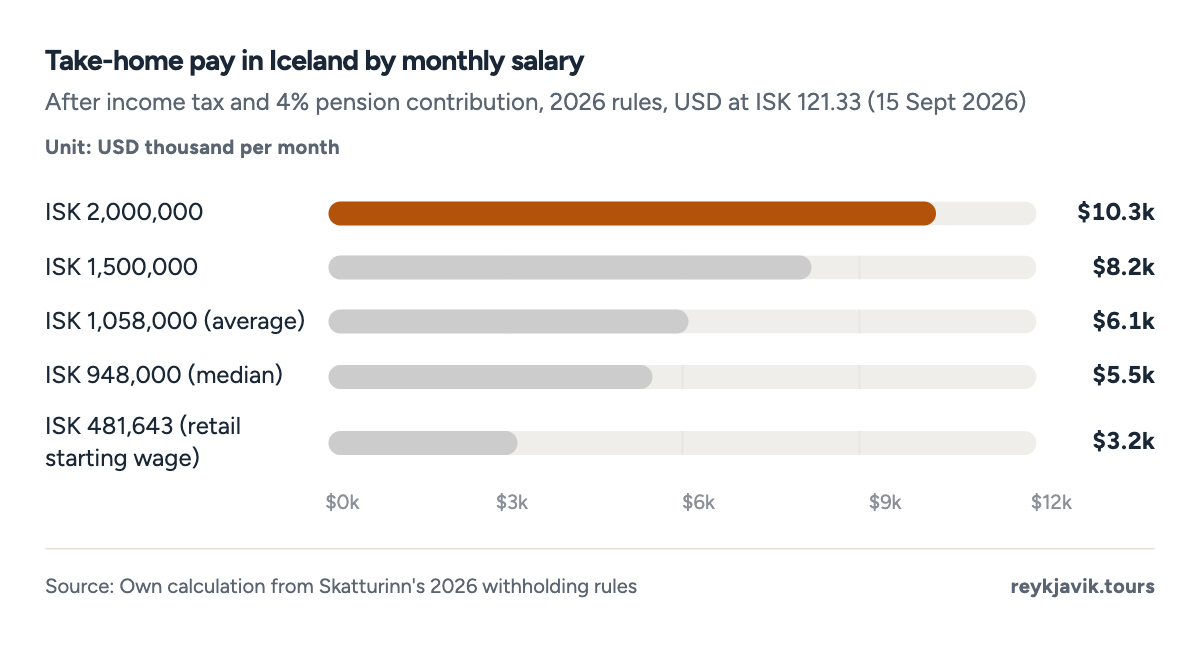
- A median salary takes home $5,516 a month.
- ISK 2,000,000 takes home $10,320.
| ISK 2,000,000 | 667,827 | 1,252,173 | $10,320 | 62.6% |
| ISK 1,500,000 | 445,635 | 994,365 | $8,196 | 66.3% |
| ISK 1,058,000 (average) | 280,987 | 734,693 | $6,055 | 69.4% |
| ISK 948,000 (median) | 240,869 | 669,211 | $5,516 | 70.6% |
| ISK 481,643 (retail starting wage) | 73,111 | 389,267 | $3,208 | 80.8% |
| ISK 0 – 498,122 | 31.49% |
| ISK 498,123 – 1,398,450 | 37.99% |
| Above ISK 1,398,450 | 46.29% |
| Personal tax credit | ISK 72,492 a month (ISK 869,898 a year) |
| Pension contribution, employee | 4% of wages |
| Capital income tax | 22% (first ISK 300,000 of interest income tax-free) |
| Social security tax, paid by employer | 6.35% of wages |
How much tax do you pay in Iceland?
Iceland takes less from an average wage than most OECD countries once employer contributions are counted, but more directly from the employee. The OECD's tax wedge, which adds income tax and social security contributions paid by both employee and employer, was 31.5%5 of labour costs for a single person on the average wage in 2025, below the OECD average of 35.1%5 and close to the United States at 30.0%5. Germany's was 49.3%5. Measured only on the employee's side, the net personal average tax rate in Iceland was 27.2%5, above the OECD average of 25.1%.
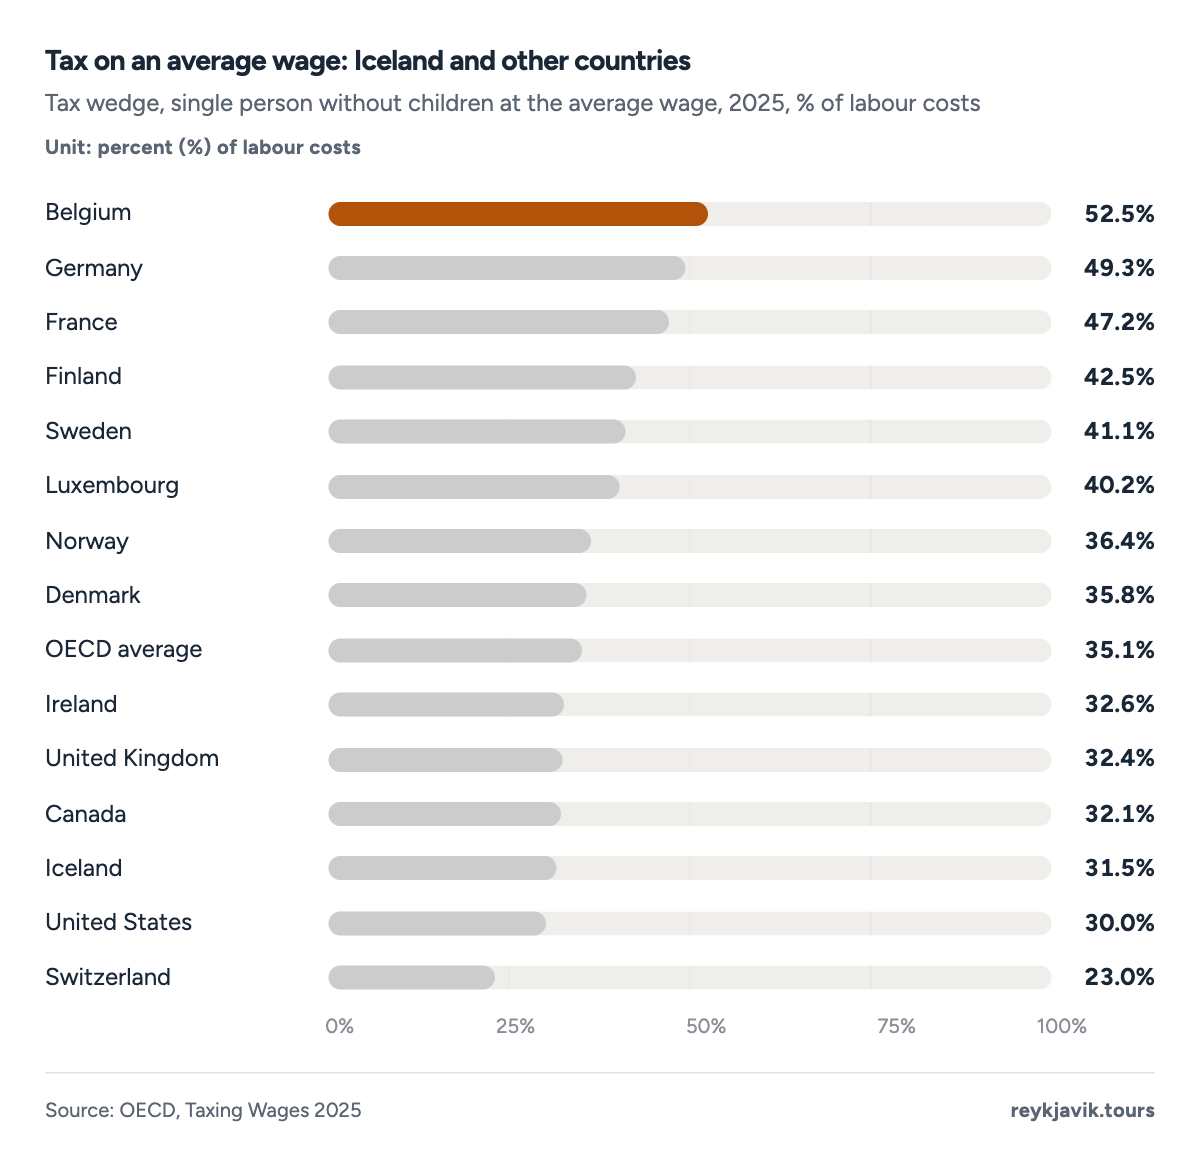
- Iceland's tax wedge is 31.5%.
- The OECD average is 35.1%.
| 1 | Belgium | 52.5% | 39.5% |
| 2 | Germany | 49.3% | 38.7% |
| 3 | France | 47.2% | 28.0% |
| 4 | Austria | 47.1% | 32.5% |
| 5 | Italy | 45.8% | 28.6% |
| 6 | Slovenia | 45.3% | 36.2% |
| 7 | Slovak Republic | 42.7% | 24.3% |
| 8 | Estonia | 42.6% | 23.2% |
| 9 | Finland | 42.5% | 30.7% |
| 10 | Spain | 41.4% | 23.5% |
| 11 | Hungary | 41.2% | 33.5% |
| 12 | Czechia | 41.2% | 21.3% |
| 13 | Sweden | 41.1% | 22.6% |
| 14 | Türkiye | 40.3% | 29.3% |
| 15 | Luxembourg | 40.2% | 32.0% |
| 16 | Latvia | 40.1% | 26.0% |
| 17 | Lithuania | 39.8% | 38.7% |
| 18 | Portugal | 39.3% | 24.9% |
| 19 | Greece | 39.3% | 26.1% |
| 20 | Norway | 36.4% | 28.1% |
| 21 | Netherlands | 35.9% | 27.9% |
| 22 | Denmark | 35.8% | 35.3% |
| 23 | OECD average | 35.1% | 25.1% |
| 24 | Poland | 35.0% | 24.4% |
| 25 | Japan | 33.1% | 22.6% |
| 26 | Ireland | 32.6% | 25.1% |
| 27 | United Kingdom | 32.4% | 23.1% |
| 28 | Canada | 32.1% | 25.6% |
| 29 | Iceland | 31.5% | 27.2% |
| 30 | United States | 30.0% | 24.3% |
| 31 | Australia | 27.9% | 23.5% |
| 32 | Costa Rica | 27.7% | 9.8% |
| 33 | Israel | 26.1% | 21.4% |
| 34 | Korea | 24.8% | 16.5% |
| 35 | Switzerland | 23.0% | 18.1% |
| 36 | Mexico | 21.7% | 13.2% |
| 37 | New Zealand | 20.8% | 20.8% |
| 38 | Chile | 7.5% | 7.1% |
How much is minimum wage in Iceland?
Iceland has no minimum wage set by law. Instead, "the minimum wage for each sector of the labor market is negotiated in collective agreements", and the wages agreed there are minimum terms for all workers in the relevant occupation.10 The government's own guidance adds that "employers and employees may not negotiate for lower wages or worse employment terms than those provided for in the collective wage agreements."11
The retail agreement between the LÍV union federation and SA shows what those floors look like. From 1 January 2026, an adult shop worker starting out is paid at least ISK 481,6436 a month ($3,970), rising to ISK 523,0646 after five years with the same employer. Office staff start at ISK 515,5596. Young workers have lower rates: ISK 404,5806 a month at 16 and ISK 298,6196 at 14. On the same date, rates in the SGS general workers' agreements rose by 5.3%12, and by at least ISK 23,75012 a month.
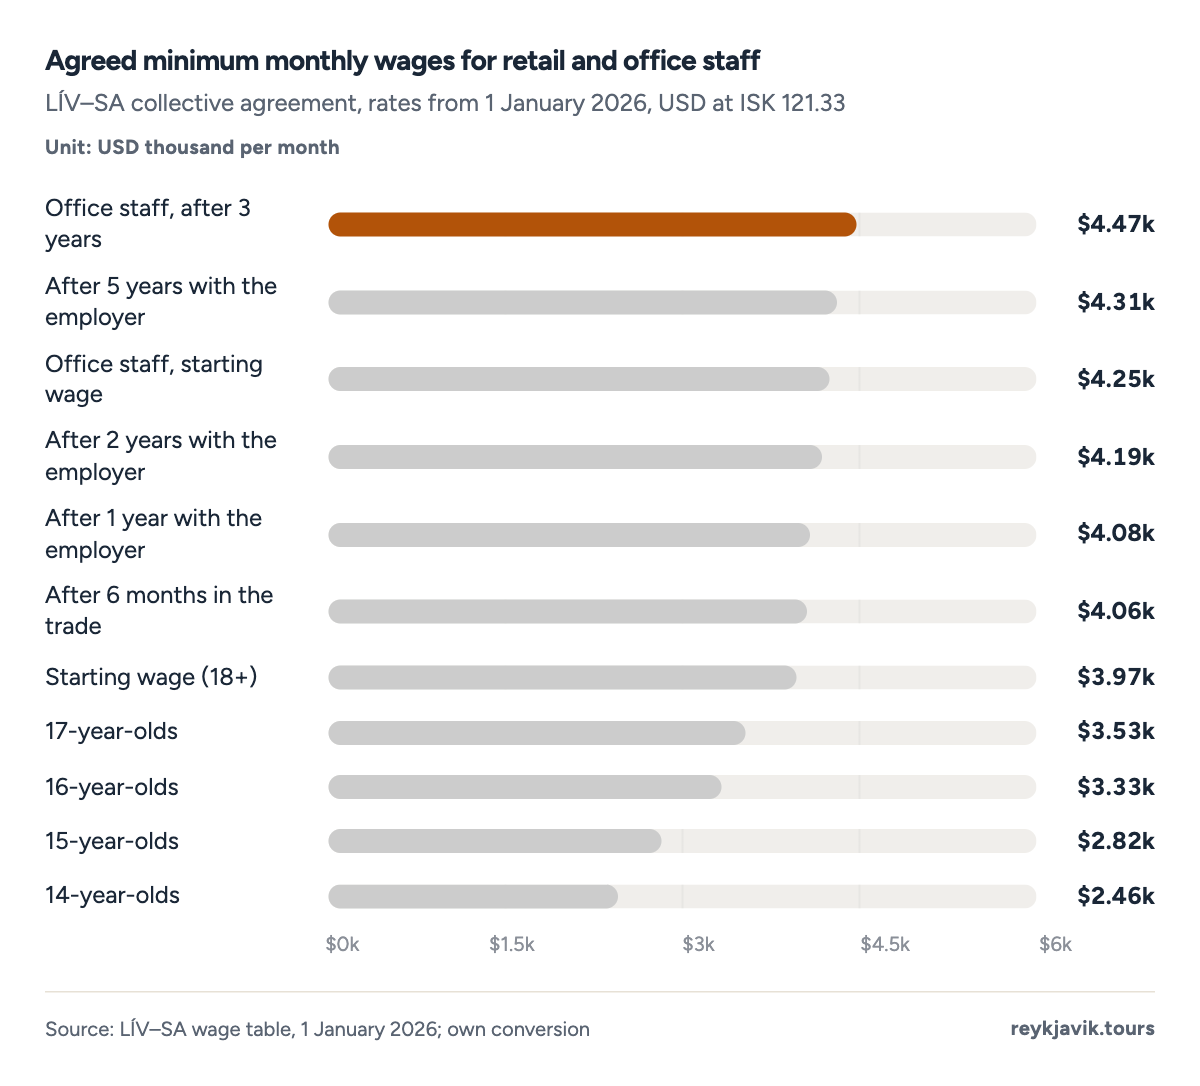
- An adult starting wage is $3,970 a month.
- A 16-year-old's rate is $3,335.
| 14-year-olds | 298,619 | $2,461 | 1,778 | $14.66 |
| 15-year-olds | 341,967 | $2,818 | 2,036 | $16.78 |
| 16-year-olds | 404,580 | $3,335 | 2,409 | $19.86 |
| 17-year-olds | 428,662 | $3,533 | 2,552 | $21.04 |
| Starting wage (18+) | 481,643 | $3,970 | 2,868 | $23.64 |
| After 6 months in the trade | 492,629 | $4,060 | 2,933 | $24.18 |
| After 1 year with the employer | 494,889 | $4,079 | 2,947 | $24.29 |
| After 2 years with the employer | 508,760 | $4,193 | 3,029 | $24.97 |
| After 5 years with the employer | 523,064 | $4,311 | 3,115 | $25.67 |
| Office staff, starting wage | 515,559 | $4,249 | 3,237 | $26.68 |
| Office staff, after 3 years | 541,893 | $4,466 | 3,402 | $28.04 |
Iceland collective bargaining coverage percentage
Agreements can replace a legal minimum because they cover almost everyone. The OECD and AIAS put collective bargaining coverage in Iceland at 90%13 of employees in 2024, against an OECD average of 33.6%13 and 11.1%13 in the United States. Union membership is just as high: trade union density was 90.6%13 in 2023, the highest of the countries compared here, where the OECD average is 15.2%.
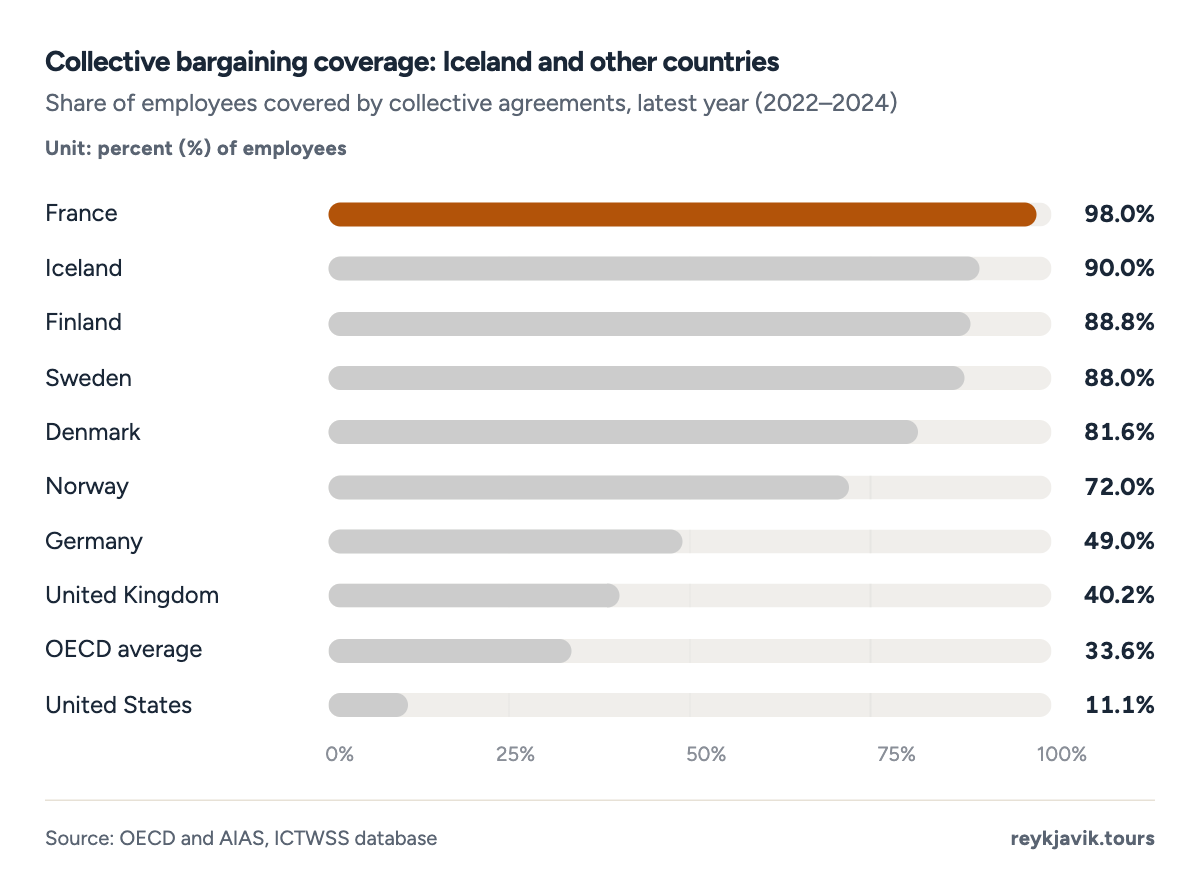
- Iceland's coverage is 90.0%.
- The OECD average is 33.6%.
| 1 | France | 98.0% | 2024 | 10.1% | 2019 |
| 2 | Iceland | 90.0% | 2024 | 90.6% | 2023 |
| 3 | Finland | 88.8% | 2022 | 51.4% | 2024 |
| 4 | Sweden | 88.0% | 2024 | 65.9% | 2024 |
| 5 | Denmark | 81.6% | 2023 | 60.4% | 2024 |
| 6 | Norway | 72.0% | 2022 | 52.1% | 2024 |
| 7 | Germany | 49.0% | 2024 | 14.1% | 2024 |
| 8 | United Kingdom | 40.2% | 2024 | 22.0% | 2024 |
| 9 | OECD average | 33.6% | 2024 | 15.2% | 2024 |
| 10 | United States | 11.1% | 2024 | 9.9% | 2024 |
Average wages in Iceland compared to world leaders
To compare pay across countries, the OECD converts average wages with purchasing power parities, which adjust for price levels. On that basis the average full-time wage in Iceland was $100,6051 in 2025, the highest of all OECD countries, ahead of Luxembourg at $98,5301 and Switzerland at $92,2851; the United States was at $86,9771. The OECD average was $64,8091. The other Nordic countries are lower: Denmark $78,090, Norway $73,462 and Sweden $61,443. At constant prices, Iceland's average wage grew 34.6%3 from 2015.
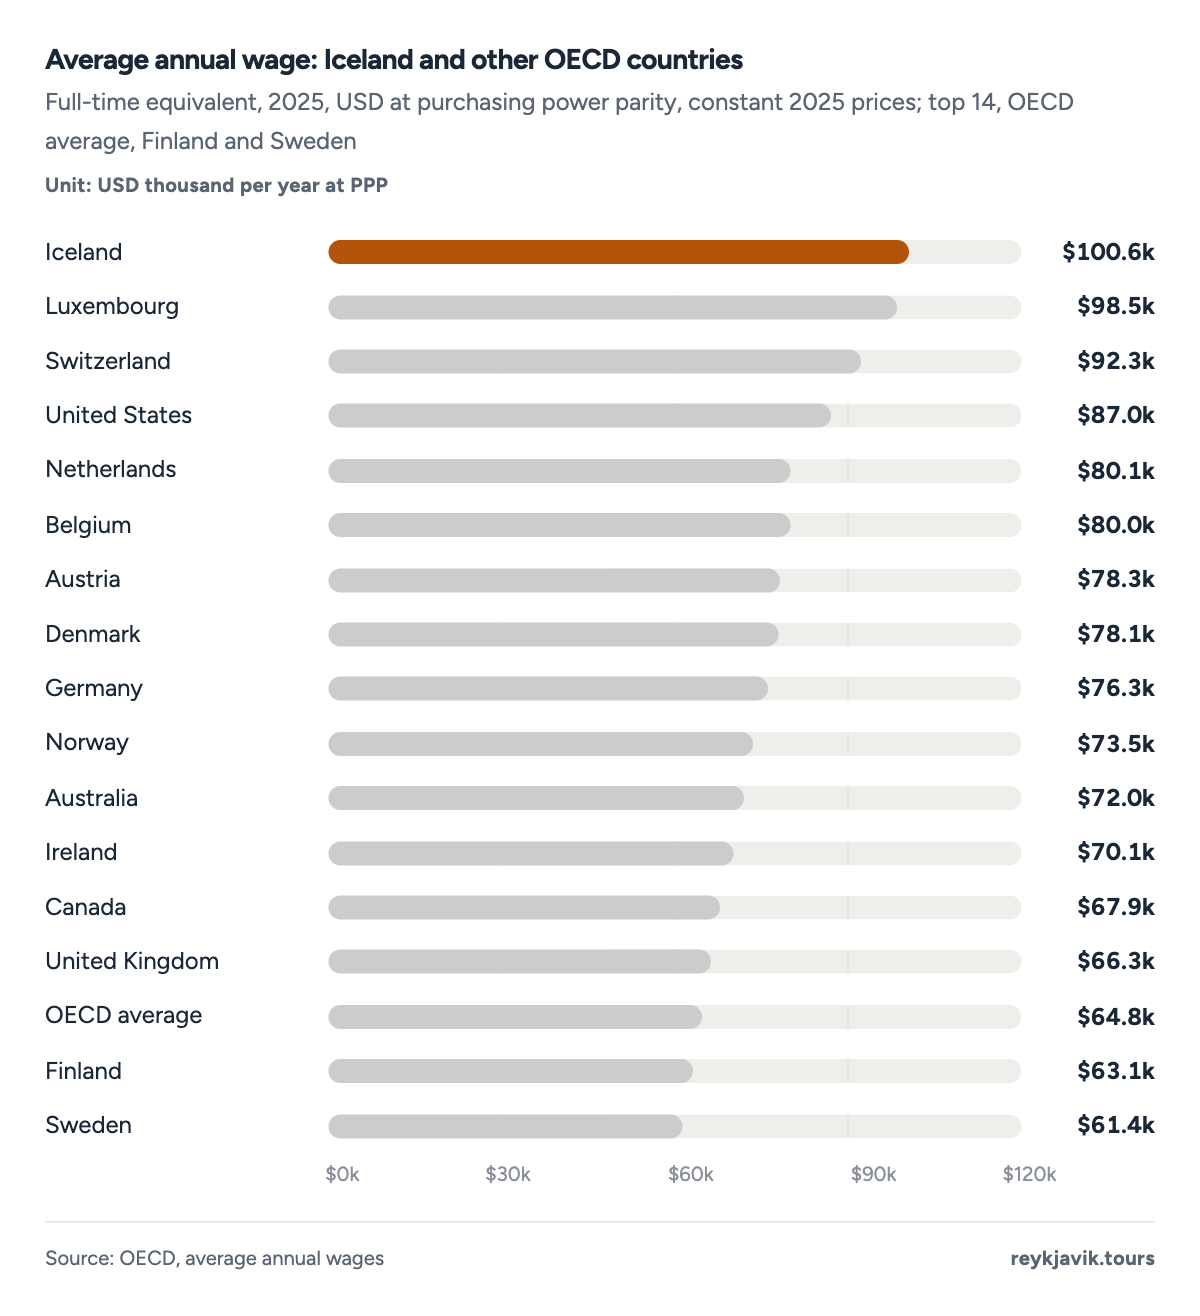
- Iceland leads at $100,605 a year.
- The OECD average is $64,809.
Projection: linear trend of 2015–2025 yearly values, 95% prediction range. Our calculation, not a forecast.
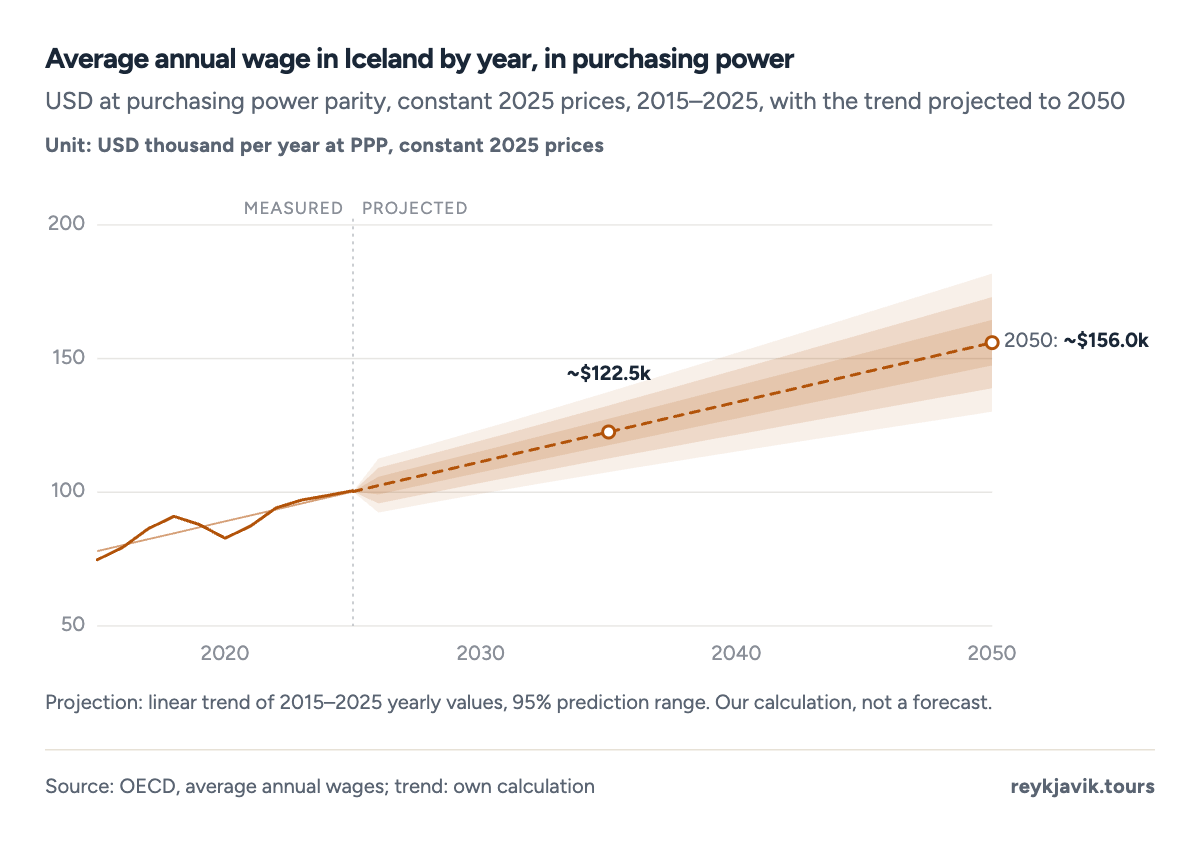
- The average wage was $100,605 in 2025.
- It dipped to $82,750 in 2020.
| 1 | Iceland | $100,605 |
| 2 | Luxembourg | $98,530 |
| 3 | Switzerland | $92,285 |
| 4 | United States | $86,977 |
| 5 | Netherlands | $80,136 |
| 6 | Belgium | $80,009 |
| 7 | Austria | $78,301 |
| 8 | Denmark | $78,090 |
| 9 | Germany | $76,285 |
| 10 | Norway | $73,462 |
| 11 | Australia | $72,018 |
| 12 | Ireland | $70,113 |
| 13 | Canada | $67,901 |
| 14 | United Kingdom | $66,299 |
| 15 | OECD average | $64,809 |
| 16 | Slovenia | $63,376 |
| 17 | Finland | $63,053 |
| 18 | Sweden | $61,443 |
| 19 | Korea | $61,259 |
| 20 | New Zealand | $60,896 |
| 21 | France | $60,483 |
| 22 | Lithuania | $58,112 |
| 23 | Spain | $57,779 |
| 24 | Israel | $57,426 |
| 25 | Italy | $53,864 |
| 26 | Japan | $50,183 |
| 27 | Poland | $49,074 |
| 28 | Portugal | $44,937 |
| 29 | Latvia | $44,709 |
| 30 | Czechia | $43,607 |
| 31 | Estonia | $41,019 |
| 32 | Hungary | $39,145 |
| 33 | Slovak Republic | $37,832 |
| 34 | Greece | $32,412 |
| 35 | Mexico | $24,463 |
Iceland per capita income
Income per person across the whole economy tells a similar story. The World Bank puts Iceland's gross national income per capita at $89,22014 in 2025 by its Atlas method, fourth among the ten rich countries compared here, behind Switzerland, Norway and Luxembourg and just ahead of the United States at $88,81014. In 2015 it was $53,17014. Gross domestic product per person was $98,32314 in 2025.
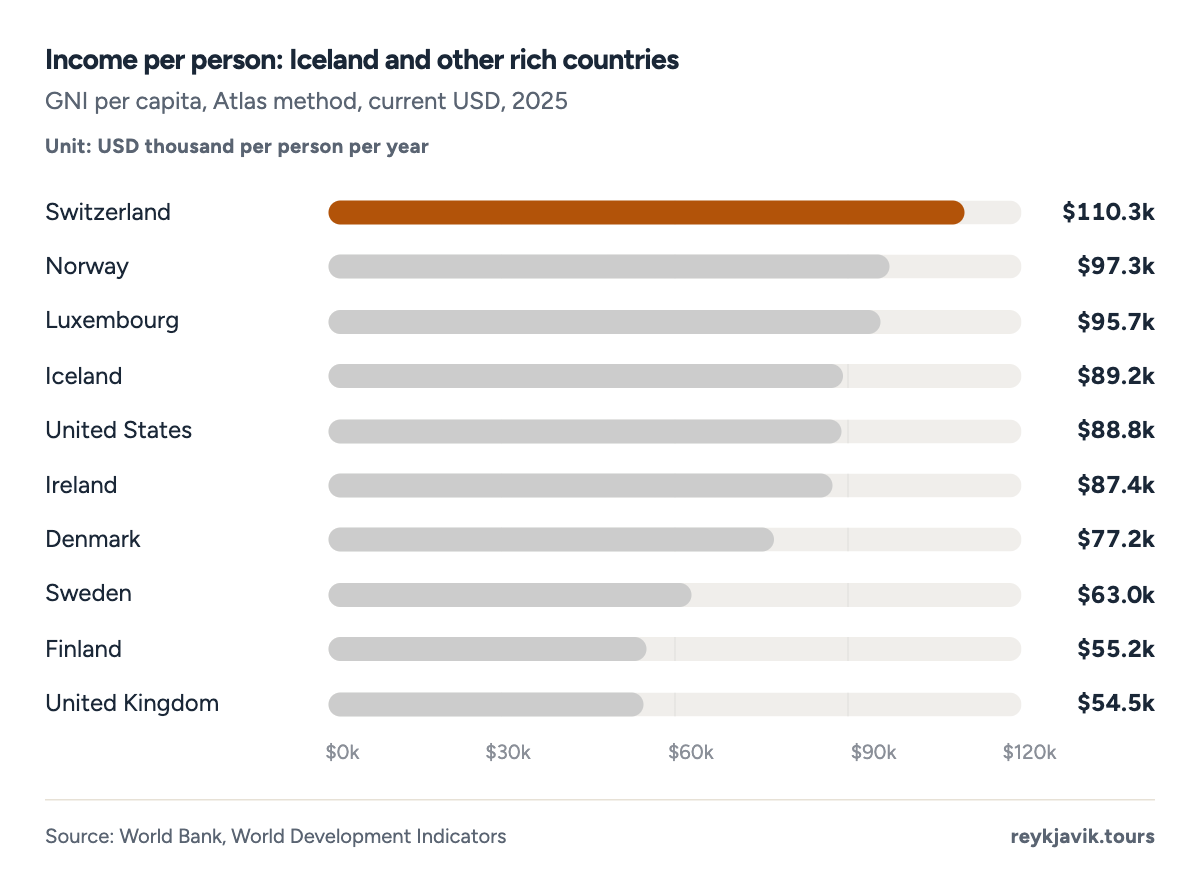
- Iceland's GNI per capita is $89,220.
- Switzerland leads at $110,330.
| 1 | Switzerland | $110,330 | $114,769 |
| 2 | Norway | $97,310 | $94,594 |
| 3 | Luxembourg | $95,720 | $147,252 |
| 4 | Iceland | $89,220 | $98,323 |
| 5 | United States | $88,810 | $90,027 |
| 6 | Ireland | $87,360 | $131,592 |
| 7 | Denmark | $77,190 | $76,970 |
| 8 | Sweden | $63,010 | $63,133 |
| 9 | Finland | $55,250 | $56,149 |
| 10 | United Kingdom | $54,550 | $57,602 |
How fast wages are rising
Statistics Iceland's wage index, which tracks changes in wages over time, rose 7.9%15 in 2025 and 6.6%15 in 2024. Over the ten years to 2025 it rose by 7.7%3 a year on average, and the index now stands at about 10 times3 its 1989 level. Prices absorbed most of the rise in 2025: tax-register income grew 5.7% in 2025 but only 1.6% after inflation.7
Projection: linear trend of 1989–2025 yearly values, 95% prediction range. Our calculation, not a forecast.
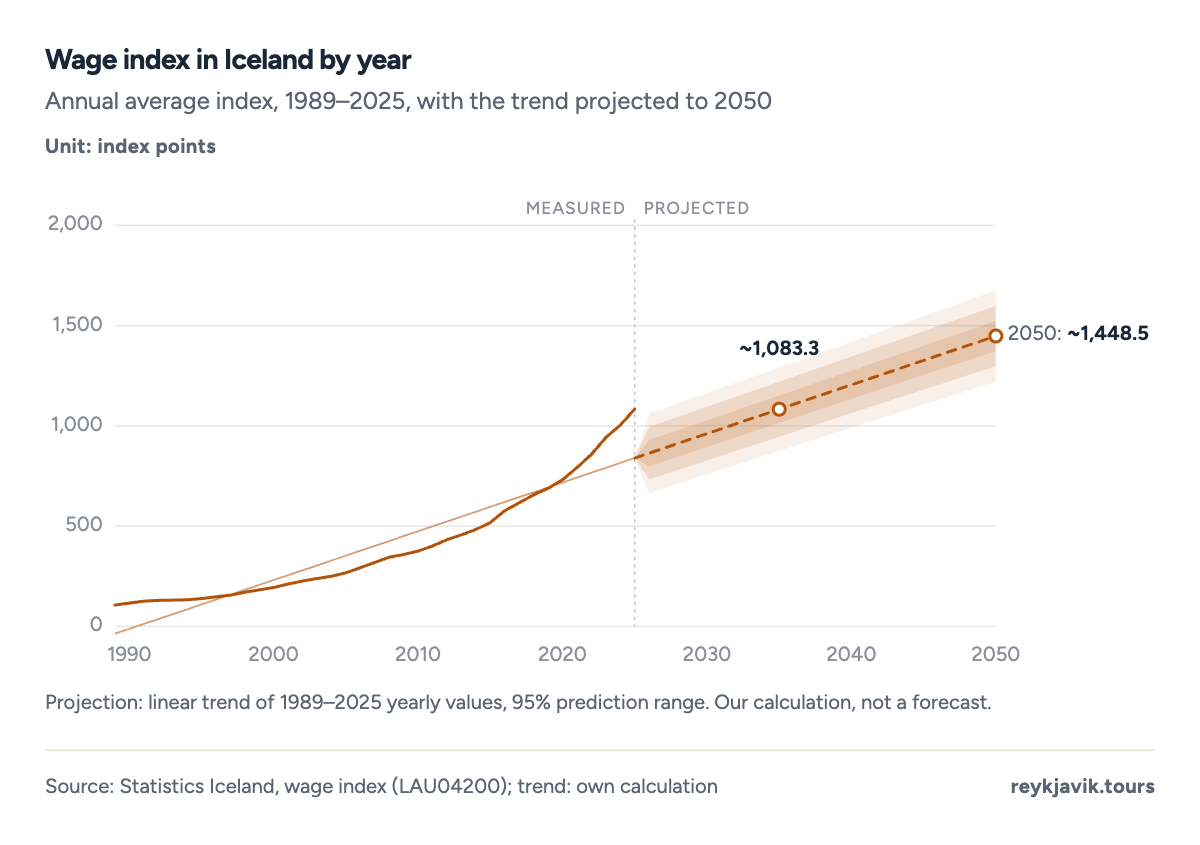
- The index reached 1084.0 in 2025.
- It was 518.2 in 2015.
| 2025 | 1,084.0 | +7.9% |
| 2024 | 1,004.6 | +6.6% |
| 2023 | 942.4 | +9.8% |
| 2022 | 858.4 | +8.3% |
| 2021 | 792.7 | +8.3% |
| 2020 | 732.0 | +6.3% |
| 2019 | 688.5 | +4.9% |
| 2018 | 656.4 | +6.5% |
| 2017 | 616.6 | +6.8% |
| 2016 | 577.1 | +11.4% |
| 2015 | 518.2 | +7.2% |
| 2014 | 483.5 | +5.8% |
| 2013 | 457.0 | +5.7% |
| 2012 | 432.5 | +7.8% |
| 2011 | 401.3 | +6.8% |
| 2010 | 375.8 | +4.8% |
| 2009 | 358.6 | +3.9% |
| 2008 | 345.0 | +8.1% |
| 2007 | 319.1 | +9.0% |
| 2006 | 292.7 | +9.5% |
| 2005 | 267.2 | +6.8% |
| 2004 | 250.3 | +4.7% |
| 2003 | 239.1 | +5.6% |
| 2002 | 226.4 | +7.1% |
| 2001 | 211.3 | +8.9% |
| 2000 | 194.1 | +6.6% |
| 1999 | 182.0 | +6.8% |
| 1998 | 170.4 | +9.4% |
| 1997 | 155.8 | +5.4% |
| 1996 | 147.8 | +6.4% |
| 1995 | 138.9 | +4.5% |
| 1994 | 132.9 | +1.2% |
| 1993 | 131.3 | +1.4% |
| 1992 | 129.5 | +2.9% |
| 1991 | 125.8 | +8.4% |
| 1990 | 116.1 | +9.2% |
Poverty rate of Iceland
High average pay does not reach everyone. Statistics Iceland's at-risk-of-poverty rate, based on the EU survey of income and living conditions, was 9.0%16 in 2023, about 35,00016 people. The rate has moved between 7.6%16 and 10.2%16 since 2004. Children are most exposed, at 12.8%16, and people aged 65 and over least, at 3.9%16.
Projection: linear trend of 2004–2023 yearly values, 95% prediction range. Our calculation, not a forecast.
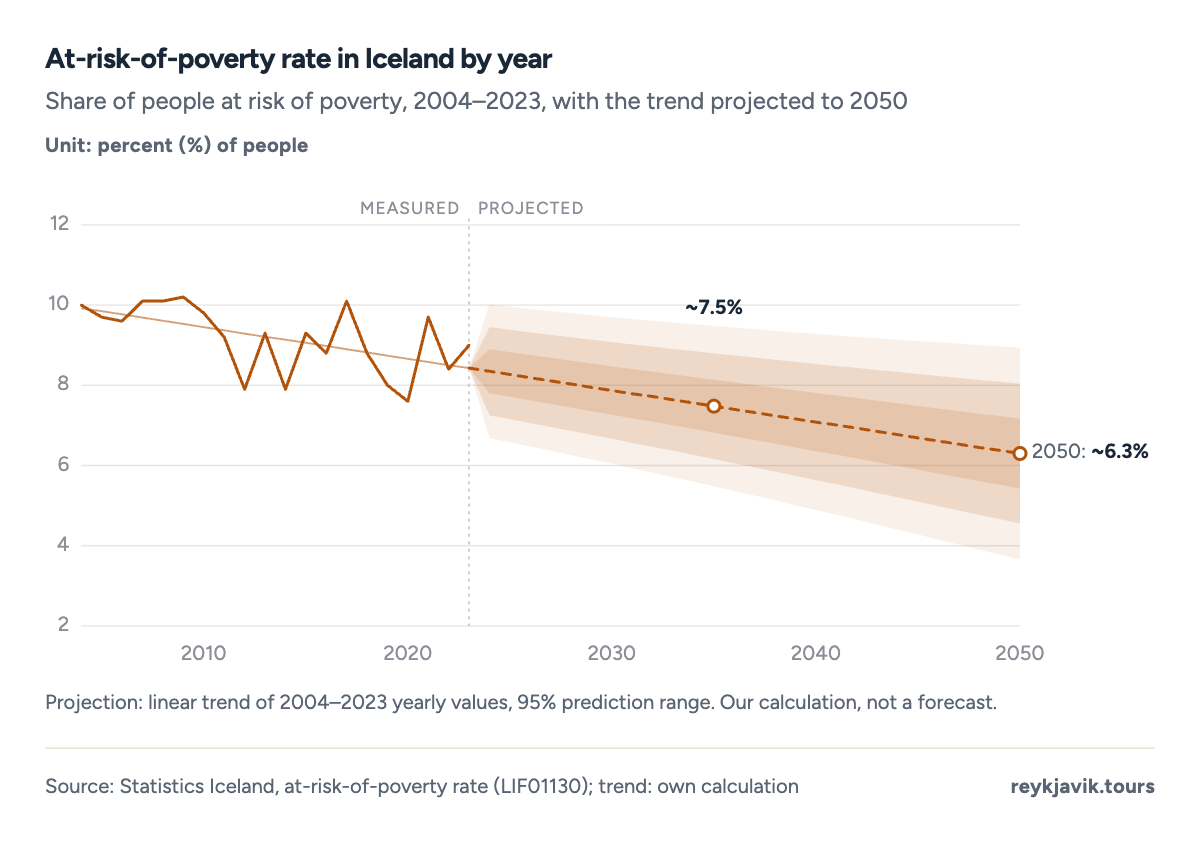
- The rate was 9.0% in 2023.
- It was lowest in 2020 at 7.6%.
| 1 | 0–17 | 12.8% |
| 2 | 18–29 | 11.9% |
| 3 | 30–44 | 10.8% |
| 4 | 45–64 | 6.9% |
| 5 | 65 and over | 3.9% |
What the numbers mean
For someone weighing a job in Iceland, the headline average needs three corrections. First, it is an average of full-time pay including overtime; the typical employee earns the median, ISK 948,0002, and regular pay without overtime is lower again. Second, tax and pension take nearly 30% of a median pay slip, leaving about ISK 669,2113 a month. Third, prices are high, which is why the purchasing-power comparison matters: it still puts Iceland first in the OECD, so the high wages are not only a matter of an expensive currency.1
The spread between jobs is wide. Doctors and ship and aircraft controllers earn about twice the average, while childcare, retail and tourism jobs pay the least: shop salespersons average ISK 771,0002 and accommodation and food services ISK 859,0002. Collective agreements cover 90%13 of employees and set the floor for these jobs, and over the past decade the lowest-paid jobs listed here saw the fastest pay growth.
Conclusions
- The average full-time salary in Iceland was ISK 1,058,000, about $8,242, a month in 2025, but 64% of employees earn less; the median of ISK 948,000, about $7,385, is the better guide to a typical salary.
- After income tax and the 4% pension contribution, a median earner keeps about 70.6% of gross pay, and the fixed personal tax credit makes the system progressive: a retail starting wage keeps 80.8%, a salary of ISK 2 million 62.6%.
- Pay by job ranges more than threefold, from ISK 641,000 for child-care workers to ISK 2,169,000 for doctors, and the unadjusted gender pay gap, 10.4% in 2024, has widened since 2022 after falling from 20.5% in 2008.
- Iceland has no legal minimum wage, yet it has the OECD's highest average wage in purchasing power, $100,605 in 2025, with agreed floors, such as ISK 481,643 a month for adult retail staff, set in agreements that cover 90% of employees.
Methodology
- Earnings 2014–2025
- Income 1990–2025
- 26 jobs · 62 municipalities
- Tax rules 2026
Definition. The average salary is the mean of total monthly earnings of full-time employees in Statistics Iceland's earnings survey: basic pay plus overtime, shift and other payments. Median = the middle employee. Income figures come from tax returns and include all income of individuals.
Data sources. Earnings by occupation, sector, industry and distribution from Statistics Iceland's earnings survey,2 the gender pay gap,8 the wage index15 and the at-risk-of-poverty rate16 from Statistics Iceland; income by age, education and municipality from tax registers;7 tax rules from Skatturinn;9 agreed wage rates from the LÍV–SA wage table6 and SGS;12 the legal basis of minimum pay from posting.is10 and Ísland.is;11 international comparisons from the OECD1 and the World Bank;14 exchange rates from the Central Bank of Iceland.4
Calculations. USD values of yearly series use each year's average Central Bank rate (2025: ISK 128.37 per USD); 2026 wage rates and take-home pay use ISK 121.33 (15 Sept 2026). Hourly pay = average total monthly earnings ÷ average paid hours. Take-home pay = gross − 4% pension − income tax, where tax = bracket rates on 96% of gross minus the ISK 72,492 personal credit (no other deductions, single person). Trend projections are straight-line fits with a 95% prediction range, not forecasts.
Limitations. Earnings cover full-time employees in the survey, not the self-employed. Occupation figures for small groups are based on few observations. Tax-register incomes are per person, not per household, and municipality codes 5716 and 5613 are shown under their current merged names (Skagafjörður, Húnabyggð). OECD wages are at constant 2025 prices in PPP dollars and differ from survey figures. The pay gap chart has no trend projection because a straight line would soon fall below zero. Poverty data end in 2023.
Sources
- OECD. “Average annual wages (AV_AN_WAGE), constant 2025 prices, USD PPP.” OECD Data Explorer. sdmx.oecd.org. Accessed 16 Sept. 2026. Back to text
- Statistics Iceland (Hagstofa Íslands). “Wage distributions in the Icelandic labour market 2025; earnings tables VIN02001–VIN02004.” Statistics Iceland, 13 May 2026. statice.is. Accessed 16 Sept. 2026. Back to text
- Reykjavik Tours research. “Average salary in Iceland: conversions, hourly pay and take-home pay calculations.” Reykjavik Tours. reykjavik.tours. Accessed 16 Sept. 2026. Back to text
- Central Bank of Iceland (Seðlabanki Íslands). “Official exchange rate, USD/ISK, daily and yearly averages.” Central Bank of Iceland. sedlabanki.is. Accessed 16 Sept. 2026. Back to text
- OECD. “Taxing Wages: tax wedge decompositions, single person at the average wage, 2025.” OECD Data Explorer. sdmx.oecd.org. Accessed 16 Sept. 2026. Back to text
- LÍV and SA (Confederation of Icelandic Enterprise). “Launataxtar 1. janúar 2026: kjarasamningur LÍV og SA (wage rates from 1 January 2026).” Félag verslunar- og skrifstofufólks (FVSA), Jan. 2026. fvsa.is. Accessed 16 Sept. 2026. Back to text
- Statistics Iceland (Hagstofa Íslands). “Total income of individuals exceeds ISK 10.5 million in 2025; income tables TEK01001, TEK01002, TEK01007, TEK01008.” Statistics Iceland, 3 Sept. 2026. statice.is. Accessed 16 Sept. 2026. Back to text
- Statistics Iceland (Hagstofa Íslands). “The unadjusted gender pay gap 2008–2024 (VIN02010).” Statistics Iceland. px.hagstofa.is. Accessed 16 Sept. 2026. Back to text
- Iceland Revenue and Customs (Skatturinn). “Staðgreiðsla 2026: tax brackets, personal tax credit and other key figures.” Skatturinn, 2026. skatturinn.is. Accessed 16 Sept. 2026. Back to text
- Administration of Occupational Safety and Health (Vinnueftirlitið). “The Icelandic labour market.” posting.is. posting.is. Accessed 16 Sept. 2026. Back to text
- Ísland.is. “Labour market: collective wage agreements.” Government of Iceland. island.is. Accessed 16 Sept. 2026. Back to text
- Starfsgreinasamband Íslands (SGS). “Launahækkun 1. janúar (pay rise on 1 January).” SGS, 25 Dec. 2025. sgs.is. Accessed 16 Sept. 2026. Back to text
- OECD and AIAS. “Collective bargaining coverage and trade union density (ICTWSS database).” OECD Data Explorer. sdmx.oecd.org. Accessed 16 Sept. 2026. Back to text
- World Bank. “GNI per capita, Atlas method (NY.GNP.PCAP.CD) and GDP per capita (NY.GDP.PCAP.CD).” World Development Indicators. data.worldbank.org. Accessed 16 Sept. 2026. Back to text
- Statistics Iceland (Hagstofa Íslands). “Wage index, annual averages 1989–2025 (LAU04200).” Statistics Iceland. px.hagstofa.is. Accessed 16 Sept. 2026. Back to text
- Statistics Iceland (Hagstofa Íslands). “At-risk-of-poverty rate among individuals by sex and age 2004–2023 (LIF01130).” Statistics Iceland. px.hagstofa.is. Accessed 16 Sept. 2026. Back to text
About the author
Laufey turns public statistics on tourism and travel into research people can check and cite.
Every figure on this page links to its source. How we research
Related research
More data on Iceland's weather and travel from Reykjavik Tours.
- EconomyAverage Cost of Living in Iceland (2026 Data)$3,679/month average cost of living in Iceland (single person)Read the research →
- EconomyIceland GDP per Capita: Nominal, PPP and Ranking (2026 Data)$98,323 GDP per person in Iceland, 2025Read the research →
- HousingAverage Rent in Iceland (2026 Data)ISK 269k average monthly rent in IcelandRead the research →
- HousingHow Much Is a House in Iceland? (2026 Data)$467k-779k typical capital-region apartmentRead the research →