Iceland Rate of Exchange (2026 Data)
The Iceland rate of exchange: 120.4 ISK per US dollar (September 2026) - with 65 years of krona history, the 2008 crash, and how much cash to bring.
- Published
- Updated
- 7 sources
- 6 statistics
- 9 min read

- M.Sc. in Atmospheric Sciences, University of Iceland (Háskóli Íslands), with a minor thesis on North Atlantic storm-track variability
- Former research assistant at the Icelandic Meteorological Office (Veðurstofa Íslands), working on subarctic climate modeling and volcanic-ash dispersion forecasting
- B.A. in Sociology, also from the University of Iceland, with fieldwork on rural depopulation and tourism's impact on small fishing communities (Westfjords focus)
- Grew up in Akureyri, spent seven years living in Reykjavík and two in a small village in the Westfjords - brings first-hand experience of Iceland's regional weather extremes and community life
- Fluent in Icelandic and English; has translated Icelandic Met Office public advisories for international outlets
- Published field notes and data-driven pieces on glacier retreat (Vatnajökull), aurora forecasting, and the socioeconomic effects of overtourism in the Golden Circle

- M.A. in Journalism, University of Iceland, with additional coursework in Environmental Communication at the University of Bergen (Norway), giving a comparative Nordic lens
- 12+ years in Icelandic media, including editorial roles at RÚV (Iceland's national broadcaster) covering weather-related public safety reporting (storms, volcanic eruptions, road closures)
- Former fact-checking lead for a travel-and-culture desk, specializing in verifying tourism statistics, safety advisories, and climate data against primary sources (Vedur.is, Statistics Iceland)
- Has overseen editorial standards for bilingual (Icelandic/English) publications, ensuring both cultural nuance and accuracy for international readers
- Advocate for citing primary sources (Icelandic Met Office, Icelandic Tourist Board / Ferðamálastofa) rather than secondhand reporting
Key findings
- 120.4The Iceland rate of exchange is 120.4 ISK per US dollar at the Central Bank's September 2026 midpoint.
- ~50%The krona lost ~50% of its value against the euro in the 2008 crash.
- 97.5%About 97.5% of payments in Iceland are electronic - the country runs nearly without cash.
- 139.6One euro costs 139.6 ISK and one British pound 162.7 ISK at the September 2026 midpoints.
- 2001The krona has floated freely since 2001; before that it was pegged and banded for 30 years.
- 128.4The 2025 average rate was 128.4 ISK per dollar, 7% stronger than 2024's 138.0.
One US dollar buys about 120 krona at the Central Bank of Iceland's September 2026 midpoint - the strongest the Icelandic currency has been in seven years, and a long way from the 290 ISK per euro that the broken markets of December 2008 briefly quoted1. The Iceland rate of exchange matters to two very different audiences: travellers deciding how much money to bring, and anyone who remembers when the krona was a byword for financial collapse.
This page tracks the krona across 65 years of official data - from the pre-decimal 0.36 ISK per dollar of 1960, through the 2008 crash, to today's near-cashless economy where the rate you get at an ATM matters more than the notes in your wallet. Every figure comes from the Central Bank, the World Bank or the ECB, and the conversions use the September 2026 midpoints unless stated otherwise2.
What is the Iceland rate of exchange?
The Iceland rate of exchange is set daily by the Central Bank of Iceland, which publishes midpoint rates for the krona against major currencies. On 16 September 2026 those midpoints were 120.43 ISK per US dollar, 139.60 per euro and 162.68 per British pound1. Because Iceland is not in the EU, the krona floats freely: the rate you actually get at a Reykjavik ATM or card terminal will sit within a percent or two of these midpoints, depending on your bank's fee3.
The krona (ISK) is one of the smallest freely traded currencies in the world - a currency for a country of 393,000 people, roughly the population of Malta backed by none of Malta's currency-union stability. That smallness explains both its history of violent moves and the wide spreads travellers once feared; today the spreads are ordinary, and the arithmetic is simple: divide your amount by 120 for dollars, by 140 for euros, by 163 for pounds1.
Three quick reference points from September 2026: a budget traveller's 10,000 ISK day is about $83; the Blue Lagoon's entry fee translates to tens of dollars rather than hundreds; and 100 units of each major currency buy 12,043 (USD), 13,960 (EUR) or 16,268 (GBP) krona - the bar chart below shows the same comparison visually1.
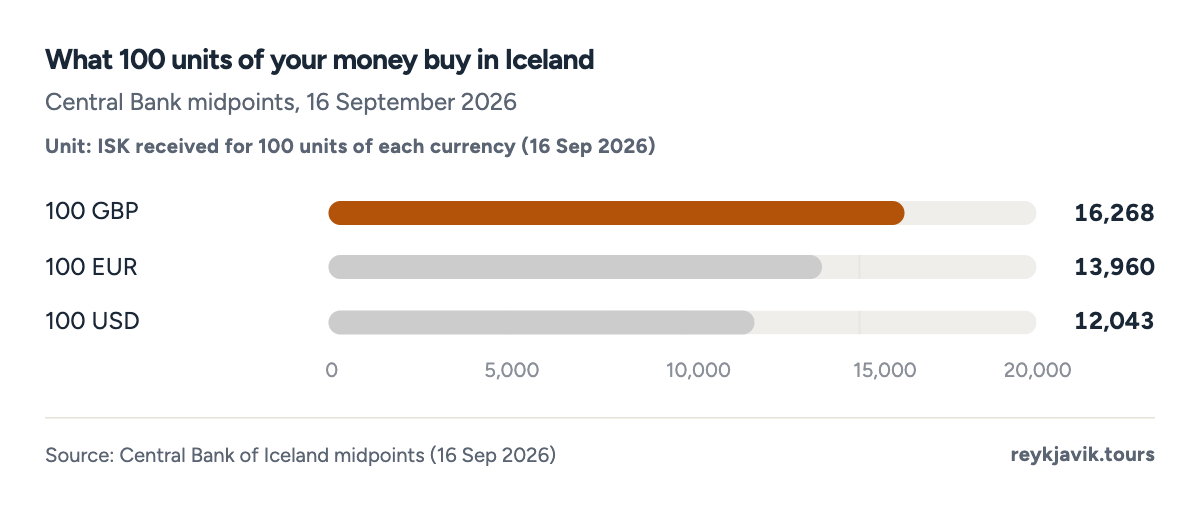
- 100 British pounds convert to 16,268 ISK - the largest haul of the three.
- 100 US dollars buy 12,043 ISK at the September 2026 midpoint.
| 1 USD | 120 |
| 5 USD | 602 |
| 10 USD | 1,204 |
| 20 USD | 2,409 |
| 50 USD | 6,022 |
| 100 USD | 12,043 |
| 1 EUR | 140 |
| 10 EUR | 1,396 |
| 100 EUR | 13,960 |
| 1 GBP | 163 |
| 10 GBP | 1,627 |
| 100 GBP | 16,268 |
| 1,000 | 8.3 | 7.2 | 6.1 |
| 5,000 | 41.5 | 35.8 | 30.7 |
| 10,000 | 83.0 | 71.6 | 61.5 |
| 50,000 | 415.2 | 358.2 | 307.4 |
How many Iceland kronas in a dollar?
About 120 krona to the dollar at the September 2026 midpoint - and the mental arithmetic travellers actually use works in the other direction too: multiply krona by 0.0083 to get dollars1. How much is 1 US dollar in Iceland, asked as a price, is therefore "about 120 krona"; a 4,990 ISK tour brochure price is a $41 tour2. For the pound, how many Iceland krona to the pound is about 163 - sterling buys roughly a third more krona than a dollar1.
Running through the questions travellers type into search engines: how much is $1 in Iceland? About 120 krona. How much is $100 in Iceland? About 12,043 krona - enough for a casual dinner for two in Reykjavik1. How much is 50 dollars in Iceland? About 6,022 krona - that same dinner for one, plus the taxi start you will not need downtown1. How much is 5000 in Iceland? A 5,000 ISK banknote - the one with Ragnheiður Jónsdóttir on it - is worth about $41.50, and it is also the most useful single note in the country1. How much is Iceland currency to dollar in reverse? One krona is about 0.83 US cents2.
And the value question behind all the arithmetic - how much is Iceland money worth? The krona itself is worth exactly what the next day's midpoint says: it is a floating currency with no official target, and its value has risen about 7% against the dollar over the last twelve months1. The tables above and below give the full conversion matrix without you having to multiply anything2.
Rounding helps more than precision here. Because krona prices run long, Icelanders themselves think in thousands - a 4,990 ISK dinner is "about five thousand" - and each 1,000 ISK works out to $8.30, EUR 7.20 or GBP 6.15 at the September 2026 midpoints1. If you keep one mental trick, make it this: drop the last two digits of a krona price and divide by 1.2. A 7,450 ISK guesthouse night becomes 74.5, divided by 1.2 - about $622.
The Iceland currency over time
The story runs through three eras, and the 65-year World Bank series tells it in one line per decade. In the fixed-rate era (1960-1980), one dollar cost 0.36 ISK in 1960 - the pre-decimal krona of aurar coins - and still under 2 ISK in 1980, because the pegged rate moved only in official devaluation steps4. In the banded era (1980-2001), the krona was pegged to a basket of currencies (16 of them by 1996) with a ±6% band, and the average rate crept from the 20s to the high 60s5. In the floating era (2001-now), the rate found its market level: the 60s, then the 2008 crash to 123.5, then a long 110-138 plateau4.
The euro series is shorter - the ECB reference rate starts in 1999 - but shows the same shape: 77.2 ISK per euro in 1999, 143.8 in the crash year, 144.7 in 20256. Statistically, the dollar line is the page's backbone: 66 annual observations, the longest official series that exists for the krona, and the trend projection to 2050 continues its gentle slope downward toward a weaker krona - our calculation, not a forecast2.
Two details make the history legible. First, inflation: Iceland's consumer prices rose 5.86% in 2024 and 4.09% in 2025, and high-inflation currencies steadily lose units of purchasing power - which is why the nominal rate climbs over decades4. Second, the decade averages smooth the story: the 2010s (119.3 ISK per dollar) and the 2020s (133.7) differ by less than any decade-to-decade move since the 1970s, evidence of the calmest stretch in the krona's floating history2.
Projection: linear trend of 1960–2025 yearly values, 95% prediction range. Our calculation, not a forecast.
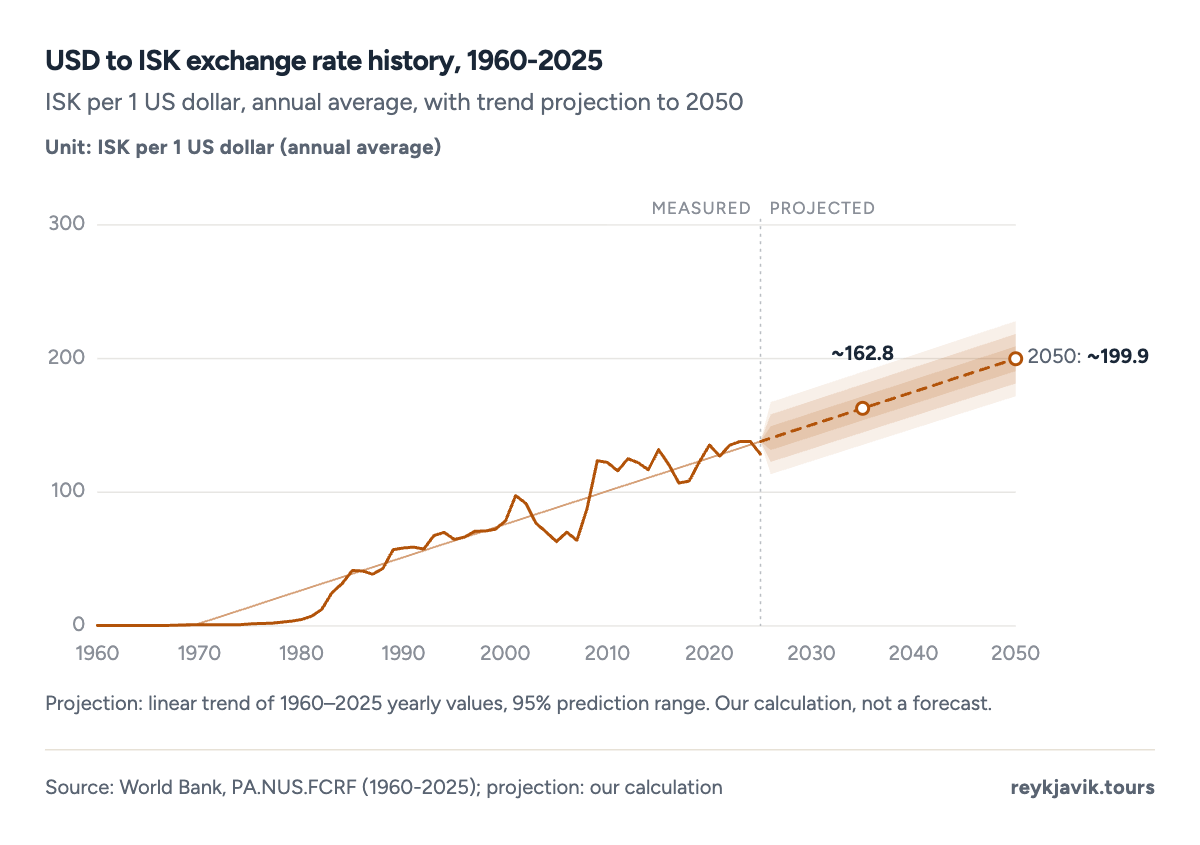
- A dollar bought 0.36 ISK in 1960 and about 128 ISK in 2025 - a 350-fold rise.
- The steepest jump is 2008-2009, when the krona collapsed in the financial crisis.
- Since 2017 the rate has oscillated between roughly 122 and 138 ISK per dollar.
Projection: linear trend of 1999–2025 yearly values, 95% prediction range. Our calculation, not a forecast.
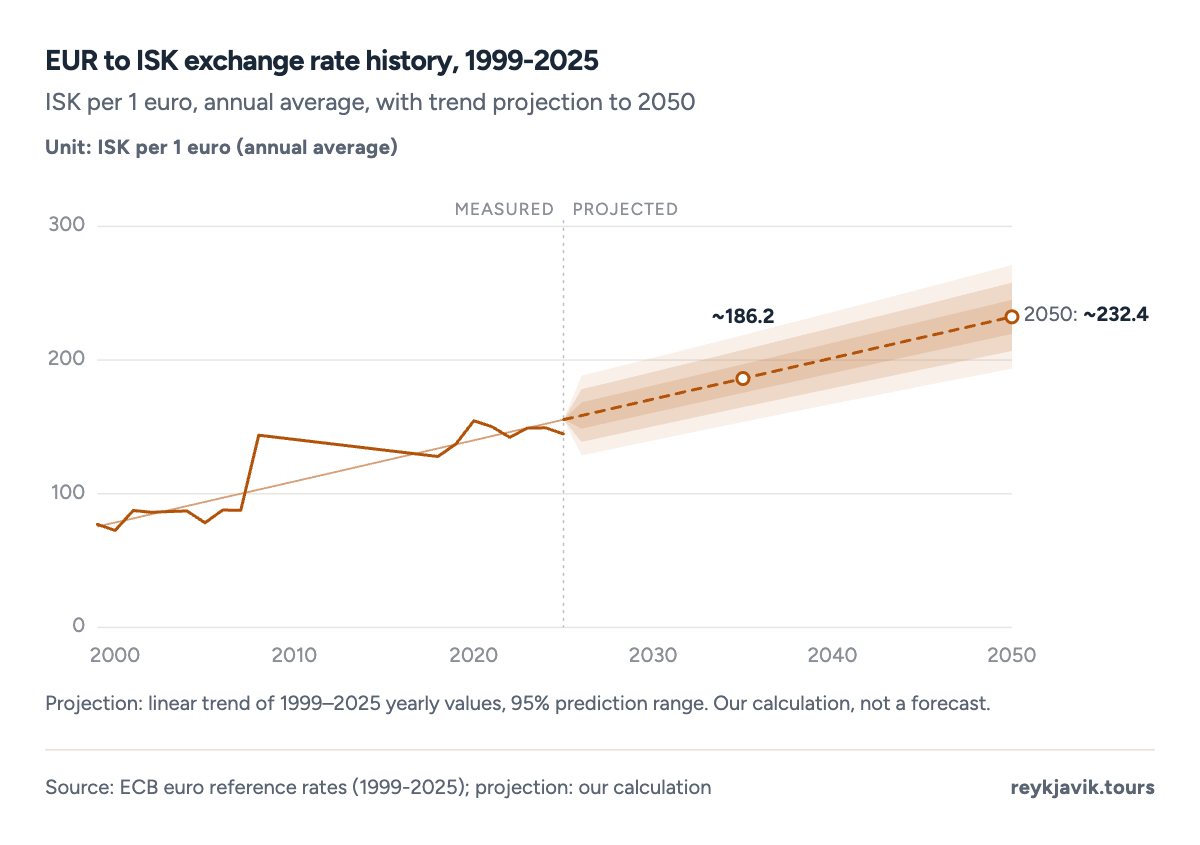
- The euro traded at 77.2 ISK in 1999 and 144.7 ISK in 2025 - an 87% weakening.
- The 2008 jump from 103 to 144 ISK per euro marks the krona's crash year.
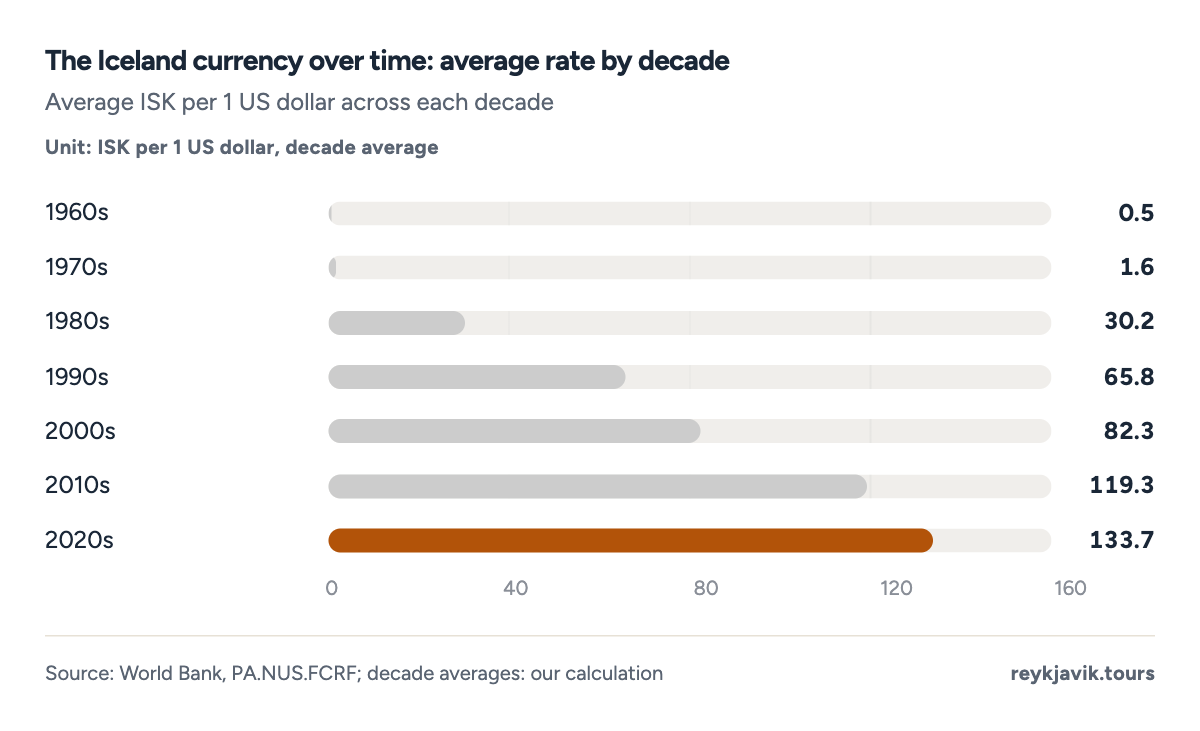
- The 1960s average of 0.5 ISK per dollar belongs to the pre-decimal, fixed-rate krona.
- The 2020s average of 133.7 ISK per dollar is the krona's weakest decade yet.
| 1960 | 0.36 |
| 1970 | 0.88 |
| 1980 | 4.8 |
| 1990 | 58.28 |
| 2000 | 78.62 |
| 2001 | 97.42 |
| 2008 | 87.95 |
| 2009 | 123.64 |
| 2010 | 122.24 |
| 2015 | 131.92 |
| 2019 | 122.61 |
| 2022 | 135.28 |
| 2023 | 137.94 |
| 2024 | 137.96 |
| 2025 | 128.44 |
| 1960s | 0.5 |
| 1970s | 1.6 |
| 1980s | 30.2 |
| 1990s | 65.8 |
| 2000s | 82.3 |
| 2010s | 119.3 |
| 2020s | 133.7 |
Iceland krona depreciation 2008 percentage
Iceland krona depreciation 2008 percentage: against the euro, the krona lost almost 50% of its value in the crash - from about 90 ISK per euro at the start of 2008 to trade far above 200 by year-end, with the official defence band of 131 per euro abandoned on 8 October 20085. Against the dollar the yearly averages tell the same story: 64.1 ISK per dollar in 2007, 87.9 in 2008, 123.6 in 2009 - successive drops of 37.2% and 40.6%4. The monthly ECB series below shows the market actually breaking: 91.0 ISK per euro in December 2007, 131.3 in September 2008, then 274.6 in October and 290.0 in December - quotes from an offshore market in which almost nobody could actually transact6.
Three emergency actions followed within seven weeks. The Central Bank let the currency float free after the band was abandoned; the three big banks (Glitnir, Landsbanki and Kaupthing) were seized by the government in the first week of October; and capital controls were imposed on 28 November 2008 under an IMF programme, freezing krona conversion for residents and foreign investors alike5. The controls lasted eight and a half years - the last were lifted on 14 March 2017, an event this page's milestones table records as the krona's return to normal currency status5.
The crash's causes were local leverage, not global contagion alone: Iceland's banks had grown to about ten times national GDP, and when refinancing dried up in October 2008, the currency was the pressure valve. That is why the depreciation was so violent - and why the recovery, once capital flows normalised, the krona traded freely again - though the recovery was nominal, not a return to pre-crash strength: 122.6 ISK per dollar in 2019, nearly double the 2007 average4.
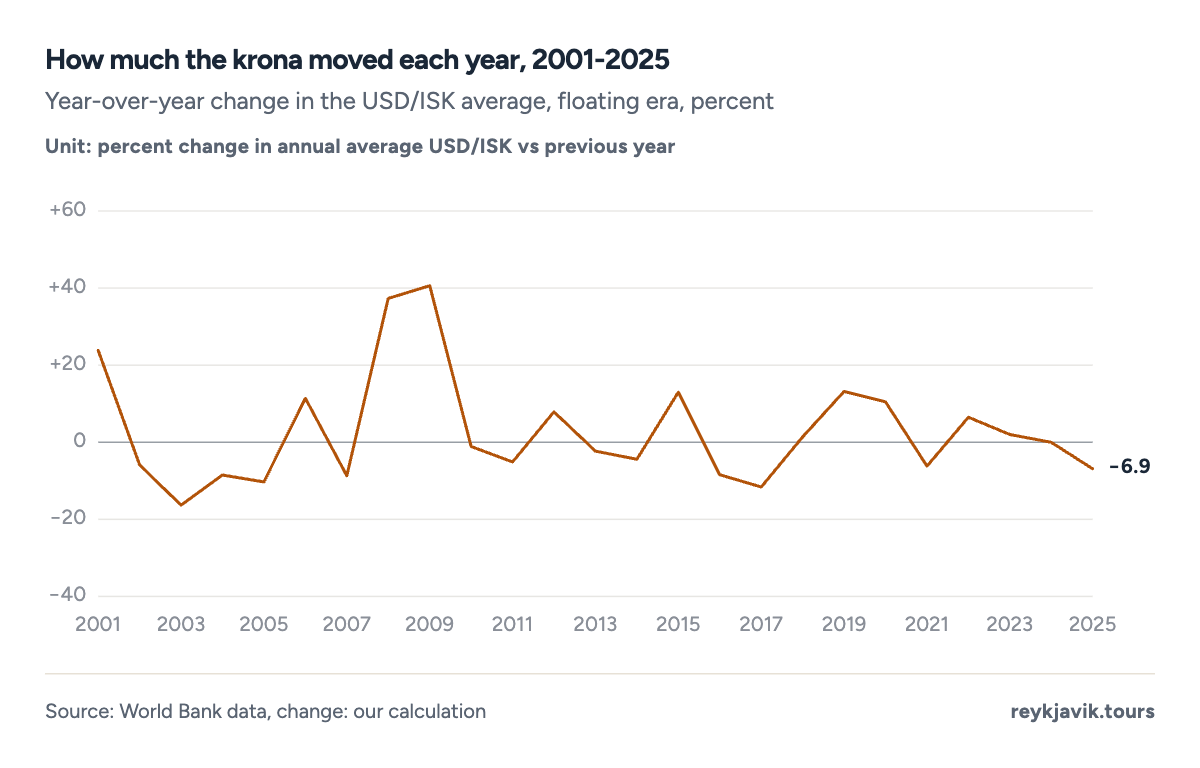
- The krona lost 37.2% of its dollar value in 2008 and another 40.6% in 2009.
- In the floating era the krona's biggest annual gains came in 2010-2011 and 2017.
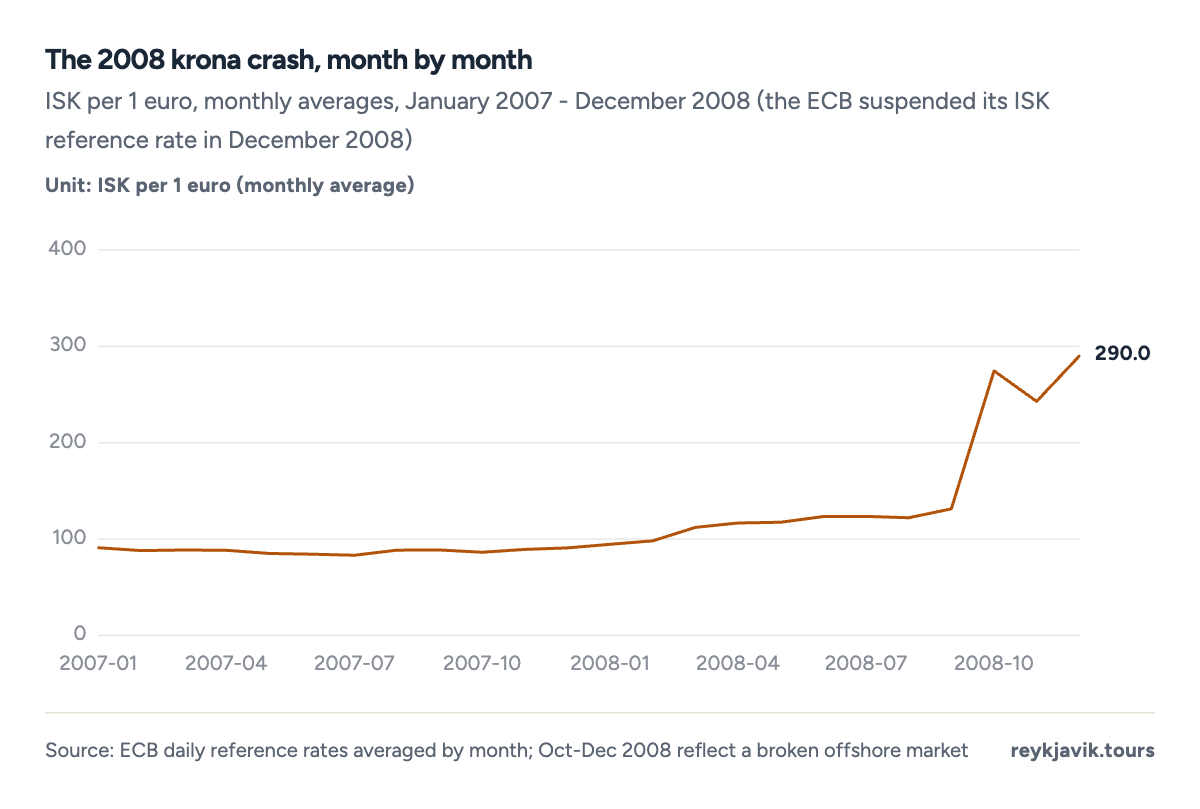
- The krona fell from 91 ISK per euro in December 2007 to 274.6 in October 2008.
- Trading effectively broke down in late 2008: capital controls followed on 28 November.
- The ECB suspended its official ISK reference rate in December 2008 - the last published euro quote was 290.0.
| 2008-09 | 131.3 |
| 2008-10 | 274.6 |
| 2008-11 | 242.9 |
| 2008-12 | 290.0 |
| 1960 | Pre-decimal krona: one dollar buys 0.36 ISK |
| 1971-1974 | Krona pegged to the US dollar, then devalued repeatedly |
| 2001 | Fixed rate abandoned; the krona floats and inflation targeting begins |
| 8 Oct 2008 | The 131/EUR defence band abandoned as the banking system collapses |
| 28 Nov 2008 | Capital controls imposed under an IMF programme |
| 14 Mar 2017 | Capital controls fully lifted; the krona trades freely |
| 2024-2026 | Stabilisation: the rate strengthens from 138 to about 120 ISK per dollar |
Money in a cashless country
About 97.5% of Icelandic payments are electronic - card, app or transfer - and cash in circulation amounts to just 2.3% of GDP, among the lowest figures in the world3. The Central Bank counted 79.8 billion ISK of card turnover in February 2024 alone; for a country of 393,000 people, that is more than 200,000 ISK of card spending per resident every month3. The practical meaning for travellers: the exchange rate you care about is the one your card charges, not the bureaux-de-change board - foreign cash is accepted very rarely outside Keflavik airport, and merchant card surcharges are banned, so the midpoint rate plus your bank's fee (typically up to 3%) is the whole story3.
If you do hold krona notes, the denominations are 500, 1,000, 2,000, 5,000 and 10,000 ISK (the 10,000 note, added in 2013, carries novelist-cum-naturalist imagery and is the one most tourists never see), with 1, 5, 10, 50 and 100 ISK coins below them; the aurar subunit was withdrawn in 20031. The 2,000 ISK note is reportedly being phased out, so do not be surprised if an ATM hands you five 1,000s instead3.
Inflation is the quiet context for every krona figure on this page: prices rose 5.86% in 2024 and 4.09% in 2025, and were still running at 5.6% year-on-year in August 20264. High inflation usually weakens a currency - yet the krona strengthened through 2025-2026, a reminder that interest rates near 8% attract the capital flows that support an exchange rate even while prices climb at home2.
- Electronic (card / app / transfer)97.5%97.5%
- Cash2.5%2.5%
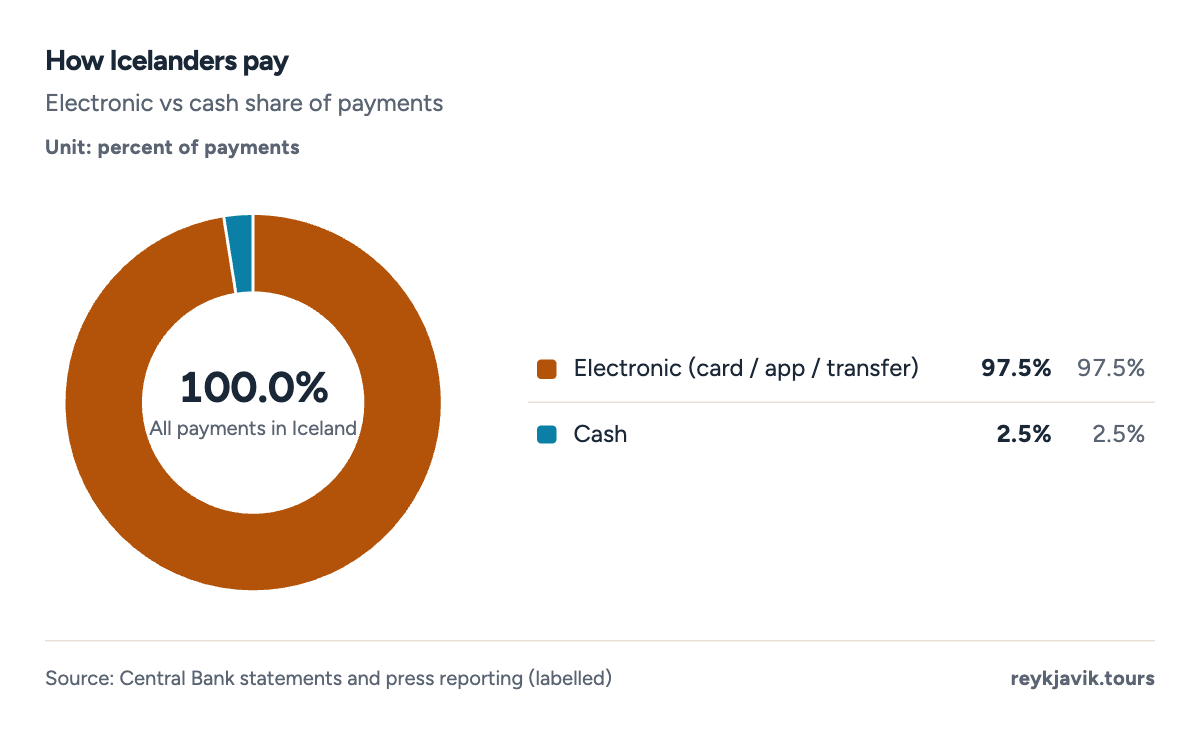
- About 97.5% of Icelandic payments are electronic - one of the most cashless economies on Earth.
- Cash survives mainly for children's allowances and the occasional rural hot-dog stand.
| Share of electronic payments | about 97.5% |
| Cash in circulation vs GDP | 2.3%, among the world's lowest |
| Merchant card surcharges | none - card price equals cash price |
| Foreign card FX fee | up to about 3% (charged by your own bank) |
| Foreign cash acceptance | very rare outside Keflavik airport |
| Card turnover in a single month | ISK 79.8 billion (February 2024) |
| Banknote | 500 |
| Banknote | 1,000 |
| Banknote | 2,000 |
| Banknote | 5,000 |
| Banknote | 10,000 |
| Coin | 1 |
| Coin | 5 |
| Coin | 10 |
| Coin | 50 |
| Coin | 100 |
| 2024 | 5.86 |
| 2025 | 4.09 |
| Aug 2026 (y/y) | 5.6 |
How much krona to take to Iceland?
The honest answer, based on how the country actually pays: none - bring the card, let the ATM give you krona if you truly need notes, and skip currency exchange entirely3. Iceland runs on cards to a degree that surprises even other Europeans: 97.5% of payments are electronic, every hot-dog stand and highland hut takes chip or tap, and your own bank's fee (up to about 3%) will almost always beat any pre-travel exchange you can find at home3.
A sensible cash ceiling for a week outside Reykjavik is 10,000-20,000 ISK (about $83-166) - folded into a wallet pocket for the one farm-honour-system coffee jar you may meet on the ring road2. If you arrive with leftover foreign cash, Keflavik airport's bureaux will take it; anywhere else, plan on cards. And do not bother ordering krona from your home bank before departure: the spread on pre-ordered Icelandic krona abroad is notoriously wide, because the currency trades so little overseas that banks stock it reluctantly3.
Budget in ISK and think in your own currency only for the big lines: at the September 2026 midpoints, 12,000 ISK is a $100 day, and a family of four eating one restaurant meal plus self-catering otherwise runs about 25,000-30,000 ISK - $208-250 - per day1.
Two last practicalities. Converting leftover krona back home costs you the spread a second time, so spend down toward the coins before departure - the 100 ISK piece is the one you will actually use2. And check your card's foreign-transaction fee before flying rather than after: at the September 2026 rate, the gap between a 0% and a 3% card across a 300,000 ISK trip is about $751.
Conclusions
- The Iceland rate of exchange on 16 September 2026 stands at 120.43 ISK per dollar, 139.60 per euro and 162.68 per pound - the krona's strongest level in about seven years1.
- Over 65 years the dollar has climbed from 0.36 ISK in 1960 to a 128.4 average in 2025, with the single violent break in 2008-2009 accounting for most of the move4.
- The 2008 depreciation reached almost 50% against the euro and forced eight and a half years of capital controls, lifted only on 14 March 20175.
- The floating era since 2001 has settled into a 110-140 ISK per dollar plateau, and the trend projection's continued mild weakening is inflation arithmetic, not doom - Icelandic prices rose 5.86% in 2024 alone4.
- For travellers the rate has become nearly irrelevant to daily costs: with 97.5% of payments electronic and no merchant surcharges, the krona you spend is the midpoint plus your bank's fee - cash is optional everywhere outside Keflavik airport3.
Methodology
- USD/ISK annual averages: 1960-2025 (World Bank PA.NUS.FCRF)
- EUR/ISK annual averages: 1999-2025; daily rates 2007-2009 (ECB reference rates)
- Current midpoints: Central Bank of Iceland, 16 September 2026
Definition. The exchange rate is quoted as ISK per 1 unit of foreign currency, so a rising line means a weaker krona. 'Annual average' is the mean of official daily or business-day rates across the year. The October-December 2008 ECB reference rates reflect an offshore market operating under extreme stress; capital controls were in force from 28 November 2008.
Data sources. World Bank Open Data (PA.NUS.FCRF, Iceland, 1960-2025); European Central Bank euro foreign exchange reference rates (annual and daily, 1999-2025); Central Bank of Iceland official midpoints and payment statistics; Icelandic tax authorities' yearly average rates; SUERF and academic literature on the 2008 crisis; press reporting on payment behaviour (labelled).
Calculations. Monthly averages for 2007-2009 are computed from ECB daily reference rates. Decade averages and year-over-year percentage changes are our calculations from the World Bank series. Conversions use the 16 September 2026 Central Bank midpoints, rounded; cheat-sheet rows are rounded to the nearest krona. The projection is an ordinary least-squares trend with a 95% prediction interval, computed by the renderer; our calculation, not a forecast.
Limitations. Pre-1981 krona amounts refer to the old krona before the 1981 revaluation (1 new ISK = 100 old ISK), which World Bank series account for but travellers should not confuse with today's prices. The exact USD-side depreciation in 2008 depends on intra-day extremes not captured by annual averages. Payment shares and fee levels come from labelled secondary sources; Icelandic ATM operator fees vary by machine owner. The 2,000 ISK note's phase-out is reported by media but not confirmed by a Central Bank withdrawal date.
Sources
- Central Bank of Iceland. “Official exchange rate midpoints (16 September 2026).” Central Bank of Iceland (Sedlabanki), 2026. sedlabanki.is. Accessed 2026-09-16. Back to text
- Reykjavik Tours. “Own calculations (labelled).” own calculation, 2026. reykjavik.tours. Accessed 2026-09-17. Back to text
- Icelandic and international media. “Cash usage, card fees, payment behaviour reporting (labelled).” various (Rapyd, Iceland Magazine, Central Bank statements), 2026. rapyd.net. Accessed 2026-09-16. Back to text
- World Bank. “Official exchange rate, LCU per US$, period average (PA.NUS.FCRF), Iceland 1960-2025.” World Bank Open Data, 2026. data.worldbank.org. Accessed 2026-09-17. Back to text
- SUERF / academic literature. “The 2008 krona collapse: depreciation and capital controls (scientific).” The European Money and Finance Forum; peer-reviewed summaries, 2020. suerf.org. Accessed 2026-09-16. Back to text
- European Central Bank. “Euro foreign exchange reference rates, ISK (daily and annual).” European Central Bank, 2026. ecb.europa.eu. Accessed 2026-09-17. Back to text
- Icelandic Revenue (Skatturinn) / Internal Revenue. “Official yearly average USD/ISK exchange rates for tax purposes.” Icelandic tax authorities via skatturinn.is, 2026. skatturinn.is. Accessed 2026-09-16. Back to text
About the author
Laufey turns public statistics on tourism and travel into research people can check and cite.
Every figure on this page links to its source. How we research
Related research
More data on Iceland's weather and travel from Reykjavik Tours.
- HousingAverage Rent in Iceland (2026 Data)ISK 269k average monthly rent in IcelandRead the research →
- HousingHow Much Is a House in Iceland? (2026 Data)$467k-779k typical capital-region apartmentRead the research →
- SafetyCrime Rate of Iceland (2026 Data)2,182 recorded offences per 100,000 people (crime rate of Iceland)Read the research →
- TransportHow Many Airports in Iceland? (2026 Data)33 airports in IcelandRead the research →
- Travel costsHow Much Are Hotels in Iceland? (2026 Data)$196 a night for a typical hotel roomRead the research →
- Travel planningHow Many Miles Is the Ring Road in Iceland? (2026 Data)822 mi the Ring Road around IcelandRead the research →