Iceland Weather by Month (2026 Data)
Temperature, rain, wind, daylight and crowds in every month of the year, around the country and in Reykjavík, with the pros and cons of each month.
- Published
- Updated
- 5 sources
- 94 statistics
- 9 min read

- M.Sc. in Atmospheric Sciences, University of Iceland (Háskóli Íslands), with a minor thesis on North Atlantic storm-track variability
- Former research assistant at the Icelandic Meteorological Office (Veðurstofa Íslands), working on subarctic climate modeling and volcanic-ash dispersion forecasting
- B.A. in Sociology, also from the University of Iceland, with fieldwork on rural depopulation and tourism's impact on small fishing communities (Westfjords focus)
- Grew up in Akureyri, spent seven years living in Reykjavík and two in a small village in the Westfjords - brings first-hand experience of Iceland's regional weather extremes and community life
- Fluent in Icelandic and English; has translated Icelandic Met Office public advisories for international outlets
- Published field notes and data-driven pieces on glacier retreat (Vatnajökull), aurora forecasting, and the socioeconomic effects of overtourism in the Golden Circle

- M.A. in Journalism, University of Iceland, with additional coursework in Environmental Communication at the University of Bergen (Norway), giving a comparative Nordic lens
- 12+ years in Icelandic media, including editorial roles at RÚV (Iceland's national broadcaster) covering weather-related public safety reporting (storms, volcanic eruptions, road closures)
- Former fact-checking lead for a travel-and-culture desk, specializing in verifying tourism statistics, safety advisories, and climate data against primary sources (Vedur.is, Statistics Iceland)
- Has overseen editorial standards for bilingual (Icelandic/English) publications, ensuring both cultural nuance and accuracy for international readers
- Advocate for citing primary sources (Icelandic Met Office, Icelandic Tourist Board / Ferðamálastofa) rather than secondhand reporting
Key findings
- 31–51 °FIceland's weather by month runs from 31–51 °F, with the most rain in September and the least in June.
- 4.5 inchesSeptember is Iceland's wettest month, with 4.5 inches (114 mm) of rain on average.
- 21 hoursReykjavík gets 21 hours of daylight at midsummer and about 4 hours at midwinter.
- 41 inchesIceland averages 41 inches (1,042 mm) of rain and snow a year.
- 13.7 mphWind in Iceland averages 13.7 mph in January, half again as strong as in July.
- 312,964Foreign visitors to Iceland peak in August at 312,964, more than 2.5 times December's 120,016.
- 99 inchesVík í Mýrdal is Iceland's wettest weather station, with 99 inches (2,513 mm) of rain a year.
In Iceland, the month on the calendar changes almost everything about a trip. Reykjavík has about 21 hours1 of daylight in the middle of June and barely 4 hours1 in late December. January winds average 13.7 mph2 (6.1 m/s), half again as strong as July's, and the coldest and warmest months are 20 °F2 apart.
Some of the pattern is surprising. The driest month is June, but the wettest is not in deep winter: it is September, with 4.5 inches2 of rain. Visitors do not follow the best weather either: August brings 2.6 times3 as many foreign visitors as December. This report uses three decades of Icelandic Met Office measurements and official visitor counts to show what every month is really like, around the country and in Reykjavík, and what each one is best for.
The year at a glance
Averaged across 30 Met Office weather stations for 1991–2020, the year has a simple shape. Temperatures sit near freezing from December to March, rise quickly through April and May, and peak in July at 51 °F2 (10.5 °C). Rain does the opposite of what many expect: it is lowest in early summer and highest in September and October. Wind is strongest in winter and weakest in July and August, and daylight swings by about 17 hours between the solstices.
- Average high
- Mean
- Average low
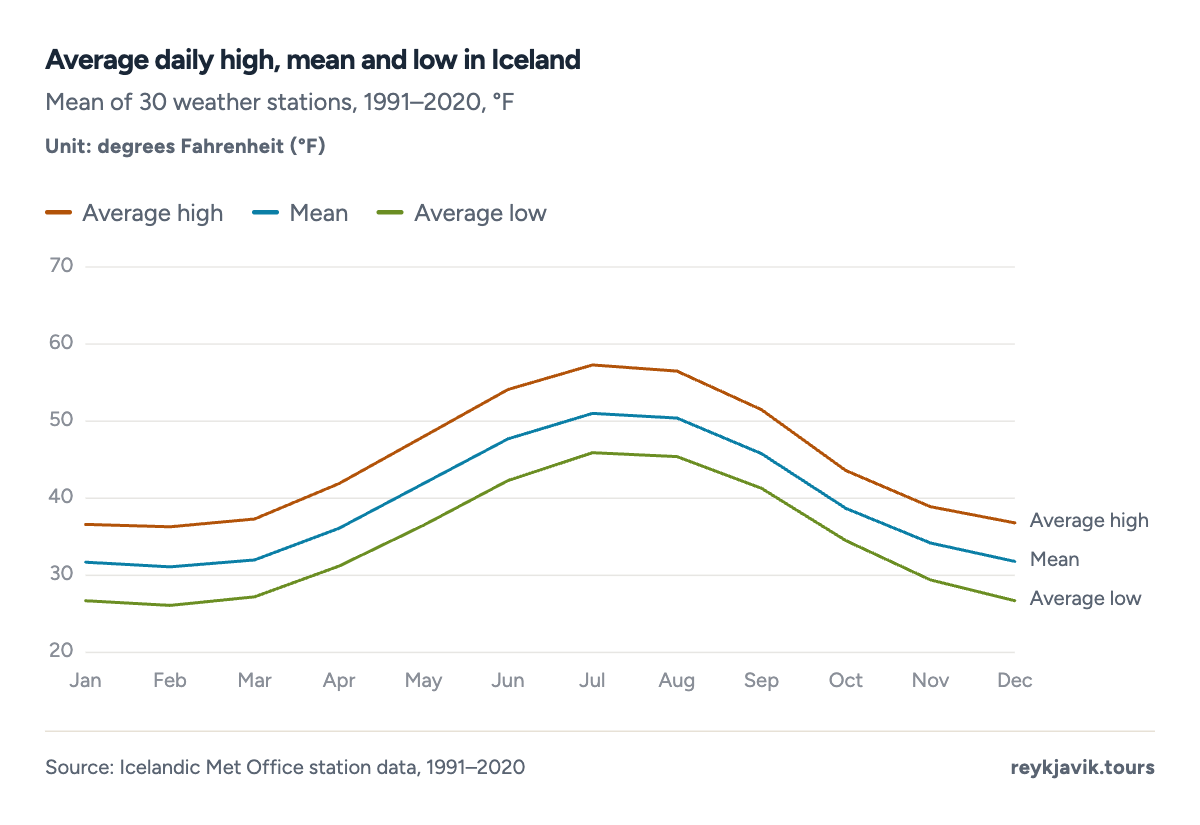
- July's average high is 57.3 °F.
- February's average low is 26.1 °F.
| January | 32 | −0.1 | 3.9 | 98 | 13.7 | 5.3 |
| February | 31 | −0.5 | 3.5 | 90 | 13.6 | 8.5 |
| March | 32 | 0.0 | 3.4 | 87 | 13.2 | 11.6 |
| April | 36 | 2.3 | 2.5 | 65 | 11.9 | 15.0 |
| May | 42 | 5.5 | 2.5 | 63 | 11.0 | 18.3 |
| June | 48 | 8.7 | 2.1 | 54 | 10.0 | 21.0 |
| July | 51 | 10.5 | 2.7 | 68 | 9.1 | 19.8 |
| August | 50 | 10.2 | 3.3 | 85 | 9.1 | 16.6 |
| September | 46 | 7.6 | 4.5 | 114 | 11.0 | 13.2 |
| October | 39 | 3.7 | 4.4 | 112 | 11.6 | 10.0 |
| November | 34 | 1.2 | 4.1 | 103 | 12.4 | 6.6 |
| December | 32 | −0.1 | 4.1 | 103 | 13.0 | 4.3 |
Average weather in Iceland
Over the whole year, the stations average 39 °F2 (4.1 °C) and receive 41 inches2 (1,042 mm) of rain and snow. The sky is about three-quarters cloudy in every month, averaging 6.1 oktas2 out of 8, so clear days are the exception at any time of year. Wind averages between 9.1 mph2 in late summer and 13.7 mph2 in January.
These are figures for the places where weather stations stand, mostly towns and farms near the coast. The highlands are colder, windier and often wetter, and a single region can differ sharply from the national average, as the rain figures below show.
Month by month
January in Iceland
January averages 32 °F2 (−0.1 °C) with 3.9 inches2 of rain and snow and the strongest winds of the year, 13.7 mph2. Afternoons average 37 °F2 and nights fall to 27 °F2 on average. Reykjavík gets about 5.3 hours1 of daylight by mid-month, and 121,5903 foreign visitors came in January 2025.
Average weather in Iceland in February
February averages 31 °F2 (−0.5 °C), with 3.5 inches2 (90 mm) of precipitation, wind of 13.6 mph2 and about 8.5 hours1 of daylight in Reykjavík. Afternoons average 36 °F2 and nights fall to 26 °F2 on average. Days lengthen fast, from about 8 hours of light in mid-February.
Average weather in Iceland in March
March averages 32 °F2 (0.0 °C), with 3.4 inches2 (87 mm) of precipitation, wind of 13.2 mph2 and about 11.6 hours1 of daylight in Reykjavík. Afternoons average 37 °F2 and nights fall to 27 °F2 on average. Still winter by the Met Office's definition, but daylight passes 11 hours.
Average weather in Iceland in April
April averages 36 °F2 (2.3 °C), with 2.5 inches2 (65 mm) of precipitation, wind of 11.9 mph2 and about 15.0 hours1 of daylight in Reykjavík. Afternoons average 42 °F2 and nights fall to 31 °F2 on average. Precipitation falls by about a quarter from March and the light is back.
Average weather in Iceland in May
May averages 42 °F2 (5.5 °C), with 2.5 inches2 (63 mm) of precipitation, wind of 11.0 mph2 and about 18.3 hours1 of daylight in Reykjavík. Afternoons average 48 °F2 and nights fall to 37 °F2 on average. Among the driest months, with over 18 hours of daylight.
Average weather in Iceland in June
June averages 48 °F2 (8.7 °C), with 2.1 inches2 (54 mm) of precipitation, wind of 10.0 mph2 and about 21.0 hours1 of daylight in Reykjavík. Afternoons average 54 °F2 and nights fall to 42 °F2 on average. The driest month of the year and the longest days.
Average weather in Iceland in July
July averages 51 °F2 (10.5 °C), with 2.7 inches2 (68 mm) of precipitation, wind of 9.1 mph2 and about 19.8 hours1 of daylight in Reykjavík. Afternoons average 57 °F2 and nights fall to 46 °F2 on average. The warmest month, with light winds and the summer crowds.
Average weather in Iceland in August
August averages 50 °F2 (10.2 °C), with 3.3 inches2 (85 mm) of precipitation, wind of 9.1 mph2 and about 16.6 hours1 of daylight in Reykjavík. Afternoons average 57 °F2 and nights fall to 45 °F2 on average. Almost as warm as July and the busiest month for visitors.
Average weather in Iceland in September
September averages 46 °F2 (7.6 °C), with 4.5 inches2 (114 mm) of precipitation, wind of 11.0 mph2 and about 13.2 hours1 of daylight in Reykjavík. Afternoons average 51 °F2 and nights fall to 41 °F2 on average. The wettest month, but crowds fall by more than a quarter from August.
Average weather in Iceland in October
October averages 39 °F2 (3.7 °C), with 4.4 inches2 (112 mm) of precipitation, wind of 11.6 mph2 and about 10.0 hours1 of daylight in Reykjavík. Afternoons average 44 °F2 and nights fall to 35 °F2 on average. Nearly as wet as September, with about 10 hours of daylight.
Average weather in Iceland in November
November averages 34 °F2 (1.2 °C), with 4.1 inches2 (103 mm) of precipitation, wind of 12.4 mph2 and about 6.6 hours1 of daylight in Reykjavík. Afternoons average 39 °F2 and nights fall to 29 °F2 on average. Wind rises again while the days shrink below 7 hours.
Average weather in Iceland in December
December averages 32 °F2 (−0.1 °C), with 4.1 inches2 (103 mm) of precipitation, wind of 13.0 mph2 and about 4.3 hours1 of daylight in Reykjavík. Afternoons average 37 °F2 and nights fall to 27 °F2 on average. The shortest days of the year and the fewest visitors.
Rain in Iceland does not follow the cold.
Rain and snow by month
Precipitation, rain and snow together, is lowest in June at 2.1 inches2 (54 mm) and highest in September at 4.5 inches2, followed closely by October. From September to January every month brings about 4 inches or more, while April to July stay between 2 and 3 inches.
Where you are matters even more than when. The south coast is by far the wettest part of the country: Vík í Mýrdal records 99 inches2 (2,513 mm) a year. The inland northeast is the driest; Grímsstaðir á Fjöllum gets only 15 inches2, about a sixth as much.
- 3.9JanJ
- 3.5FebF
- 3.4MarM
- 2.5AprA
- 2.5MayM
- 2.1JunJ
- 2.7JulJ
- 3.3AugA
- 4.5SepS
- 4.4OctO
- 4.1NovN
- 4.1DecD
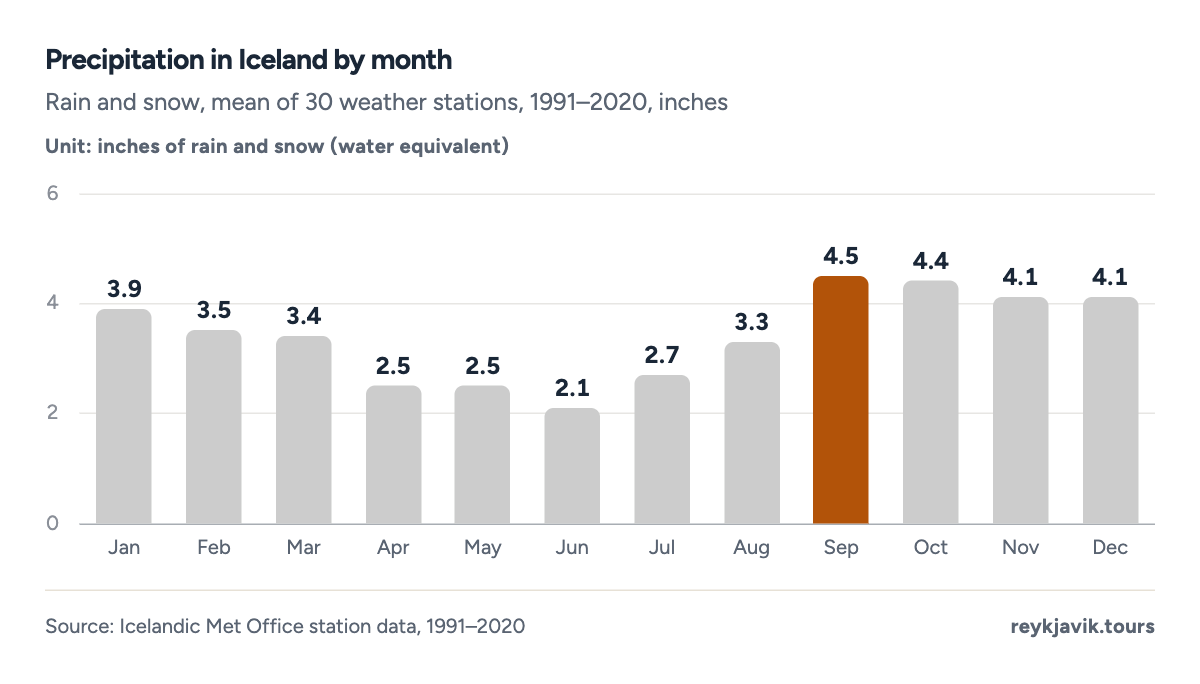
- September is the wettest month at 4.5 in.
- June is the driest at 2.1 in.
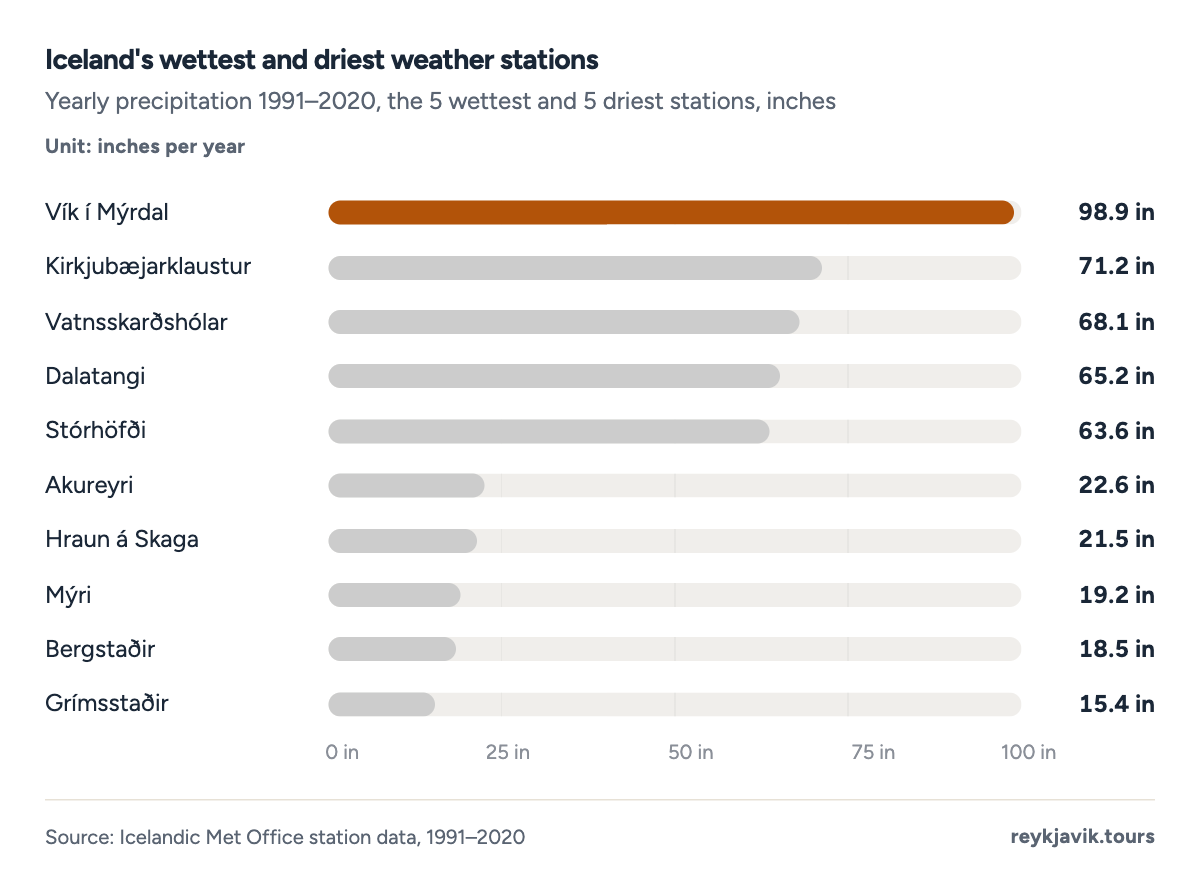
- Vík í Mýrdal gets 98.9 in a year.
- Grímsstaðir gets 15.4 in.
| 1 | Vík í Mýrdal | 98.9 | 2,513 |
| 2 | Kirkjubæjarklaustur | 71.2 | 1,809 |
| 3 | Vatnsskarðshólar | 68.1 | 1,731 |
| 4 | Dalatangi | 65.2 | 1,656 |
| 5 | Stórhöfði | 63.6 | 1,615 |
| 6 | Bláfeldur | 60.9 | 1,546 |
| 7 | Eyrarbakki | 57.6 | 1,464 |
| 8 | Hjarðarland | 52.6 | 1,336 |
| 9 | Hólar í Dýrafirði | 50.0 | 1,270 |
| 10 | Skjaldþingsstaðir | 48.3 | 1,226 |
| 11 | Hæll | 43.9 | 1,115 |
| 12 | Keflavíkurflugvöllur | 43.5 | 1,104 |
| 13 | Lambavatn | 37.4 | 951 |
| 14 | Sauðanesviti | 34.8 | 885 |
| 15 | Reykjavík | 34.5 | 876 |
| 16 | Bolungarvík | 34.3 | 871 |
| 17 | Litla-Ávík | 34.3 | 870 |
| 18 | Svínafell | 33.4 | 849 |
| 19 | Ásgarður | 32.8 | 833 |
| 20 | Lerkihlíð | 32.4 | 824 |
| 21 | Stafholtsey | 32.0 | 812 |
| 22 | Stykkishólmur | 29.1 | 738 |
| 23 | Staðarhóll | 25.3 | 643 |
| 24 | Miðfjarðarnes | 25.1 | 638 |
| 25 | Mánárbakki | 24.7 | 627 |
| 26 | Akureyri | 22.6 | 574 |
| 27 | Hraun á Skaga | 21.5 | 547 |
| 28 | Mýri | 19.2 | 488 |
| 29 | Bergstaðir | 18.5 | 470 |
| 30 | Grímsstaðir | 15.4 | 390 |
Iceland seasons by month
The Icelandic Met Office groups the months into four seasons of unequal length. In its yearly climate summaries, summer runs from June to September, winter from December to March, and autumn covers October and November,4 which leaves April and May as spring.
Measured that way, winter brings the most precipitation, 14.9 inches2 over its four months, and summer 12.7 inches2. Two-month autumn delivers 8.5 inches2, far more per month than two-month spring at 5.0 inches2.
- Winter (Dec–Mar)14.936.3%
- Summer (Jun–Sep)12.730.9%
- Autumn (Oct–Nov)8.520.7%
- Spring (Apr–May)5.012.2%
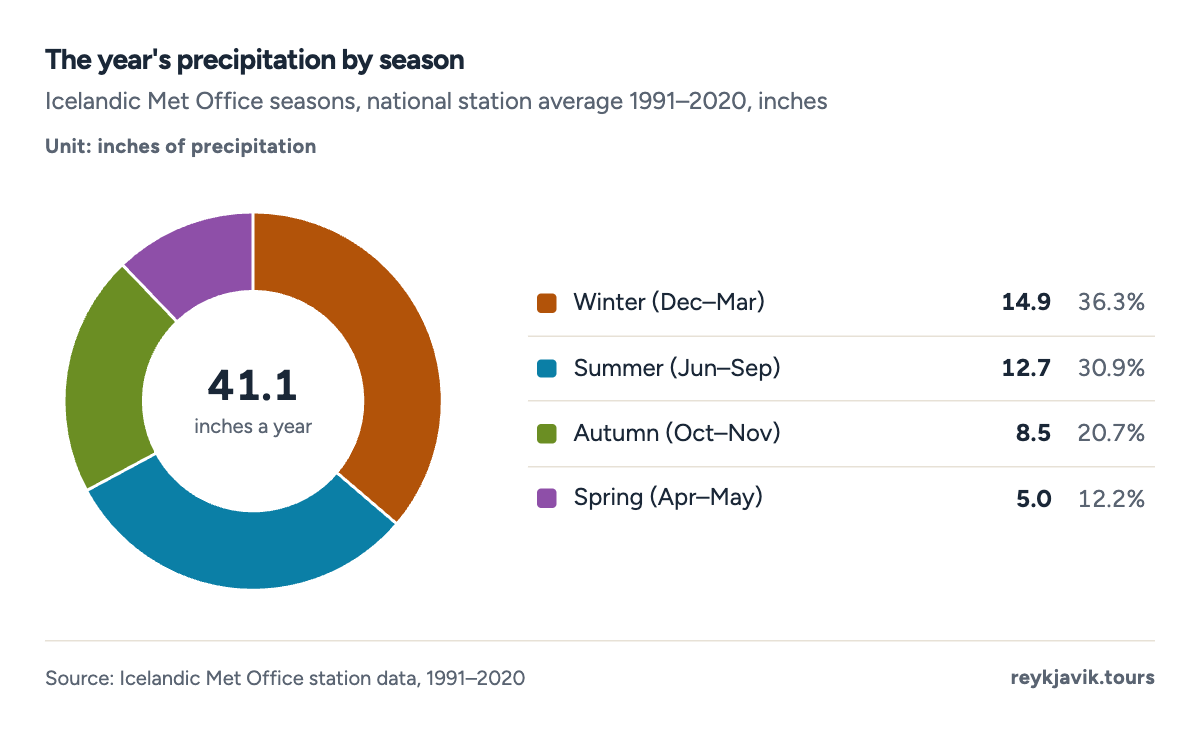
- Winter, December to March, brings 14.9 inches.
- Spring, April and May, brings 5.0 inches.
How many seasons does Iceland have
Iceland has four seasons in the Met Office's reckoning, but two of them are short. Summer and winter each last four months, while spring and autumn get two months each. In practice, the long light of the summer months and the long dark of the winter months shape a visit far more than the brief seasons in between.
Daylight and sunshine
Daylight changes more than any other part of Iceland's weather. In Reykjavík the sun is up for about 21 hours1 on 21 June and about 4 hours1 on 21 December. Around the equinoxes in late March and late September, day and night are close to equal.
Daylight is not the same as sunshine. Only two stations in the network measure sunshine hours, and the numbers show how cloudy Iceland is. Reykjavík records 209 hours2 of sunshine in May, its sunniest month, which is under 7 hours a day out of more than 18 hours of daylight. In December it records just 13 hours2 for the whole month. Akureyri in the north gets almost no direct sun in December at all: 0.28 hours2.
- Daylight
- Sunshine
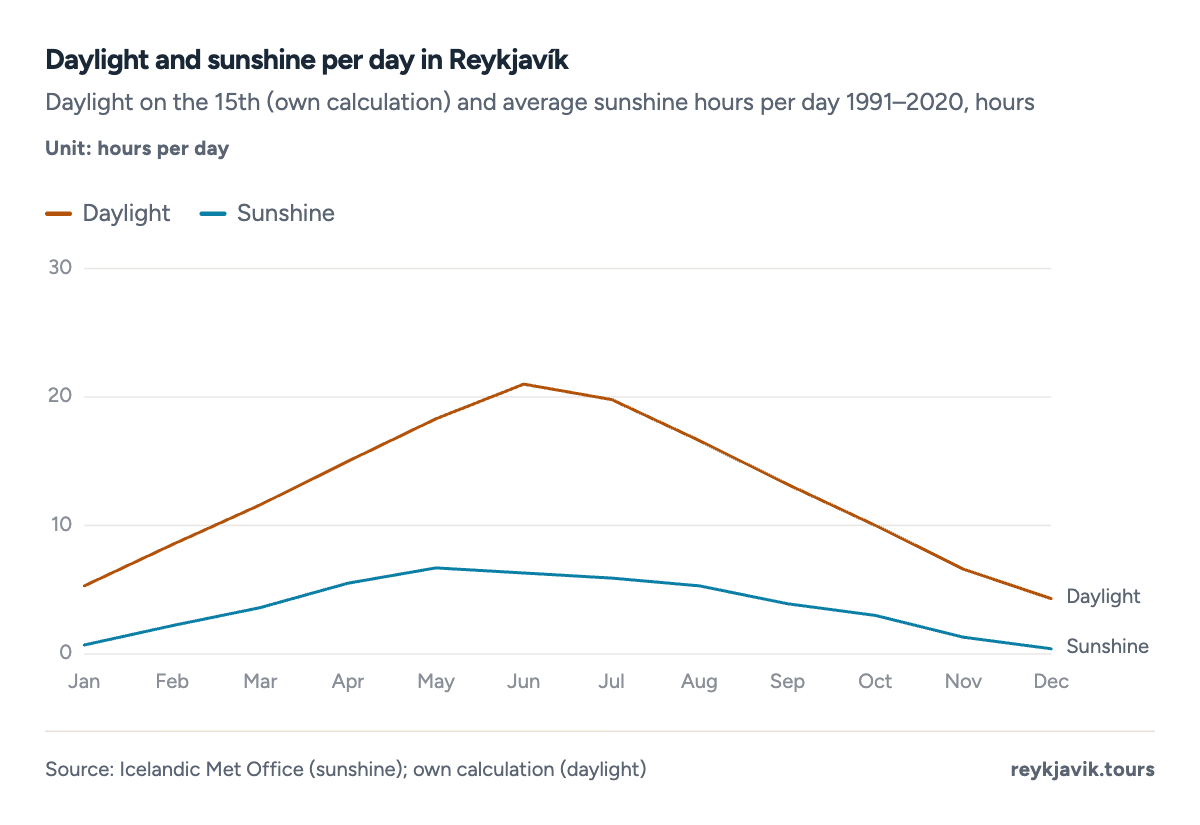
- Daylight peaks at 21.0 h in mid-June.
- Sunshine peaks at 6.7 h a day in May.
Average humidity in Iceland
Relative humidity stays high all year, between 76%2 and 83%2 at the stations that measure it. It is highest in July and August and lowest in April. Cloud cover barely changes with the seasons.
| January | 79 | 6.2 |
| February | 78 | 6.1 |
| March | 77 | 6.1 |
| April | 76 | 6.0 |
| May | 77 | 6.0 |
| June | 79 | 5.9 |
| July | 82 | 6.2 |
| August | 83 | 6.1 |
| September | 81 | 6.2 |
| October | 80 | 6.2 |
| November | 79 | 6.1 |
| December | 79 | 6.1 |
Wind by month
Wind follows the cold half of the year. January and February average 13.7 mph2 (6.1 m/s) across the stations, while July and August drop to 9.1 mph2. The months with the least daylight are also the windiest.
- 13.7JanJ
- 13.6FebF
- 13.2MarM
- 11.9AprA
- 11.0MayM
- 10.0JunJ
- 9.1JulJ
- 9.1AugA
- 11.0SepS
- 11.6OctO
- 12.4NovN
- 13.0DecD
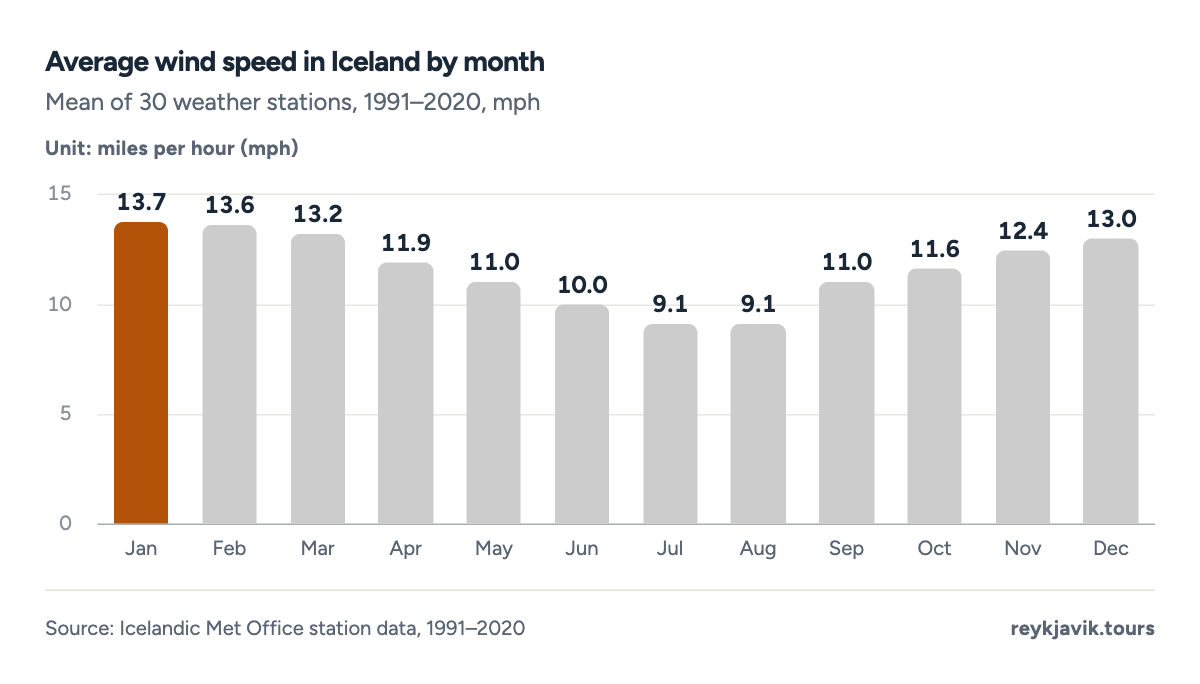
- January averages 13.7 mph.
- July and August average 9.1 mph.
Reykjavik weather by month
The capital is milder and drier than the country as a whole. Winter months in Reykjavík average just above freezing, and the city receives about 34 inches2 (876 mm) of precipitation a year, less than the national station average. It is also sunnier than Akureyri, with 1,368 hours2 of sunshine a year against 1,0512.
| January | 33 | 38 | 29 | 3.4 | 23 | 5.3 |
| February | 33 | 38 | 29 | 3.6 | 62 | 8.5 |
| March | 34 | 40 | 30 | 3.2 | 110 | 11.6 |
| April | 39 | 44 | 34 | 2.3 | 165 | 15.0 |
| May | 44 | 50 | 39 | 2.1 | 209 | 18.3 |
| June | 50 | 55 | 45 | 1.7 | 190 | 21.0 |
| July | 53 | 59 | 48 | 2.0 | 183 | 19.8 |
| August | 52 | 57 | 48 | 2.5 | 165 | 16.6 |
| September | 47 | 53 | 43 | 3.4 | 118 | 13.2 |
| October | 41 | 46 | 37 | 3.1 | 92 | 10.0 |
| November | 36 | 40 | 32 | 3.4 | 40 | 6.6 |
| December | 33 | 38 | 29 | 3.7 | 13 | 4.3 |
Reykjavik average weather
Over the year, Reykjavík averages 41 °F2 (5.1 °C). Its wettest month is December at 3.7 inches2 and its driest June at 1.7 inches2.
Crowds by month
The weather is only half of the choice; the other half is how many people choose the same month. In 2025, 312,9643 foreign visitors left through Keflavík Airport in August, the busiest month, and 302,0573 in July. December was the quietest with 120,0163, and January nearly as quiet. September, the wettest month, still drew 224,1823 visitors, about 28% fewer3 than August.
- 122JanJ
- 149FebF
- 152MarM
- 149AprA
- 160MayM
- 234JunJ
- 302JulJ
- 313AugA
- 224SepS
- 201OctO
- 142NovN
- 120DecD
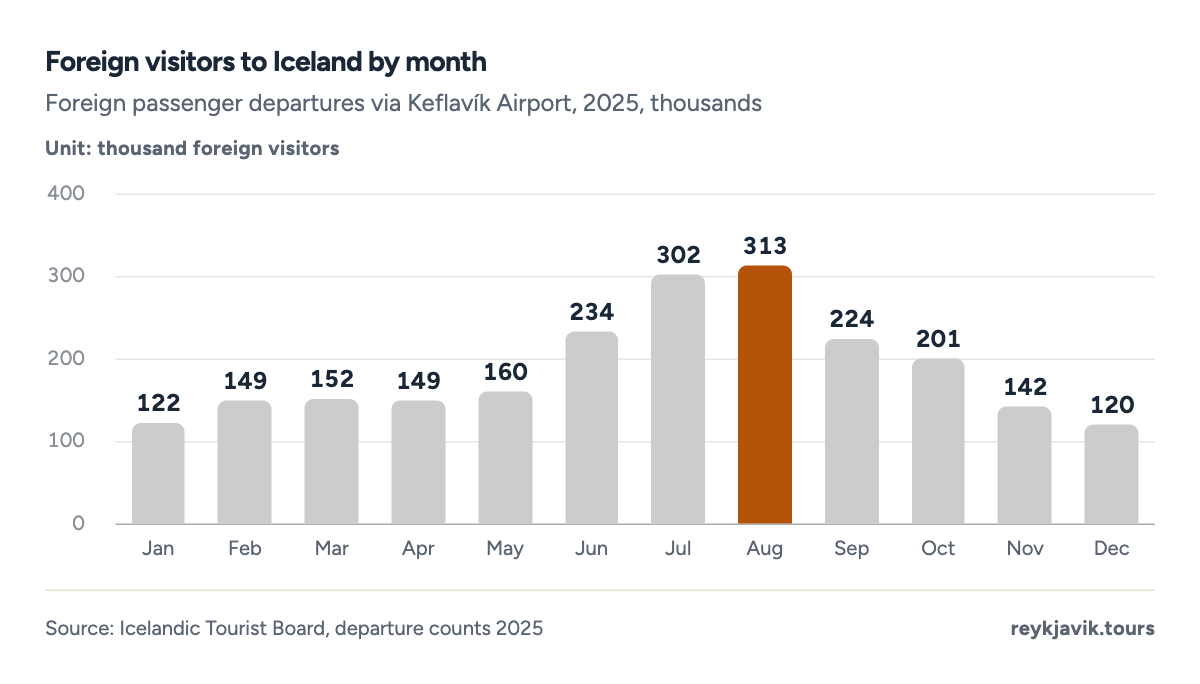
- August was the busiest month with 312,964 visitors.
- December was the quietest with 120,016.
| January | 121,590 |
| February | 148,657 |
| March | 152,485 |
| April | 149,123 |
| May | 159,571 |
| June | 233,802 |
| July | 302,057 |
| August | 312,964 |
| September | 224,182 |
| October | 201,422 |
| November | 141,769 |
| December | 120,016 |
Iceland weather by month pros and cons
No month has everything. The table below weighs each month using only the numbers in this report: temperature, precipitation, wind, daylight and visitor counts.
- Most daylight and least rain: June
- Warmest and calmest: July and August, at the price of the biggest crowds
- Quietest months: December and January, with the shortest days and strongest winds
- Wettest months: September and October
| January | Fewest crowds after December | Windiest month (13.7 mph), about 5.3 h of light |
| February | Low crowds, days lengthening | Coldest month (31 °F) |
| March | Over 11 h of daylight | Still near freezing, 3.4 in of precipitation |
| April | Rain falls to 2.5 in | Nights around freezing |
| May | Among the driest months, 18.3 h of light | Cool, 42 °F on average |
| June | Driest month (2.1 in), longest days | Crowds start to build |
| July | Warmest (51 °F), light winds | Second-busiest month |
| August | Warm (50 °F), light winds | Busiest month of the year |
| September | Crowds 28% below August | Wettest month (4.5 in) |
| October | Fewer visitors than summer | Wet (4.4 in), winds rising |
| November | Quiet month | About 6.6 h of light, wet and windy |
| December | Fewest visitors of the year | Shortest days, about 4.3 h of light |
Is Iceland getting wetter?
Year-to-year precipitation varies a lot. Rebuilt from the stations with long records, the national figure was about 37.7 inches2 in 2023 and 40.3 inches2 in 2024. The chart below fits a straight line to every year since 1949 and draws it forward to 2050, with the wide range that such variable years produce.
The Met Office's climate report expects precipitation to rise as Iceland warms, by at least 1.5%5 for each degree of warming, with the largest increases in late summer and autumn, the months that are already the wettest.
Projection: linear trend of 1949–2025 yearly values, 95% prediction range. Our calculation, not a forecast.
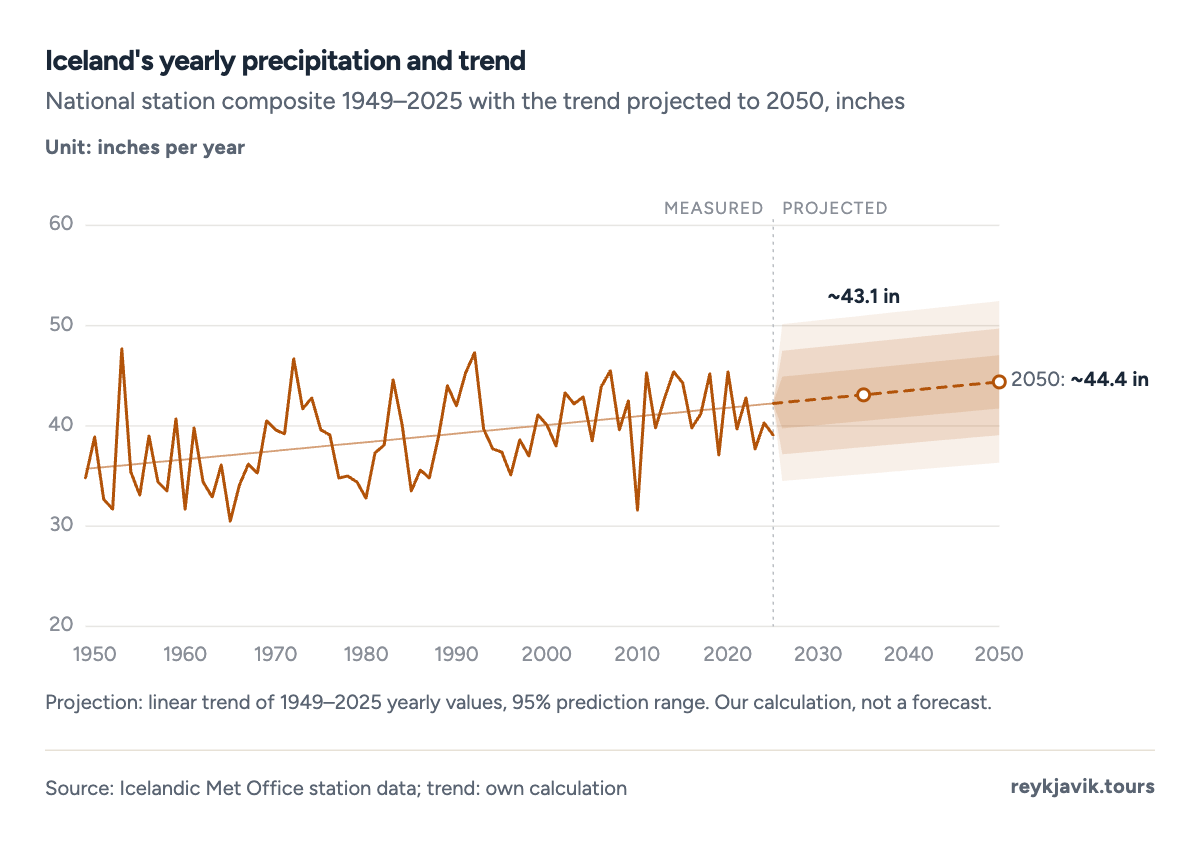
- 2024 brought about 40.3 in.
- 2025 brought about 39.1 in.
What the weather means for a trip
Picking a month in Iceland is a trade between light, rain, wind and crowds. June offers the most daylight and the least rain of any month, before the busiest weeks begin. July and August are the warmest and calmest, but August alone brings more than twice December's visitors.
The quieter months ask for a different plan. From November to January, days of 4 to 7 hours of light and the strongest winds of the year leave little time on the road, so shorter drives and flexible days matter. September and October are the wettest months, yet they keep 10 to 13 hours of daylight and far fewer visitors than August. Wherever and whenever you go, the south coast gets several times the rain of the northeast interior, so the route can matter as much as the date.
Conclusions
- Rain in Iceland peaks in autumn, not in the coldest months. September and October are the wettest, while June is the driest.
- Light changes far more than temperature. Daylight in Reykjavík swings by about 17 hours between the solstices, while the monthly average temperature moves by only 20 °F.
- The best-weather months and the busiest months do not match. June, the driest and lightest month, comes before the August crowd peak, and the calmest winds arrive in July and August.
- Place matters as much as the month. Vík í Mýrdal on the south coast gets about six times the precipitation of Grímsstaðir in the northeast, so two travellers in the same week can have completely different weather.
Methodology
- Period 1991–2020 (rain trend 1949–2025)
- 30 weather stations
- Visitors 2025
- Checked Sept 16, 2026
Definition. Weather here means air temperature, precipitation (rain and snow as water), wind speed, cloud cover, relative humidity and sunshine measured at weather stations, plus daylight (sunrise to sunset). Units: °F, inches and mph, with °C, mm and m/s.
Data sources. Monthly station values from the Icelandic Met Office,2 its season definitions from the annual climate summaries,4 the precipitation outlook from the 2018 report of Iceland's Scientific Committee on Climate Change,5 and foreign visitors by month from the Icelandic Tourist Board's departure counts at Keflavík Airport.3
Calculations. Each month's national figure is the mean of the 1991–2020 averages of 30 stations (humidity: 8 stations; sunshine: Reykjavík and Akureyri only). Seasonal totals add the months of each Met Office season. Daylight is calculated for Reykjavík (64.15° N) on the 15th of each month with NOAA's solar position equations. The yearly precipitation series scales each year's station totals to their 1991–2020 averages; the trend is a least-squares line with a 95% prediction range.
Limitations. Stations are mostly lowland and coastal, so the highlands are colder, windier and wetter than these averages. Sunshine is measured at only two stations. Visitor counts cover departures through Keflavík Airport only. Early years of the precipitation series rest on fewer stations.
Sources
- Reykjavik Tours research. “Day length in Reykjavík by month (NOAA solar position equations, 64.15° N).” Reykjavik Tours. gml.noaa.gov. Accessed 16 Sept. 2026. Back to text
- Veðurstofa Íslands (Icelandic Met Office). “Mánaðargildi veðurstöðva (monthly values for weather stations).” Veðurstofa Íslands. vedur.is. Accessed 16 Sept. 2026. Back to text
- Ferðamálastofa (Icelandic Tourist Board). “Brottfarir erlendra farþega frá Íslandi um Keflavíkurflugvöll 2002–2026 (foreign departures via Keflavík).” Ferðamálastofa. ferdamalastofa.is. Accessed 16 Sept. 2026. Back to text
- Veðurstofa Íslands. “Tíðarfar ársins 2024.” Veðurstofa Íslands, 2025. vedur.is. Accessed 16 Sept. 2026. Back to text
- Vísindanefnd um loftslagsbreytingar (Scientific Committee on Climate Change). “Loftslagsbreytingar og áhrif þeirra á Íslandi (Climate change and its effects in Iceland).” Veðurstofa Íslands, 2018. vedur.is. Accessed 16 Sept. 2026. Back to text
About the author
Laufey turns public statistics on tourism and travel into research people can check and cite.
Every figure on this page links to its source. How we research
Related research
More data on Iceland's weather and travel from Reykjavik Tours.
- WeatherHow Much Snow Does Iceland Get? (2026 Data)55 days a year with snow on the ground in ReykjavíkRead the research →
- WeatherIceland Temperature by Month (2026 Data)39 °F average temperature in IcelandRead the research →
- WeatherAverage Wind Speed in Iceland (2026 Data)5.2 m/s average wind speed in IcelandRead the research →
- WeatherIceland Daylight Hours by Month (2026 Data)21.2 h of daylight in Reykjavík on the longest dayRead the research →
- TravelHow Many Days in Iceland? (2026 Data)7.1 nights average stay of foreign visitorsRead the research →
- Travel planningHow Often Can You See the Northern Lights in Iceland? (2026 Data)~50% chance of aurora on any dark-season nightRead the research →