How Much Snow Does Iceland Get? (2026 Data)
Snow-covered days, snowfall and rainfall for Iceland and Reykjavík by month, by place and by year, with the Icelandic Met Office's own station records.
- Published
- Updated
- 18 sources
- 75 statistics
- 11 min read

- M.Sc. in Atmospheric Sciences, University of Iceland (Háskóli Íslands), with a minor thesis on North Atlantic storm-track variability
- Former research assistant at the Icelandic Meteorological Office (Veðurstofa Íslands), working on subarctic climate modeling and volcanic-ash dispersion forecasting
- B.A. in Sociology, also from the University of Iceland, with fieldwork on rural depopulation and tourism's impact on small fishing communities (Westfjords focus)
- Grew up in Akureyri, spent seven years living in Reykjavík and two in a small village in the Westfjords - brings first-hand experience of Iceland's regional weather extremes and community life
- Fluent in Icelandic and English; has translated Icelandic Met Office public advisories for international outlets
- Published field notes and data-driven pieces on glacier retreat (Vatnajökull), aurora forecasting, and the socioeconomic effects of overtourism in the Golden Circle

- M.A. in Journalism, University of Iceland, with additional coursework in Environmental Communication at the University of Bergen (Norway), giving a comparative Nordic lens
- 12+ years in Icelandic media, including editorial roles at RÚV (Iceland's national broadcaster) covering weather-related public safety reporting (storms, volcanic eruptions, road closures)
- Former fact-checking lead for a travel-and-culture desk, specializing in verifying tourism statistics, safety advisories, and climate data against primary sources (Vedur.is, Statistics Iceland)
- Has overseen editorial standards for bilingual (Icelandic/English) publications, ensuring both cultural nuance and accuracy for international readers
- Advocate for citing primary sources (Icelandic Met Office, Icelandic Tourist Board / Ferðamálastofa) rather than secondhand reporting
Key findings
- 40 inchesReykjavík averages about 40 inches (102 cm) of snow and 55 snow-covered days a year; Akureyri gets about 95.
- 40 cmReykjavík's biggest recent snowstorm dumped 40 cm (15.7 in) of snow in October 2025, breaking a 104-year-old record.
- 17 daysReykjavík logged just 17 days of snow cover in 2021, then 59 the very next year, in 2022.
- 34 inchesReykjavík averages about 34 inches (876 mm) of precipitation a year, far more than Akureyri's 23 inches (574 mm).
- 8Snow lies on the ground in 8 of 12 months at Reykjavík and 9 of 12 at Akureyri.
- 85Icelandic is sometimes said to have as many as 85 words related to snow, though counts vary widely.
- 130 cmIceland's deepest recorded snow was 130 cm (51 in), measured at Skeiðsfossvirkjun in the north in December 2019.
- 20The 1995 Flateyri avalanche killed 20 people, one of two disasters that year that led to Iceland's modern avalanche-warning system.
Iceland's name promises ice, but its capital keeps surprisingly little snow: Reykjavík lies under an unbroken white blanket for only about 55.1 days1 a year, against roughly 154.9 days1 of measurable rain or sleet. Then, on a single night in late October 2025, the city was buried under 40 cm2 (15.7 in) of snow - the deepest October snowfall Reykjavík has ever recorded, more than double the previous mark set in 1921.
How much snow (and rain) Iceland actually gets depends enormously on where and when you land, and on which one of the Icelandic Met Office's own measurements you mean: days with snow on the ground, inches of new snow, or the water that falls as rain and sleet. This report pulls together the Met Office's station normals, its yearly summaries back to 2021 and one Reykjavík station's unbroken record since 1949 to answer how much snow and rain Iceland gets, by month, by place and by year - and what the swings between one winter and the next mean for a trip.
| Snow-covered days / year | 55.1 days | 95.5 days |
| Average snowfall / year (compiled estimate) | 102 cm (40 in) | - |
| Precipitation / year | 876 mm (34.5 in) | 574 mm (22.6 in) |
| Days with precipitation ≥ 1 mm / year | 154.9 days | 108.5 days |
| Months with any average snow cover | 8 of 12 | 9 of 12 |
| 2025 snow-covered days (actual) | 32 days | 81 days |
| Record snow depth (recent) | 40 cm, Oct 2025 | - |
How much snow does Iceland get
The Icelandic Met Office does not publish one national "total snowfall" figure, because Iceland's climate varies too much place to place for a single number to mean much. What it does measure, station by station, is how many days a year snow lies unbroken on the ground - and by that yardstick, Iceland's snow depends heavily on where you are. Reykjavík, on the mild southwest coast, averages 55.1 days1 a year with the ground fully snow-covered. Akureyri, in the colder north, averages 95.5 days3 - almost twice as long a season. Two stations that sit further out on the map go further still: Bergstaðir, an interior-adjacent farm near Sauðárkrókur, averages 98.6 days4 of snow cover a year, and remote Dalatangi on the east coast averages 80 days2.
The average snow cover duration in Iceland is therefore best read as a range rather than one number: from roughly a month and a half on the south coast to well over three months in parts of the north and interior.
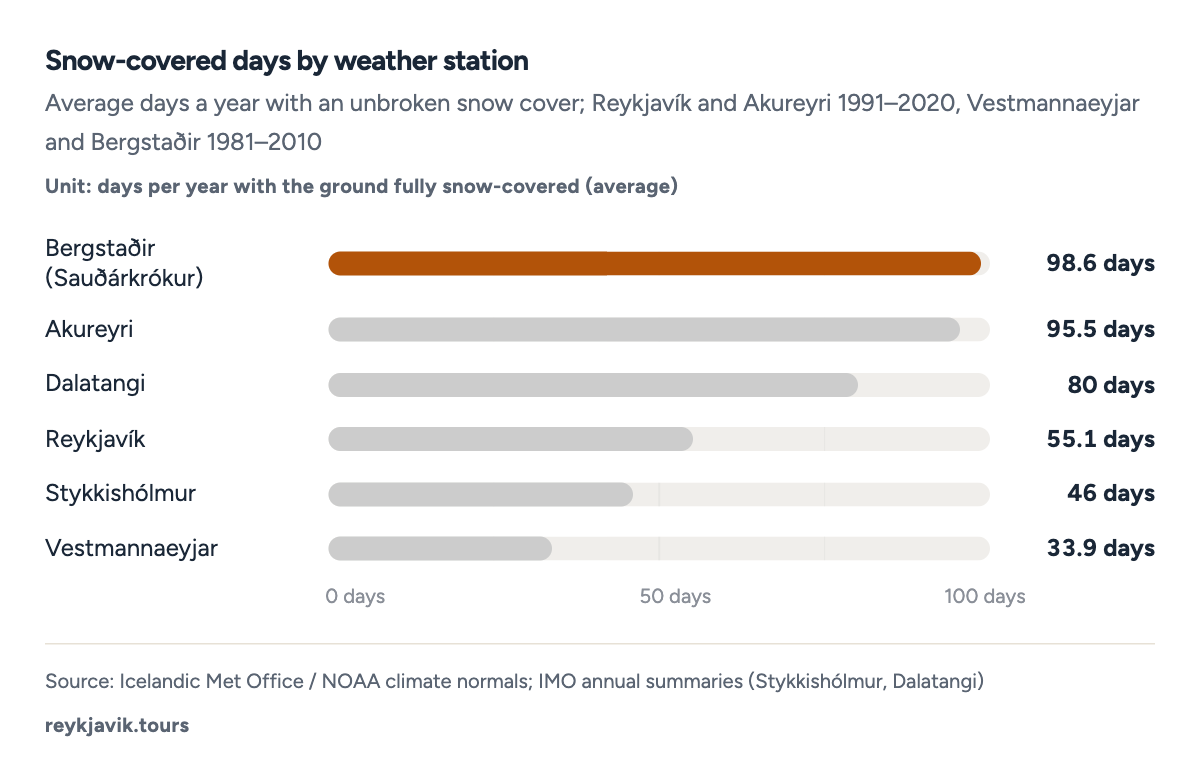
- Bergstaðir averages 98.6 days a year with snow on the ground, the most of the six.
- Reykjavík averages just 55.1 days, the least of the six.
| Reykjavík | 32 | 55.1 | 1991–2020 |
| Stykkishólmur | 26 | 46 | 1991–2020 |
| Akureyri | 81 | 95.5 | 1991–2020 |
| Dalatangi | 67 | 80 | 1991–2020 |
| Vestmannaeyjar | - | 33.9 | 1981–2010 |
| Bergstaðir (Sauðárkrókur) | - | 98.6 | 1981–2010 |
How often does it snow in Iceland
Days with snow *falling* are not quite the same as days with snow *lying on the ground* - a flurry can melt within hours on the mild coast, while inland it settles and stays. By the Met Office's cover measurement, Reykjavík has some snow on the ground roughly one day in seven across the year, rising to close to one day in two through January, February and December. In 20252, a mild year nationally, the capital's cover days fell well below average in every season except January, when an unusually heavy spell of East Iceland snow2 pushed cover days above normal at every station the Met Office tracks.
How many months does Iceland have snow
Snow shows up in the Met Office's records in 8 of 12 months1 at Reykjavík and 9 of 123 at Akureyri - essentially every month except June, July, August and September, when the average is a flat zero at both stations. Even within that snowy stretch the odds shift fast: Reykjavík's snowiest average month is December, while Akureyri's is January, a full two months earlier in the winter.
- 12.2JanJ
- 12.4FebF
- 9.6MarM
- 2.1AprA
- 0.3MayM
- 0.0JunJ
- 0.0JulJ
- 0.0AugA
- 0.0SepS
- 0.6OctO
- 5.3NovN
- 12.6DecD
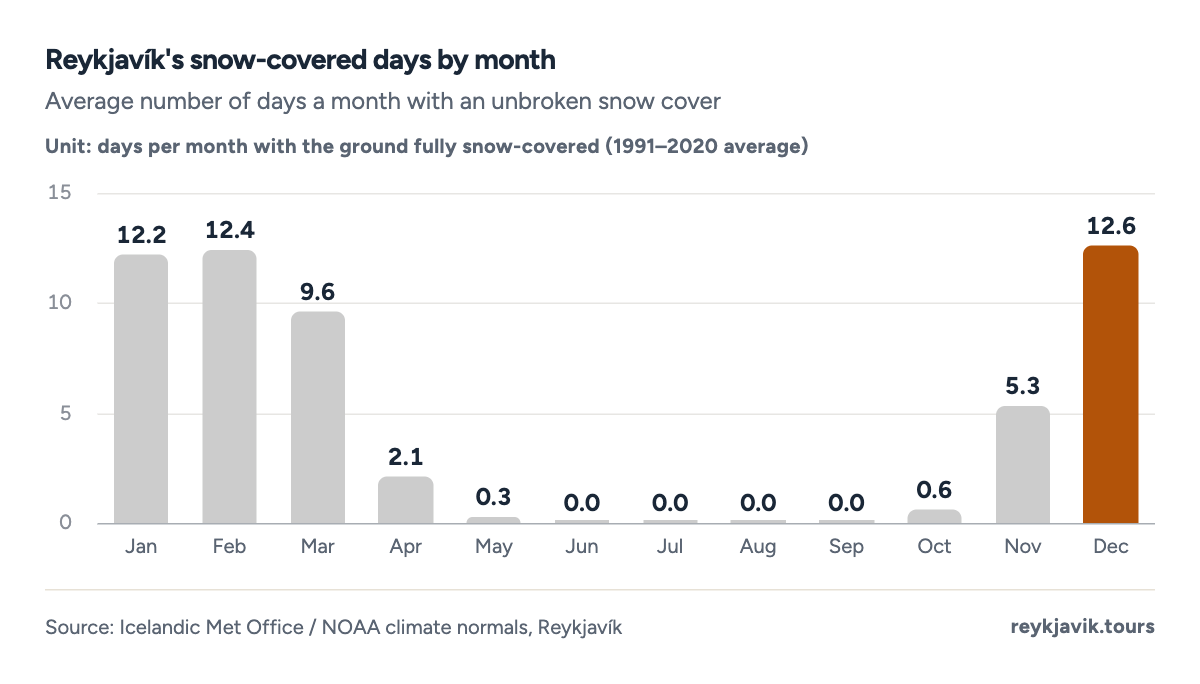
- December averages 12.6 days of snow cover, the most of any month.
- June through September average zero.
- Reykjavík
- Akureyri
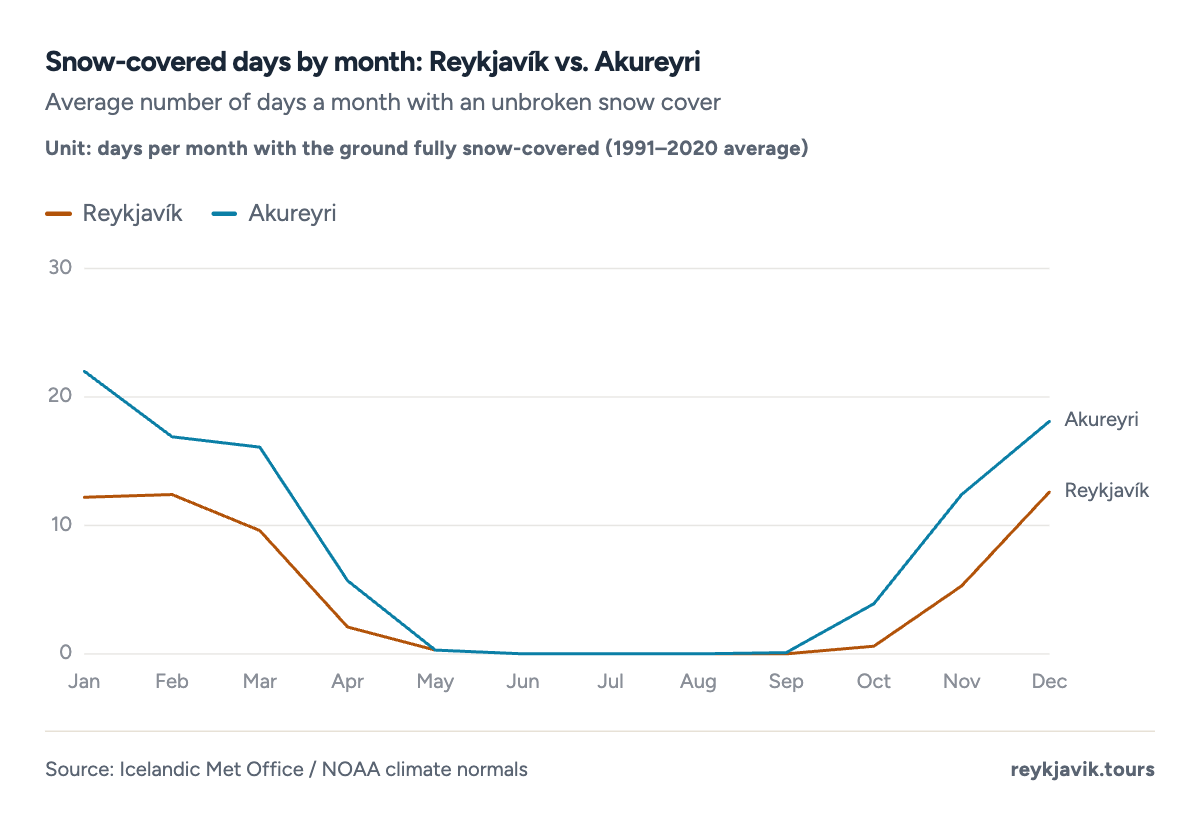
- Akureyri averages 22 days of snow cover in January alone.
- Reykjavík never averages more than 12.6 days in any month.
Average snowfall in Iceland
Because the Met Office measures snow *cover*, not a running total of new snow, the closest thing to a single "how much snow does Iceland get" number comes from climate-normal compilations built on the same station data. For Reykjavík, that compiled figure is 40 in4 (101.8 cm4) of snow a year - a useful estimate, but not an Icelandic Met Office total, since the Met Office itself does not publish one. Treat it as an informed compilation, not an official statistic, alongside the cover-day figures above, which are Met Office measurements.
Reykjavik average annual snowfall (cm)
Spelled out in the metric unit most of that keyword search traffic wants: Reykjavík's compiled annual snowfall figure is 101.8 cm4, or 40 inches4. For comparison, Reykjavik average annual precipitation (mm) - rain and snow combined, as water - comes to 875.9 mm1 (34.5 in1); see the rain sections below for how that total breaks down.
Snowfall in Iceland by month
By that same compiled estimate, Reykjavík's heaviest month for new snow is March, at 9.1 in4 (23.2 cm) - slightly ahead of December, which has more days of snow *lying* on the ground but less freshly falling. From June to September the estimate, like the cover-day count, is flat at zero.
- 7.8JanJ
- 6.7FebF
- 9.1MarM
- 4.8AprA
- 0.6MayM
- 0.0JunJ
- 0.0JulJ
- 0.0AugA
- 0.0SepS
- 0.6OctO
- 3.4NovN
- 7.0DecD
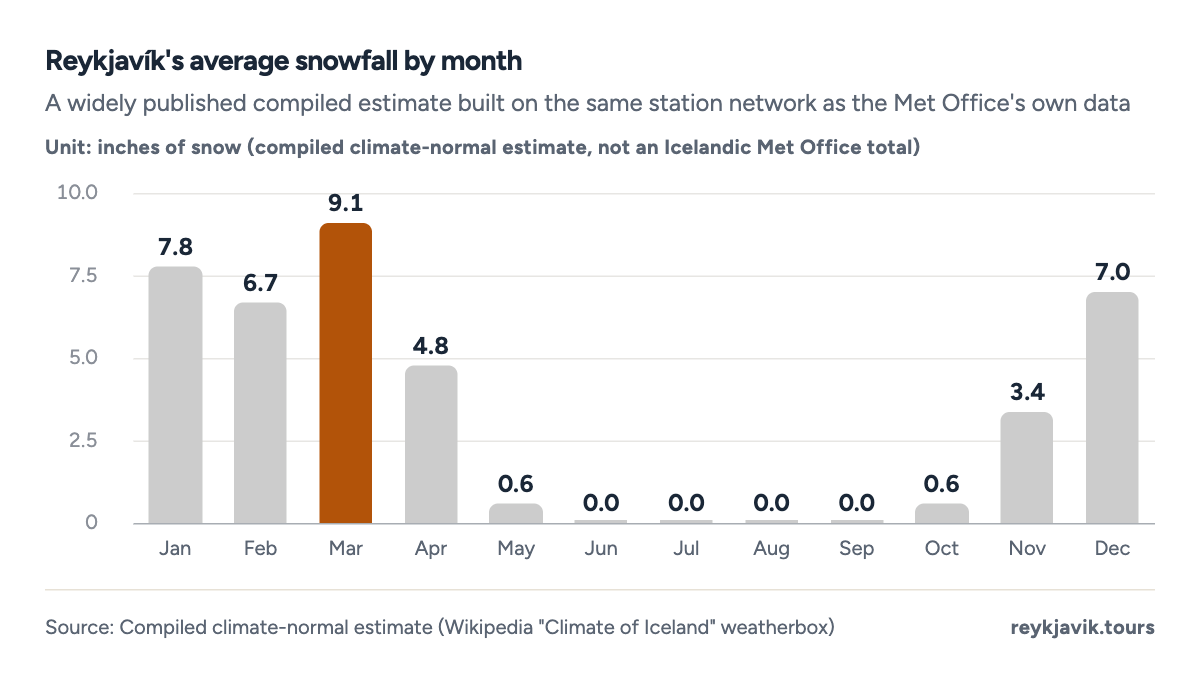
- March averages 9.1 in of new snow, the most of any month.
- No month from June to September averages any snow.
| January | 3.4 | 87.1 | 15.3 | 12.2 |
| February | 3.6 | 90.6 | 15 | 12.4 |
| March | 3.2 | 80.7 | 14.2 | 9.6 |
| April | 2.3 | 59.0 | 12 | 2.1 |
| May | 2.1 | 52.6 | 10.8 | 0.3 |
| June | 1.7 | 43.3 | 9.3 | 0 |
| July | 2.0 | 49.9 | 10.3 | 0 |
| August | 2.5 | 64.5 | 11.6 | 0 |
| September | 3.4 | 87.0 | 15 | 0 |
| October | 3.1 | 79.8 | 13.1 | 0.6 |
| November | 3.4 | 86.5 | 13.7 | 5.3 |
| December | 3.7 | 94.9 | 14.6 | 12.6 |
| January | 2.4 | 60.2 | 11.1 | 22 |
| February | 2.1 | 52.2 | 10.2 | 16.9 |
| March | 1.9 | 47.4 | 9.9 | 16.1 |
| April | 1.0 | 25.9 | 6.7 | 5.7 |
| May | 0.9 | 24.1 | 5.9 | 0.3 |
| June | 0.8 | 20.7 | 4.9 | 0 |
| July | 1.3 | 33.7 | 7.7 | 0 |
| August | 1.6 | 41.4 | 8.1 | 0 |
| September | 2.1 | 53.2 | 9.4 | 0.1 |
| October | 2.9 | 74.0 | 11.7 | 3.9 |
| November | 2.7 | 68.3 | 10.9 | 12.4 |
| December | 2.9 | 72.8 | 12 | 18.1 |
How much snow does Reykjavik get
Pulling the numbers above together for the capital alone: an average year brings 55.1 days1 with the ground covered, adding up to a compiled 102 cm4 (40 in) of new snow across the year, concentrated in four winter months and all but absent the rest of the time. That is a light snow climate for a country this far north - lighter than plenty of mid-latitude cities - because Reykjavík sits on the mild, ice-free side of an island the Gulf Stream keeps unusually warm for its latitude.
How much snow is on the ground in Reykjavik
On a typical snow day, Reykjavík's cover is thin and short-lived: successive thaws are common even in midwinter, so the depth on the ground rarely builds up the way it does inland. The exception is the rare big storm. On the morning of 28 October 2025, snow depth in the capital reached 27 cm2 and then 40 cm (15.7 in)2 by the next day - the deepest snow ever measured in Reykjavík in October, and well beyond the previous October record of just 15 cm, set in 1921. The storm snarled traffic across the city for days. Elsewhere that same year, Dalatangi on the east coast measured 90 cm2 of snow on 20 January 2025, its own station record, and a freak early-summer storm buried Vaglir in North Iceland under 43 cm5 of new snow on 5 June 2024, unheard of so late in the year.
Reykjavík's own biggest single-storm depth is actually older: 51 cm (20.1 in)6 fell in February 2017, a figure only ever exceeded once, by 55 cm6 in January 1937. Nationally, the deepest snow the Met Office has measured anywhere in recent years was 130 cm (51.2 in)7, at the Skeiðsfossvirkjun power station in the north, over three days around Christmas 2019 - more than three times the depth that shut down Reykjavík in 2025. Akureyri has set two of its own records within a single winter: 75 cm8 on 30 November 2018 and, three weeks later, 105 cm8 on 3 December 2018.
| Dalatangi | 20 Jan 2025 | 90 cm (35.4 in) | Greatest snow depth ever recorded at that station |
| Reykjavík | 29 Oct 2025 | 40 cm (15.7 in) | Greatest October snow depth on record there; beat 15 cm from 22 Oct 1921 |
| Vaglir (North Iceland) | 5 Jun 2024 | 43 cm (16.9 in) | Greatest snow depth ever measured there in June, from an unseasonal storm |
| Skeiðsfossvirkjun (North) | 23–25 Dec 2019 | 130 cm (51.2 in) | Greatest snow depth measured anywhere in Iceland in this dataset |
| Akureyri | 3 Dec 2018 | 105 cm (41.3 in) | New December snow-depth record for the station |
| Akureyri | 30 Nov 2018 | 75 cm (29.5 in) | New November snow-depth record for the station |
| Lambavatn (West) | 26 Feb 2017 | 120 cm (47.2 in) | Iceland's national snow-depth record for that year |
| Reykjavík | 26 Feb 2017 | 51 cm (20.1 in) | Reykjavík's February record; only exceeded once, by 55 cm in January 1937 |
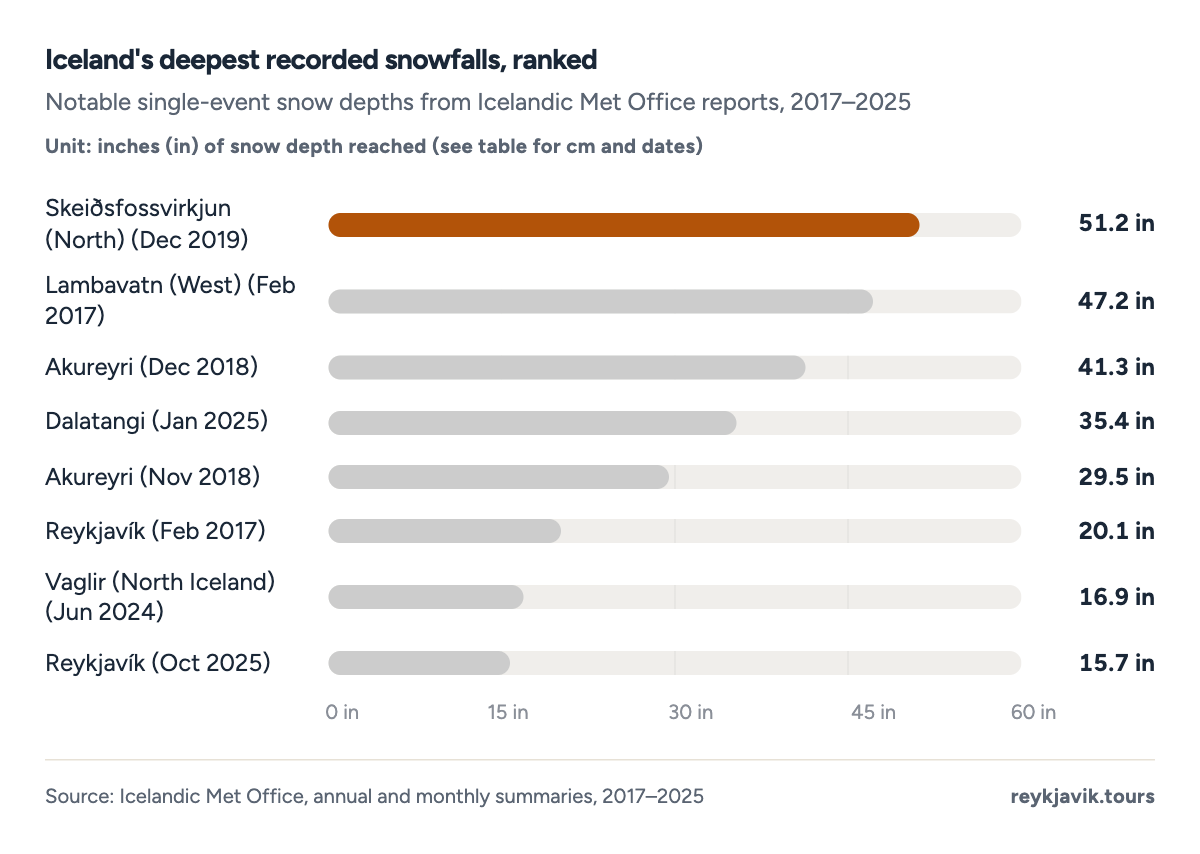
- Skeiðsfossvirkjun's 51.2 in (130 cm) in December 2019 is the deepest in this dataset.
- Four of the eight records were set in a single five-year stretch, 2017–2019.
How much rain does Iceland get
Iceland's official precipitation records, like most national weather services', combine rain, sleet and melted snow into one water total - the Met Office does not separately publish a rain-only figure. In practice, the answer is best given station by station. Average precipitation in Iceland ranges from as little as 18.2 in4 (461 mm) a year at dry, sheltered Bergstaðir to as much as 64.9 in2 (1648 mm) at exposed Dalatangi on the east coast - a more than three-and-a-half-fold range within one small country.
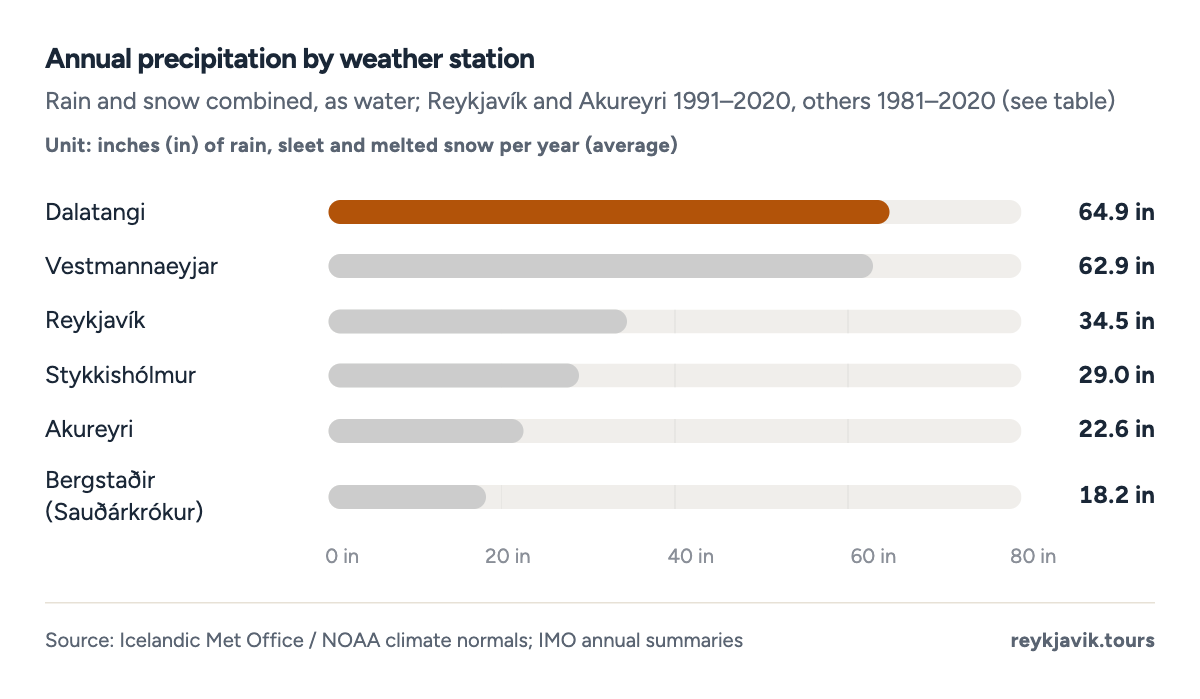
- Dalatangi averages 64.9 in a year, the most of the six.
- Bergstaðir averages just 18.2 in, the least.
| Dalatangi | 64.9 | 1,648 | 1991–2020 |
| Vestmannaeyjar | 62.9 | 1,598 | 1981–2010 |
| Reykjavík | 34.5 | 876 | 1991–2020 |
| Stykkishólmur | 29.0 | 736 | 1991–2020 |
| Akureyri | 22.6 | 574 | 1991–2020 |
| Bergstaðir (Sauðárkrókur) | 18.2 | 461 | 1981–2010 |
How often does it rain in Iceland
Frequency tells a different story from totals. Reykjavík has measurable precipitation (at least 0.04 in / 1.0 mm) on about 154.9 days1 a year - nearly every other day - while wetter but stormier Dalatangi sees it on roughly 161 days2. Vestmannaeyjar, the small archipelago off the south coast, has the most wet days of any station in this comparison at 192 days4 a year, even though its yearly total is smaller than Dalatangi's - a sign of frequent light showers rather than fewer, heavier storms.
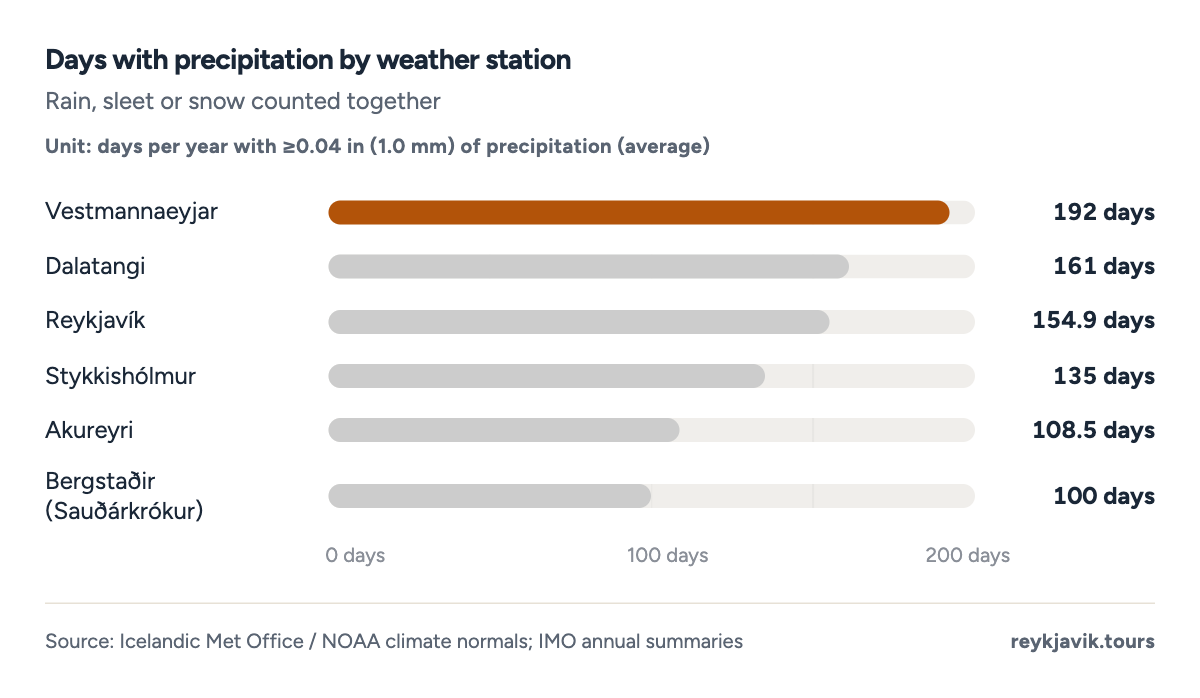
- Vestmannaeyjar has precipitation on 192 days a year, the most of the six.
- Bergstaðir has the fewest, 100 days.
Not every wet day is equal. A stricter threshold, at least 0.4 in (10 mm) of precipitation in a day, picks out the genuinely heavy events: Reykjavík averages only 21.7 such days1 a year, and Akureyri, in the drier north, just 13.23 - a small fraction of each station's roughly-every-other-day total above.
- 2.2JanJ
- 2.1FebF
- 2.1MarM
- 1.2AprA
- 1.1MayM
- 0.8JunJ
- 1.0JulJ
- 1.6AugA
- 2.3SepS
- 2.1OctO
- 2.3NovN
- 2.9DecD
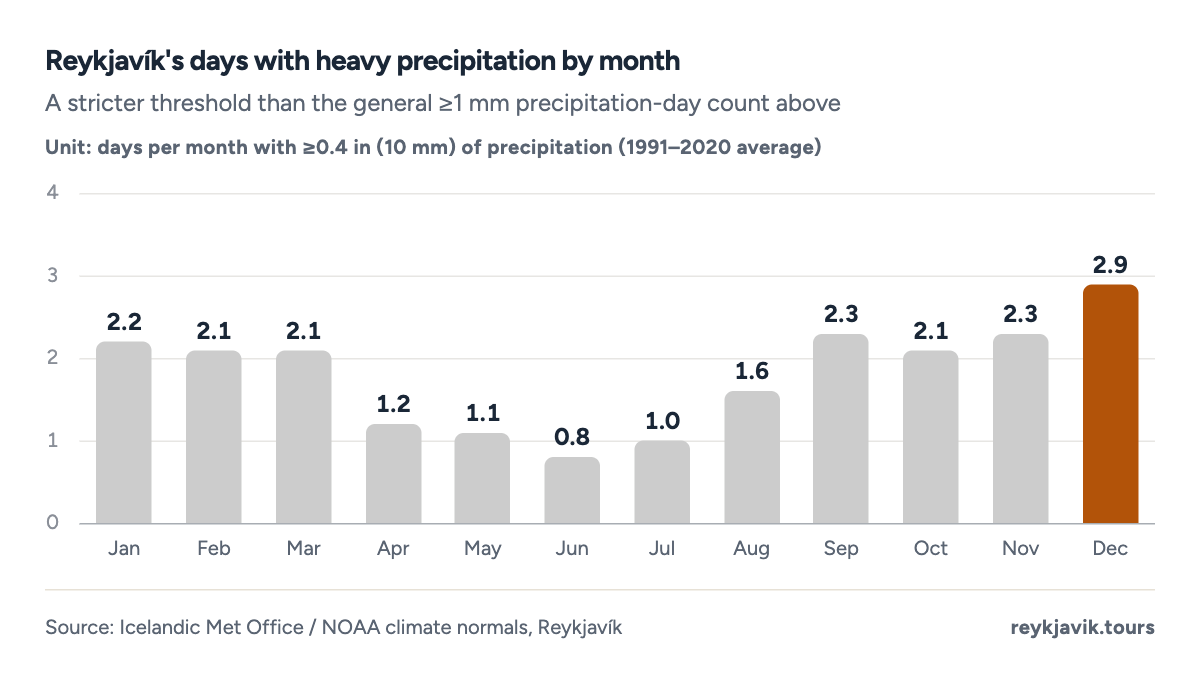
- December averages 2.9 days of heavy precipitation, the most of any month.
- June averages only 0.8 days.
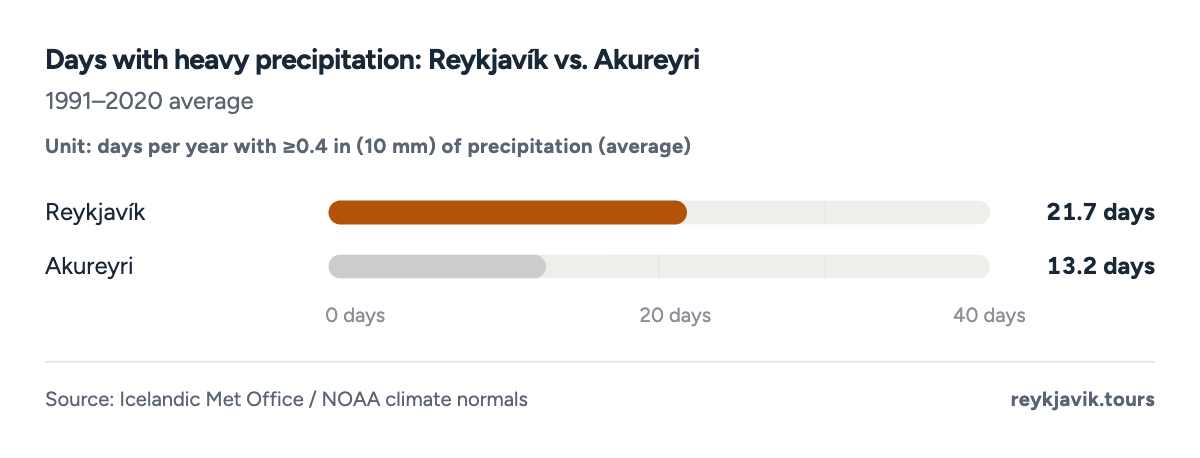
- Reykjavík averages 21.7 days a year of heavy precipitation.
- Akureyri averages 13.2 days.
Iceland precipitation by month
At Reykjavík, wet days cluster at the start and end of the year: January averages 15.3 days1 with measurable precipitation, and the run from September through December is nearly as busy. Early summer is the closest thing the capital has to a dry season, with June down to 9.3 days1.
How much does it rain in Iceland in July
Of the months tourists favour, July is the driest for the capital: Reykjavík averages only 49.9 mm1 (2.0 in1) of precipitation over about 10.3 days1. Nationally, though, July is wetter than that: the same 30-station network the Met Office and NOAA use for their normals averages 68.3 mm1 (2.7 in1) for the month, since the north and east coasts stay showery even in midsummer while the southwest capital dries out.
- 15.3JanJ
- 15.0FebF
- 14.2MarM
- 12.0AprA
- 10.8MayM
- 9.3JunJ
- 10.3JulJ
- 11.6AugA
- 15.0SepS
- 13.1OctO
- 13.7NovN
- 14.6DecD
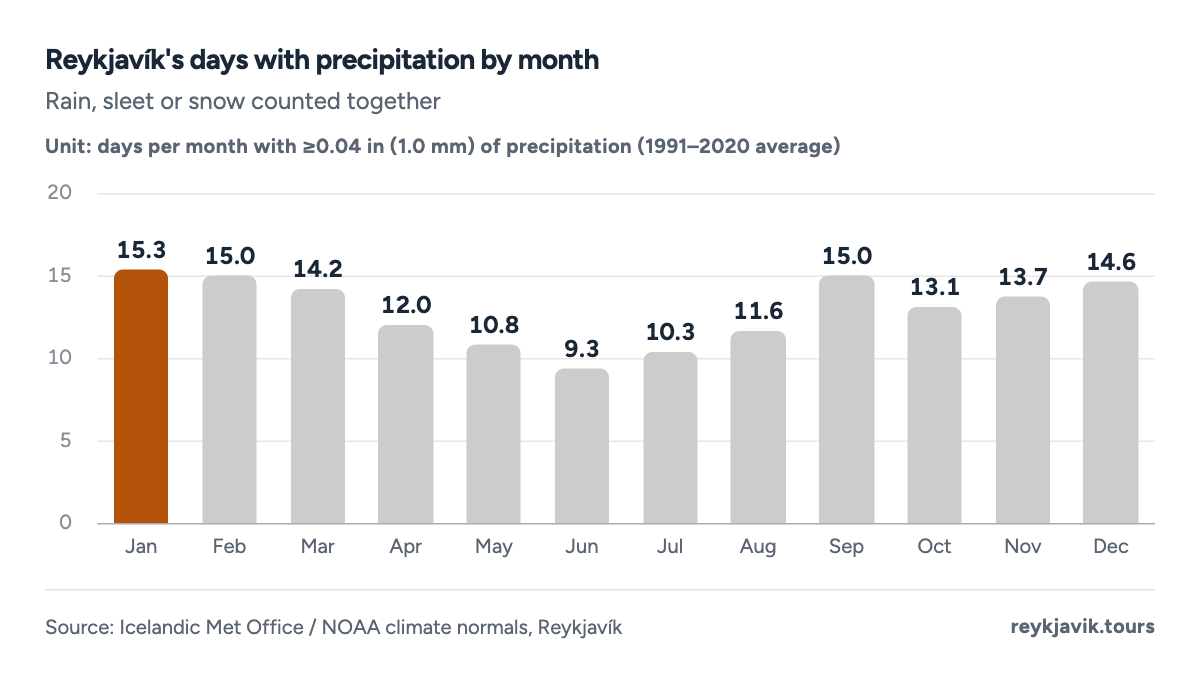
- January averages 15.3 days with precipitation, the most of any month.
- June averages just 9.3 days, the fewest.
Average rainfall in Reykjavik
Averaged over 1991–2020, Reykjavík receives 875.9 mm1 (34.5 in1) of precipitation a year. Reykjavik rainfall by month follows a clear U-shape: it dips to a June low of 43.3 mm1 (1.7 in1) and climbs back to a December high of 94.9 mm1 (3.7 in1), roughly double the summer minimum.
That average sits on top of a lot of year-to-year noise. Reykjavík's own weather station has measured precipitation without a break since 1921, and the single wettest year in its modern annual record was 20079, at 1125 mm9 (44.3 in9); the driest was 19519, at 560 mm9 (22.1 in9) - less than half as much. The most recent ten years have averaged 35.9 in9 (912 mm), somewhat above the 1991–2020 normal.
A straight line fitted to the full 1949–2025 record rises by about 0.87 in9 (22 mm) a decade; the most recent 30 years alone show a steeper rise, about 1.58 in9 a decade, though a run that short is too noisy to call a firm acceleration on its own. The Met Office's own climate-change outlook expects precipitation to keep rising as the planet warms, by at least 1.5%10 for every degree Celsius, with the largest increases expected in late summer and autumn.
Projection: linear trend of 1949–2025 yearly values, 95% prediction range. Our calculation, not a forecast.
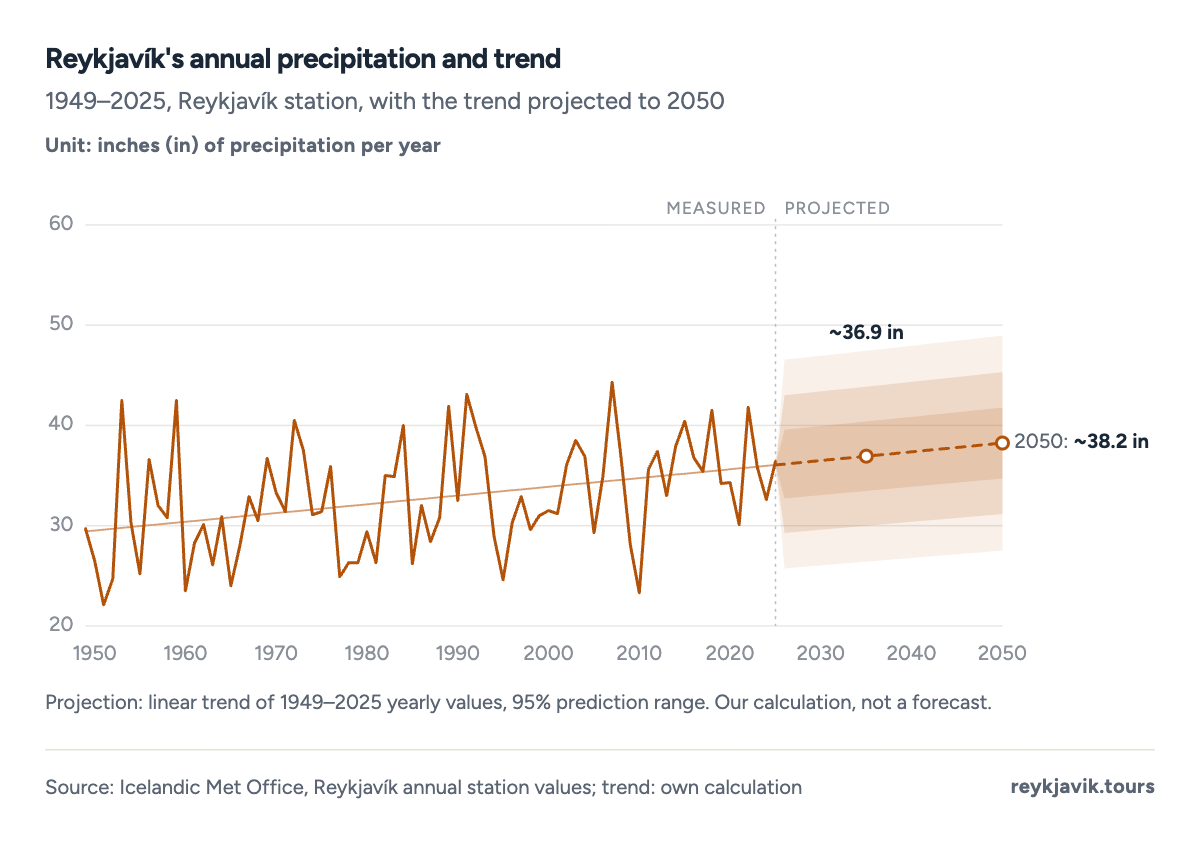
- 2007 was the wettest year on record, at 44.3 in.
- 1951 was the driest, at 22.1 in.
| 1949 | 29.7 | 753.4 |
| 1960 | 23.5 | 596.6 |
| 1970 | 33.3 | 845.0 |
| 1980 | 29.4 | 746.3 |
| 1990 | 32.5 | 826.1 |
| 2000 | 31.5 | 800.0 |
| 2010 | 23.3 | 592.3 |
| 2020 | 34.3 | 871.6 |
| 2023 | 35.8 | 910.4 |
| 2024 | 32.6 | 827.7 |
| 2025 | 36.4 | 924.2 |
Has Iceland's snow cover changed from year to year
Nine recent winters, 2017 through 2025, show just how unpredictable Icelandic snow is from one year to the next. Reykjavík's snow-covered days ranged from a low of 17 days11 in 2021 (its second-lowest on record; only 1611, in 2010, was lower) to a high of 61 days7 in 2019 - more than three and a half times as many. Akureyri swung even more: from a record-low 50 days6 in 2017, its fewest since snow-cover observations there began in 1924, to 122 days5 in 2024. Nine years of data still is not long enough to call this a trend; it mainly shows how little one winter predicts about the next.
- Reykjavík
- Akureyri
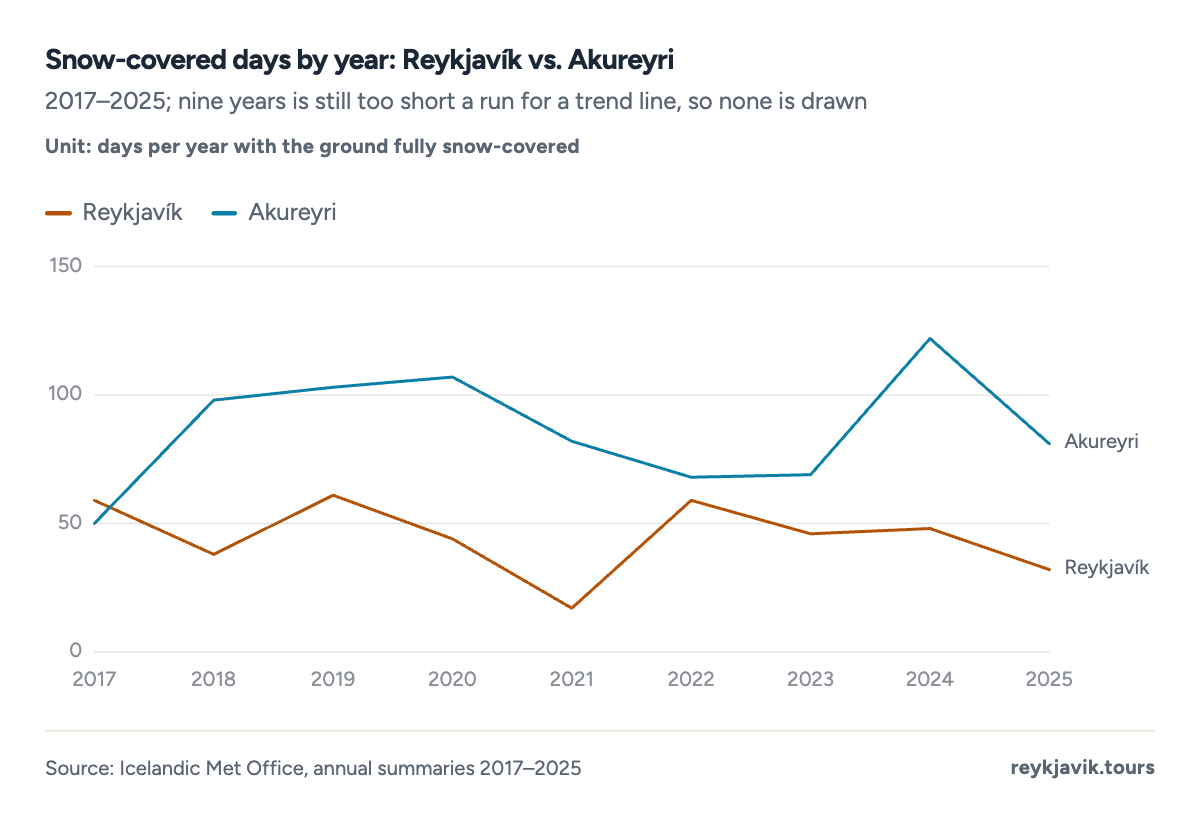
- Reykjavík ranged from 17 days in 2021 to 61 days in 2019.
- Akureyri ranged from 50 days in 2017 to 122 days in 2024.
| 2017 | 59 | 50 |
| 2018 | 38 | 98 |
| 2019 | 61 | 103 |
| 2020 | 44 | 107 |
| 2021 | 17 | 82 |
| 2022 | 59 | 68 |
| 2023 | 46 | 69 |
| 2024 | 48 | 122 |
| 2025 | 32 | 81 |
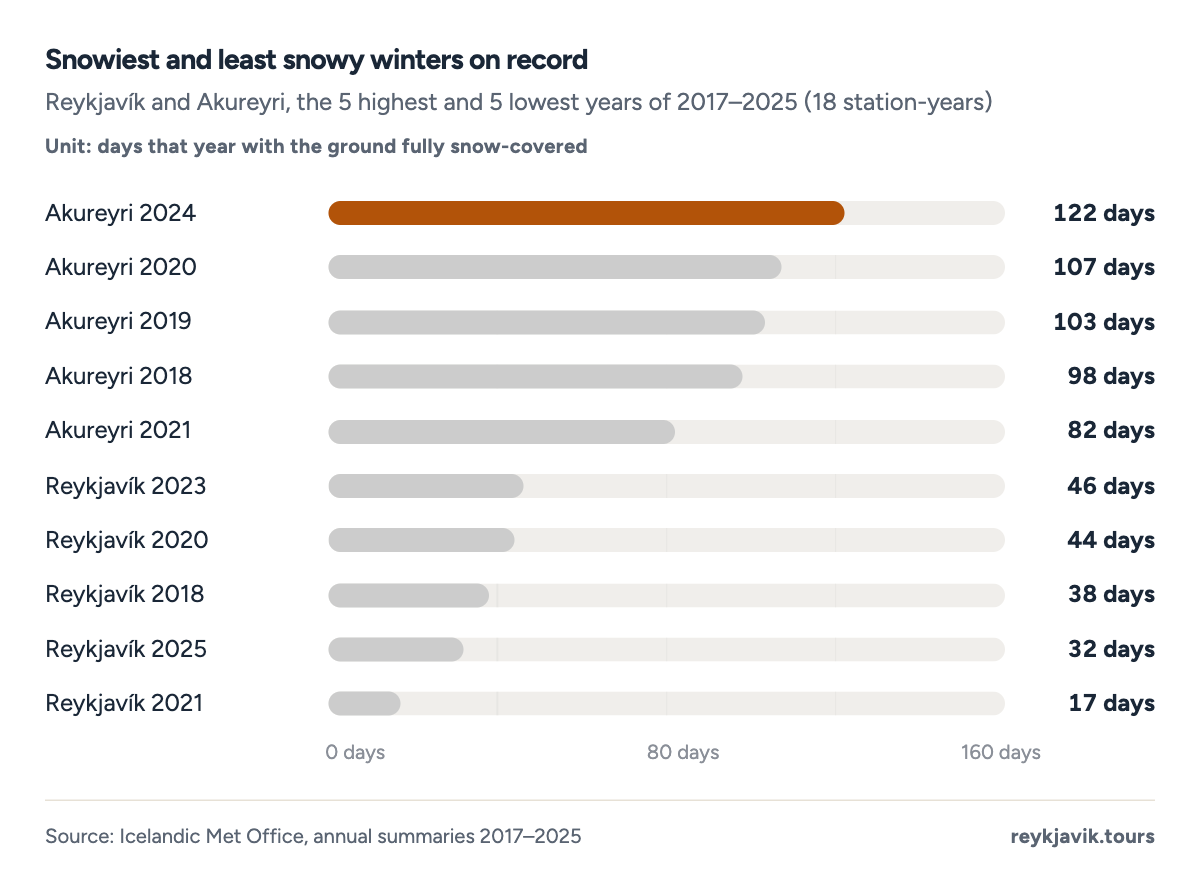
- Akureyri 2024 was the snowiest station-year, at 122 days.
- Reykjavík 2021 was the least snowy, at 17 days.
- Winter (Dec–Mar)46.884.9%
- Autumn (Oct–Nov)5.910.7%
- Spring & summer (Apr–Sep)2.44.4%
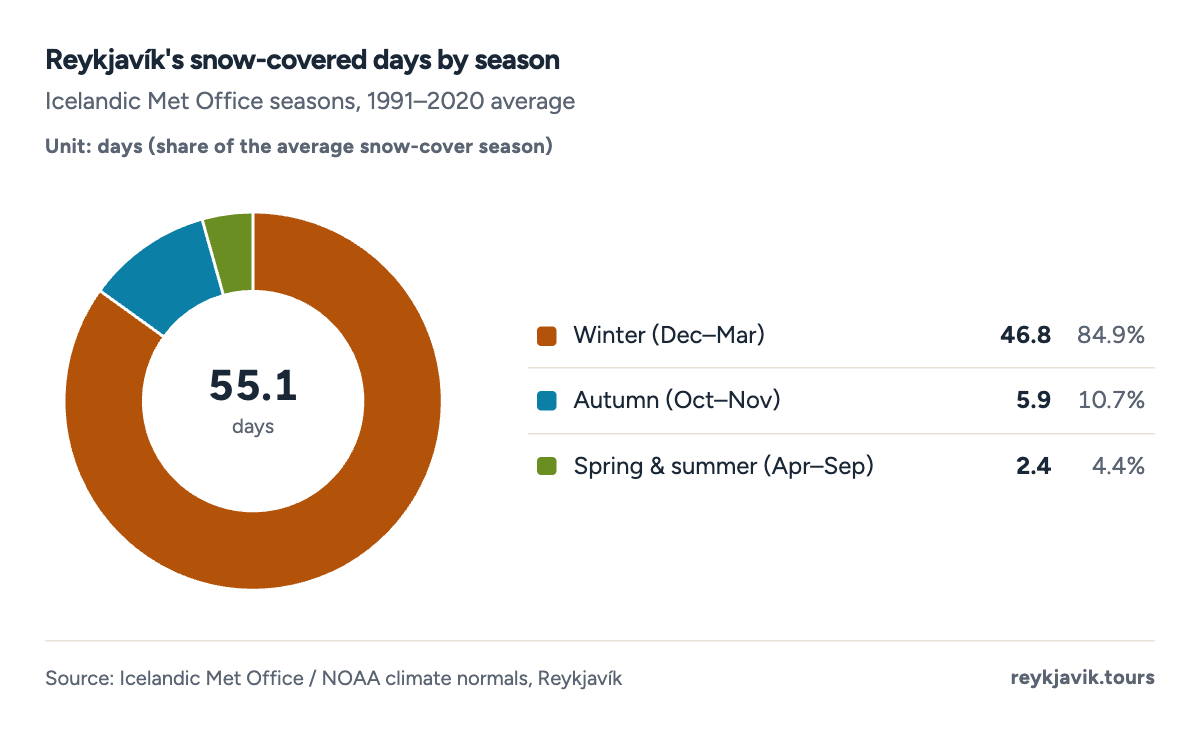
- Winter holds 46.8 days of snow cover, the large majority of the year's total.
- Spring and summer combined average barely two days.
How many words for snow in Iceland
Iceland's relationship with snow shows up in its language, too, though the numbers thrown around should be taken lightly. One widely shared compiled list runs to 8515 distinct Icelandic words and phrases connected to snow, covering everything from wet, heavy "krap" to the fine, dry "mjöll." Other sources put the count anywhere from 4615 to over 100, and an old Icelandic saying claims more than a hundred outright. None of these figures comes from a linguistic census, so treat them as folklore with a grain of truth - a reflection of a culture that has long had reason to describe its snow precisely, not a peer-reviewed word count.
Avalanches: Iceland's other snow risk
Heavy snow in steep terrain brings a real hazard alongside the inconvenience: avalanches are Iceland's most common cause of death from a natural hazard16, with roughly 68016 recorded deaths since the first documented case in 1118, counted up to 2001. Most of that toll is historical, from small fishing villages built directly below steep slopes before the risk was understood. The turning point was 1995, when avalanches killed 2017 people in Flateyri and 1417 in Súðavík in the same year, both in the Westfjords; afterward, Iceland built defence barriers above its most exposed towns and gave the Icelandic Met Office responsibility for avalanche forecasting and warnings, which it still runs today.
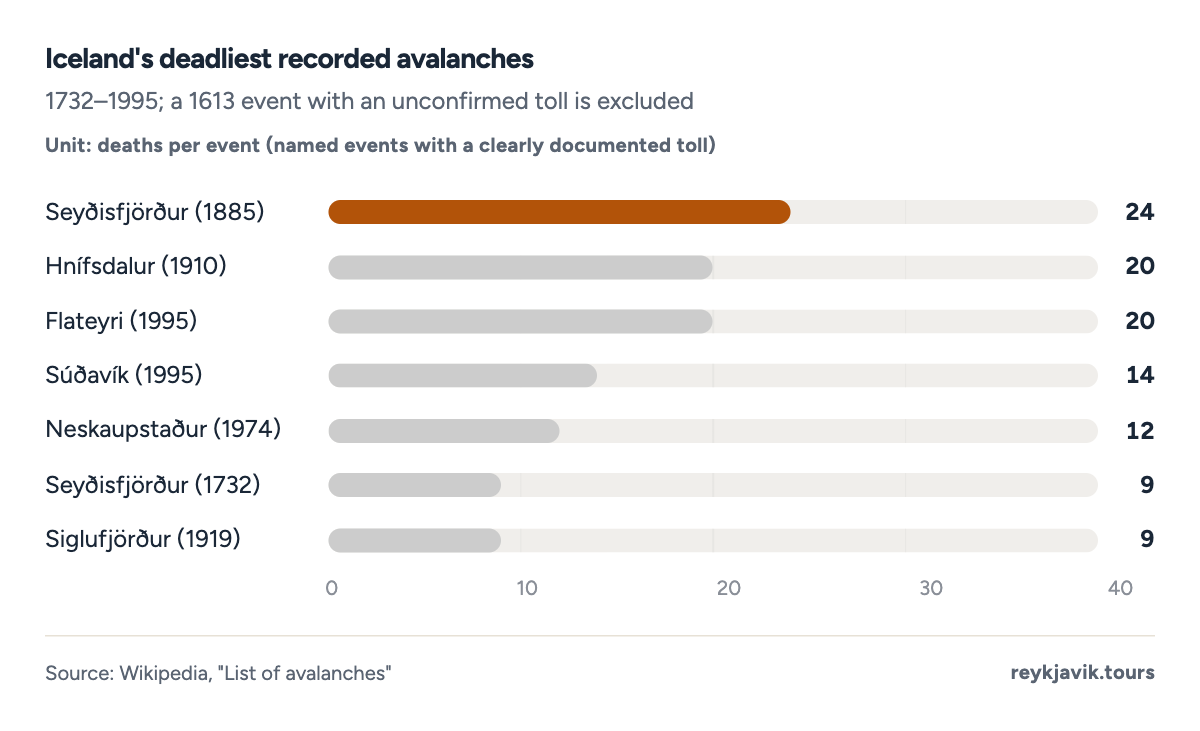
- The 1885 Seyðisfjörður avalanche killed 24 people, the most of any event listed.
- The 1995 Flateyri and Súðavík avalanches, with 20 and 14 deaths, led directly to Iceland's modern avalanche-warning system.
What Iceland's snow and rain mean for a trip
- Winter (December–March) is both the snowiest stretch and one of the wettest, so a winter visit should budget extra time for both road delays and grounded flights.
- Akureyri and the north hold snow for nearly twice as many days as Reykjavík, so a single Ring Road loop can cross very different conditions in one day.
- July is the driest month in Reykjavík even though it is not the driest nationally, making the southwest the safer bet for outdoor plans that need dry ground.
- A single winter is a poor guide to "normal": Reykjavík's nine most recent years ranged from 17 to 61 snow-covered days, and Akureyri's from 50 to 122.
- The deepest recent snowfall in the capital came from an October storm, months before the "snow season" the averages above describe - a reminder that averages hide the extremes that most affect a trip already under way.
- Studded and winter tyres are legal in Iceland from 1 November to 15 April (see table below); avalanche warnings, when issued, should always take priority over a planned route.
| Iceland | 1 Nov – 15 Apr | Not mandatory, but required tread and equipment apply |
| Norway | Varies by region, from 16 Oct or 1 Nov – 30 Apr | Mandatory in winter conditions |
| Denmark | 1 Nov – 15 Apr | Not mandatory |
| Estonia | 1 Dec – 1 Mar (mandatory); studs allowed 1 Oct – 30 Apr | Mandatory 1 Dec – 1 Mar |
Conclusions
- Rain, not snow, is Reykjavík's real weather story. The capital logs nearly three wet days for every one with snow on the ground, and what snow does fall rarely stays long.
- Distance from Reykjavík to Akureyri matters more for snow than distance from the Arctic Circle: the two stations sit at similar latitudes, yet Akureyri holds snow cover for close to twice as many days a year.
- Single winters mislead badly. Across nine recent years, Reykjavík's snow-covered days ranged from 17 to 61 and Akureyri's from 50 to 122, with no clear run of similar winters in either place - any one year is a weak guide to the next.
- The rainiest months (autumn into early winter) and the snowiest months (deep winter) overlap only partly, so timing a trip to dodge snow often means landing in some of the wettest weeks instead.
- Iceland's most dramatic recent snow event, the October 2025 storm that buried Reykjavík under a record 40 cm, happened entirely outside the "snow season" the long-term averages describe - proof that averages are a starting point, not a guarantee.
Methodology
- Reykjavík (capital, southwest coast)
- Akureyri (north)
- Stykkishólmur (west)
- Dalatangi (east coast)
- Vestmannaeyjar (south coast islands)
- Bergstaðir, near Sauðárkrókur (north interior)
Definition. "Snow" here covers two different Icelandic Met Office measurements: days with the ground fully snow-covered ("alhvítir dagar"), and spot snow depth. The Met Office does not publish a running total of new snowfall, so the "average snowfall" figures are a labelled, separately sourced compiled estimate, not an official total. "Rain" and "precipitation" are used interchangeably for the Met Office's combined rain-and-snow water total, because Iceland's official data does not separate the two. Units: inches and centimetres/millimetres, with the original metric measurement always given alongside.
Data sources. Monthly and annual 1991–2020 climate normals for Reykjavík and Akureyri, from the Icelandic Met Office via NOAA's WMO climate-normals archive;1 Reykjavík's unbroken annual station record since 1949;9 the Met Office's English-language annual summaries for 2017–2025;2 1981–2010 normals for Vestmannaeyjar and Bergstaðir and the compiled Reykjavík snowfall-by-month estimate, both via Wikipedia's "Climate of Iceland" weatherbox;4 the Met Office's 2018 climate-change outlook;10 a travel-operator's compiled list of Icelandic snow words for the cultural aside;15 Wikipedia's "List of avalanches" for named Icelandic events with a documented death toll;17 a 2001 Veðurstofa Íslands safety report for the cumulative avalanche-death total;16 and a compiled European winter-tyre regulation reference.18
Calculations. Long-term averages for Stykkishólmur and Dalatangi are back-calculated from the percentage deviations the Met Office states in its 2025 annual summary (e.g. a station at 106% of its average implies the average), since no NOAA normals table exists for those two stations; the 2025 figures for Reykjavík and Akureyri from the same summary were cross-checked against the NOAA normals and matched within rounding. The precipitation trend is a least-squares line fitted to Reykjavík's 1949–2025 annual station total, with a 95% prediction range extended to 2050. The 2017–2025 snow-cover-days series uses each year's raw reported day count, which stays comparable even though the Met Office changed which reference period (1971–2000, later 1991–2020) it compared each year's deviation against.
Limitations. Vestmannaeyjar and Bergstaðir use an older 1981–2010 reference period, not 1991–2020, so they are indicative rather than strictly comparable to the other four stations. The compiled "average snowfall" figures are not an Icelandic Met Office statistic. The 2017–2025 snow-cover-days series, though longer than a first pass would give, is still too short to support a trend projection, so none is shown for it. Word counts for Icelandic snow vocabulary are not a linguistic census and vary widely by source. The avalanche death toll excludes one 1613 event Wikipedia itself flags as unconfirmed, and the 680-death cumulative figure runs only to 2001, the date of its source report.
Sources
- Icelandic Meteorological Office / NOAA. “Reykjavík climate normals 1991–2020 (WMO station 04030).” National Oceanic and Atmospheric Administration, 1991–2020. nodc.noaa.gov. Accessed 16 Sept. 2026. Back to text
- Icelandic Meteorological Office. “The weather in Iceland in 2025.” Veðurstofa Íslands, 2026. en.vedur.is. Accessed 16 Sept. 2026. Back to text
- Icelandic Meteorological Office / NOAA. “Akureyri climate normals 1991–2020 (WMO station 04063).” National Oceanic and Atmospheric Administration, 1991–2020. nodc.noaa.gov. Accessed 16 Sept. 2026. Back to text
- Wikipedia contributors. “Climate of Iceland (weatherbox climate-normal compilation).” Wikimedia Foundation. en.wikipedia.org. Accessed 16 Sept. 2026. Back to text
- Icelandic Meteorological Office. “The weather in Iceland in 2024.” Veðurstofa Íslands, 2025. gottvedur.is. Accessed 16 Sept. 2026. Back to text
- Icelandic Meteorological Office. “The weather in Iceland in 2017.” Veðurstofa Íslands, 2018. en.vedur.is. Accessed 16 Sept. 2026. Back to text
- Icelandic Meteorological Office. “The weather in Iceland in 2019.” Veðurstofa Íslands, 2020. en.vedur.is. Accessed 16 Sept. 2026. Back to text
- Icelandic Meteorological Office. “The weather in Iceland in 2018.” Veðurstofa Íslands, 2019. en.vedur.is. Accessed 16 Sept. 2026. Back to text
- Veðurstofa Íslands (Icelandic Met Office). “Ársmeðaltöl fyrir stöð 1 - Reykjavík (annual station values, 1949–present).” Veðurstofa Íslands. vedur.is. Accessed 16 Sept. 2026. Back to text
- Vísindanefnd um loftslagsbreytingar (Scientific Committee on Climate Change). “Loftslagsbreytingar og áhrif þeirra á Íslandi (Climate change and its effects in Iceland).” Veðurstofa Íslands, 2018. vedur.is. Accessed 16 Sept. 2026. Back to text
- Icelandic Meteorological Office. “The weather in Iceland in 2021.” Veðurstofa Íslands, 2022. en.vedur.is. Accessed 16 Sept. 2026. Back to text
- Icelandic Meteorological Office. “The weather in Iceland in 2020.” Veðurstofa Íslands, 2021. en.vedur.is. Accessed 16 Sept. 2026. Back to text
- Icelandic Meteorological Office. “The weather in Iceland in 2022.” Veðurstofa Íslands, 2023. en.vedur.is. Accessed 16 Sept. 2026. Back to text
- Icelandic Meteorological Office. “The weather in Iceland in 2023.” Veðurstofa Íslands, 2024. en.vedur.is. Accessed 16 Sept. 2026. Back to text
- Hey Iceland. “Icelandic oddities: 85 words for snow.” Hey Iceland (tour operator, Icelandic Travel Market). heyiceland.is. Accessed 16 Sept. 2026. Back to text
- Veðurstofa Íslands (Icelandic Met Office). “Slys og tjón af völdum snjóflóða og skriðufalla (Injuries and damage from avalanches and landslides).” Veðurstofa Íslands, 2001. vedur.is. Accessed 16 Sept. 2026. Back to text
- Wikipedia contributors. “List of avalanches (deadliest recorded events, cross-checked by country and date).” Wikimedia Foundation. en.wikipedia.org. Accessed 16 Sept. 2026. Back to text
- European Consumer Centres Network / compiled by ECC Croatia. “Winter Tires Within Europe, in Iceland and Norway (regulation compilation).” ECC Croatia. ecc-croatia.hr. Accessed 16 Sept. 2026. Back to text
About the author
Laufey turns public statistics on tourism and travel into research people can check and cite.
Every figure on this page links to its source. How we research
Related research
More data on Iceland's weather and travel from Reykjavik Tours.
- WeatherIceland Weather by Month (2026 Data)4.5 in rain in September, Iceland's wettest monthRead the research →
- WeatherIceland Daylight Hours by Month (2026 Data)21.2 h of daylight in Reykjavík on the longest dayRead the research →
- WeatherIceland Temperature by Month (2026 Data)39 °F average temperature in IcelandRead the research →
- WeatherAverage Wind Speed in Iceland (2026 Data)5.2 m/s average wind speed in IcelandRead the research →
- Travel planningHow Often Can You See the Northern Lights in Iceland? (2026 Data)~50% chance of aurora on any dark-season nightRead the research →
- TravelHow Many Days in Iceland? (2026 Data)7.1 nights average stay of foreign visitorsRead the research →