Average Wind Speed in Iceland (2026 Data)
How windy Iceland really is: the national average, the records, the windiest places and months, and how it compares with the rest of Europe.
- Published
- Updated
- 13 sources
- 50 statistics
- 9 min read

- M.Sc. in Atmospheric Sciences, University of Iceland (Háskóli Íslands), with a minor thesis on North Atlantic storm-track variability
- Former research assistant at the Icelandic Meteorological Office (Veðurstofa Íslands), working on subarctic climate modeling and volcanic-ash dispersion forecasting
- B.A. in Sociology, also from the University of Iceland, with fieldwork on rural depopulation and tourism's impact on small fishing communities (Westfjords focus)
- Grew up in Akureyri, spent seven years living in Reykjavík and two in a small village in the Westfjords - brings first-hand experience of Iceland's regional weather extremes and community life
- Fluent in Icelandic and English; has translated Icelandic Met Office public advisories for international outlets
- Published field notes and data-driven pieces on glacier retreat (Vatnajökull), aurora forecasting, and the socioeconomic effects of overtourism in the Golden Circle

- M.A. in Journalism, University of Iceland, with additional coursework in Environmental Communication at the University of Bergen (Norway), giving a comparative Nordic lens
- 12+ years in Icelandic media, including editorial roles at RÚV (Iceland's national broadcaster) covering weather-related public safety reporting (storms, volcanic eruptions, road closures)
- Former fact-checking lead for a travel-and-culture desk, specializing in verifying tourism statistics, safety advisories, and climate data against primary sources (Vedur.is, Statistics Iceland)
- Has overseen editorial standards for bilingual (Icelandic/English) publications, ensuring both cultural nuance and accuracy for international readers
- Advocate for citing primary sources (Icelandic Met Office, Icelandic Tourist Board / Ferðamálastofa) rather than secondhand reporting
Key findings
- 5.2 m/sThe average wind speed in Iceland is 5.2 m/s (19 km/h, 12 mph).
- 74.2 m/sIceland's strongest recorded wind gust is 74.2 m/s, measured on Gagnheiðarhnúkur in January 1995.
- 45%Iceland is 45% windier in winter (6.0 m/s) than in summer (4.1 m/s).
- 6.5 m/sIceland is the windiest sovereign country in Europe, averaging 6.5 m/s across its land.
- 4.6 m/sReykjavík's average wind speed is 4.6 m/s, calmer than Iceland as a whole.
- 10.6 m/sStórhöfði in the Westman Islands is Iceland's windiest weather station, averaging 10.6 m/s.
On paper, Iceland is not a particularly windy country. Averaged across its weather stations, the wind blows at 5.2 m/s1 (19 km/h, 12 mph), force 3 on the Beaufort scale: a gentle breeze that keeps a flag flying.2 Yet the same island holds a wind gust of 74.2 m/s3, more than twice the speed at which the scale simply calls it a hurricane. The gap between those two numbers decides whether flights leave on time, whether a car door survives a gust in a parking lot and how cold a freezing day really feels.
The measurements hold a few surprises. Winter is 45%1 windier than summer. The capital is calmer than the national average, while the airport where visitors land is one of the windiest stations in the country. And measured across its whole land area, Iceland is windier than any other sovereign country in Europe. This report draws on three decades of Icelandic Met Office measurements, the official weather records and a Europe-wide wind model to show how windy Iceland is, where and when.
Iceland average wind speed: the national figure
The Icelandic Met Office does not publish a single national wind speed. Its yearly climate summaries only say how much windier or calmer each year was than the 1991–2020 average.4 To get the figure itself, we took the Met Office's own annual measurements for every station with at least 20 years of wind data between 1991 and 2020. That leaves 32 stations1, spread across all eight regions of the country, from lighthouses on northern capes to farms in inland valleys.
Averaging their long-term means gives 5.2 m/s1, or 19 km/h and 12 mph. In everyday terms that is a steady breeze: you notice it on a bicycle and it keeps a flag flying, but it does not make walking hard.
The exact figure depends on which stations you count. The nine stations with a complete 30-year record average 5.7 m/s1, because several of them stand on exposed sites such as Keflavík Airport and the Sauðanes lighthouse. And weather stations are placed where people live and work, which in Iceland mostly means the coastal lowlands. Across the whole land area, including the highlands and glaciers, the Global Wind Atlas puts the average at 6.5 m/s5 at 10 metres above the ground.
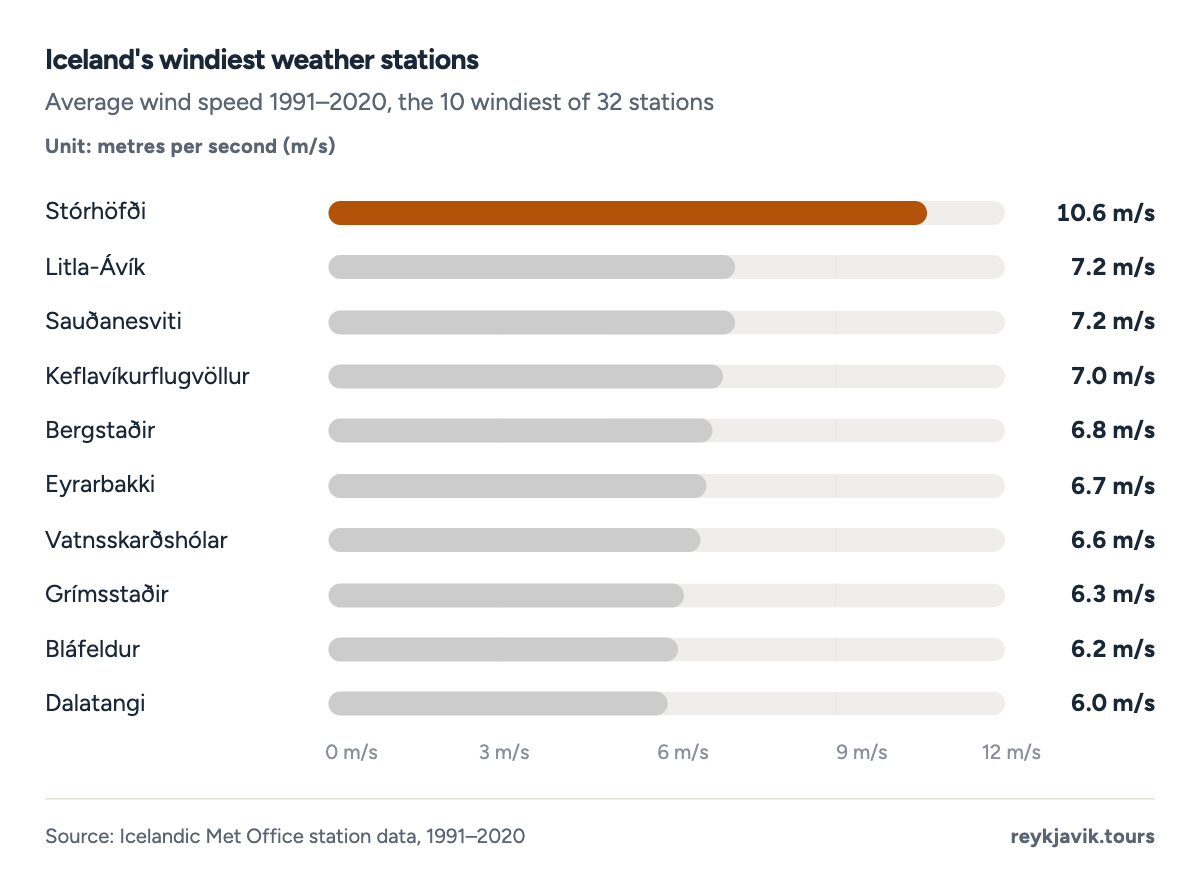
- Stórhöfði averages 10.6 m/s, the highest of any station.
- Keflavík Airport, where most visitors land, ranks fourth at 7.0 m/s.
An average smooths over a country of extremes. The windiest station, Stórhöfði on the Westman Islands, records 10.6 m/s1. The calmest, Lerkihlíð in the north-east, records 2.7 m/s1. Same island, almost four times the wind.
The strongest winds ever recorded in Iceland
Record wind speed and record gust
Iceland's official weather records show how far the wind can climb above its average. Meteorologists separate sustained wind, averaged over ten minutes, from gusts, the short bursts inside it. Both records are extraordinary:
- Strongest 10-minute wind: 62.5 m/s3 (225 km/h, 140 mph) on Skálafell by Mount Esja, 20 January 1998
- Strongest gust: 74.2 m/s3 (267 km/h, 166 mph) on Gagnheiðarhnúkur in the east, 16 January 1995
- Strongest gust in Reykjavík: 59.4 m/s3 (214 km/h, 133 mph), 15 January 1942
All three records fell in January, the heart of the stormy season. The two national records were measured on mountain tops, where stations stand in the full path of Atlantic storms. The record gust is more than double the 32.7 m/s2 at which the Beaufort scale reaches its top level. The Reykjavík record is a reminder that the capital is not immune: it was set during a storm more than eighty years ago and still stands.
Windiest and calmest weather stations
Among ordinary weather stations the pattern is simple: exposure wins. Stórhöfði, a steep headland at the southern tip of Heimaey, averages 10.6 m/s1. Two northern coastal stations follow, Litla-Ávík in the Westfjords and the Sauðanes lighthouse, both at 7.2 m/s1. At the calm end are inland and fjord-head sites protected by mountains, such as Lerkihlíð at 2.7 m/s1 and Akureyri at 3.7 m/s1.
The table lists all 32 stations behind the national average, with the years each one covers.
| 1 | Stórhöfði | South | 10.6 | 38 | 24 | 1991–2012 |
| 2 | Litla-Ávík | Westfjords | 7.2 | 26 | 16 | 1996–2020 |
| 3 | Sauðanesviti | Northeast | 7.2 | 26 | 16 | 1991–2020 |
| 4 | Keflavíkurflugvöllur | Southern Peninsula | 7.0 | 25 | 16 | 1991–2020 |
| 5 | Bergstaðir | Northwest | 6.8 | 25 | 15 | 1991–2017 |
| 6 | Eyrarbakki | South | 6.7 | 24 | 15 | 1991–2016 |
| 7 | Vatnsskarðshólar | South | 6.6 | 24 | 15 | 1991–2020 |
| 8 | Grímsstaðir | Northeast | 6.3 | 22 | 14 | 1991–2020 |
| 9 | Bláfeldur | West | 6.2 | 22 | 14 | 1998–2017 |
| 10 | Dalatangi | East | 6.0 | 22 | 13 | 1991–2020 |
| 11 | Stykkishólmur | West | 5.9 | 21 | 13 | 1991–2020 |
| 12 | Hraun á Skaga | Northwest | 5.6 | 20 | 13 | 1991–2011 |
| 13 | Mánárbakki | Northeast | 5.4 | 20 | 12 | 1991–2016 |
| 14 | Hólar í Hornafirði | South | 5.1 | 18 | 11 | 1991–2011 |
| 15 | Miðfjarðarnes | Northeast | 5.0 | 18 | 11 | 2000–2020 |
| 16 | Ásgarður | West | 4.9 | 17 | 11 | 1993–2020 |
| 17 | Bolungarvík | Westfjords | 4.7 | 17 | 11 | 1995–2017 |
| 18 | Korpa | Capital Region | 4.7 | 17 | 10 | 1991–2011 |
| 19 | Reykjavík | Capital Region | 4.6 | 16 | 10 | 1991–2020 |
| 20 | Hjarðarland | South | 4.4 | 16 | 10 | 1991–2020 |
| 21 | Hæll | South | 4.1 | 15 | 9 | 1991–2011 |
| 22 | Mýri | Northeast | 4.1 | 15 | 9 | 1991–2012 |
| 23 | Skjaldþingsstaðir | East | 4.0 | 14 | 9 | 1995–2020 |
| 24 | Stafholtsey | West | 4.0 | 14 | 9 | 1991–2016 |
| 25 | Lambavatn | Westfjords | 3.9 | 14 | 9 | 1991–2012 |
| 26 | Vík í Mýrdal | South | 3.9 | 14 | 9 | 1991–2012 |
| 27 | Kirkjubæjarklaustur | South | 3.7 | 13 | 8 | 1991–2012 |
| 28 | Akureyri | Northeast | 3.7 | 13 | 8 | 1991–2020 |
| 29 | Svínafell | East | 3.7 | 13 | 8 | 1992–2011 |
| 30 | Staðarhóll | Northeast | 3.5 | 13 | 8 | 1991–2010 |
| 31 | Hólar í Dýrafirði | Westfjords | 3.5 | 12 | 8 | 1991–2019 |
| 32 | Lerkihlíð | Northeast | 2.7 | 10 | 6 | 1991–2011 |
Wind speed by region
Grouping the stations into Iceland's eight regions shows where the wind concentrates. The Southern Peninsula tops the list at 7.0 m/s1, although that figure rests on a single station, Keflavík Airport. The Northwest follows at 6.2 m/s1, then the South, with its long and exposed coastline, at 5.7 m/s1.
The calmest regions are the East at 4.5 m/s1 and the Capital Region at 4.6 m/s1. The gap between the windiest and the calmest region is 2.4 m/s1, almost half the national average itself.
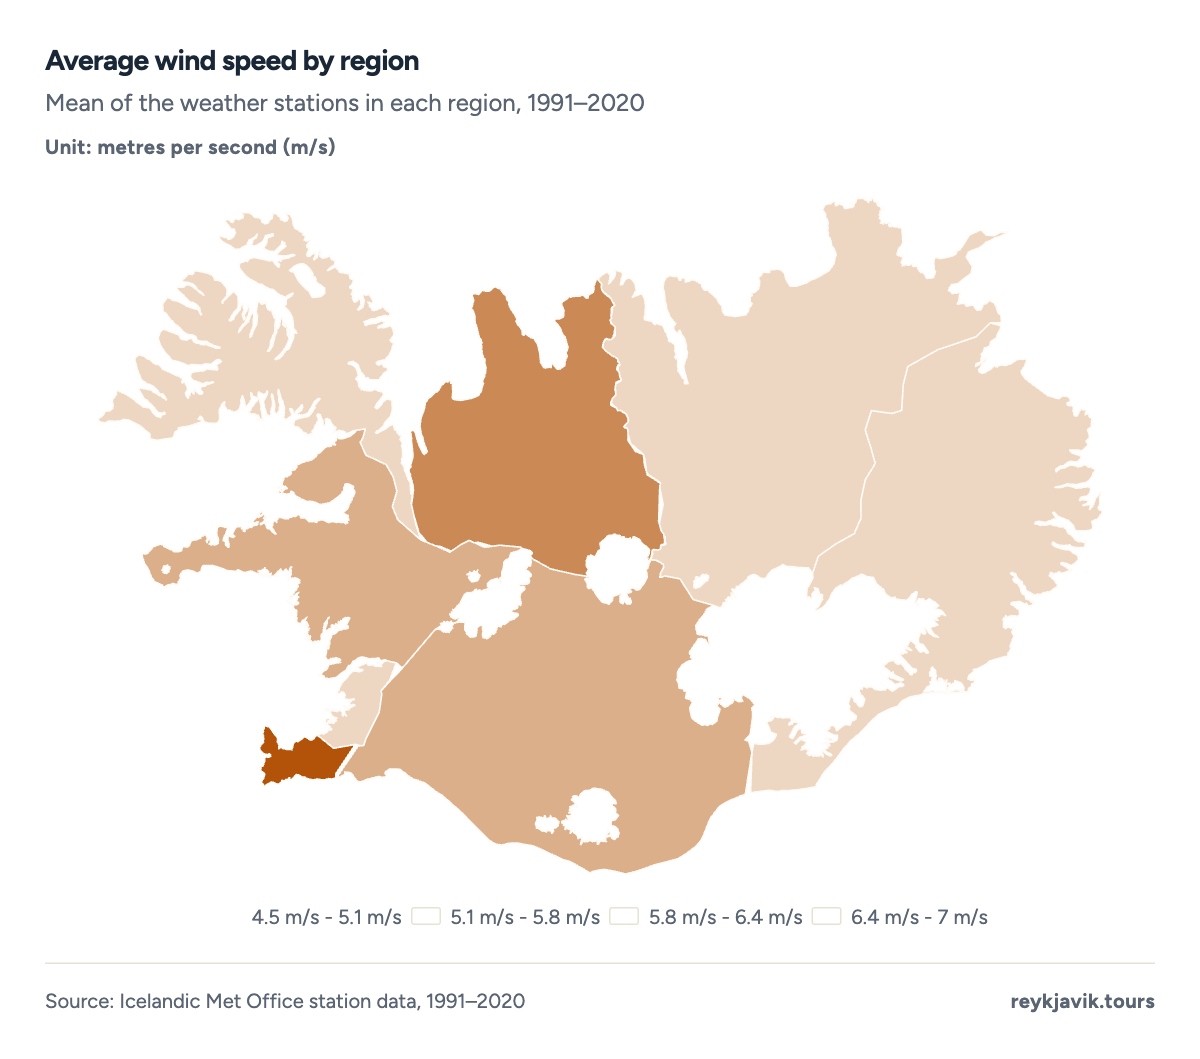
- The Southern Peninsula averages 7.0 m/s, measured at Keflavík Airport.
- The East is the calmest region at 4.5 m/s.
- South825%
- Northeast825%
- West412.5%
- Westfjords412.5%
- Other regions825%
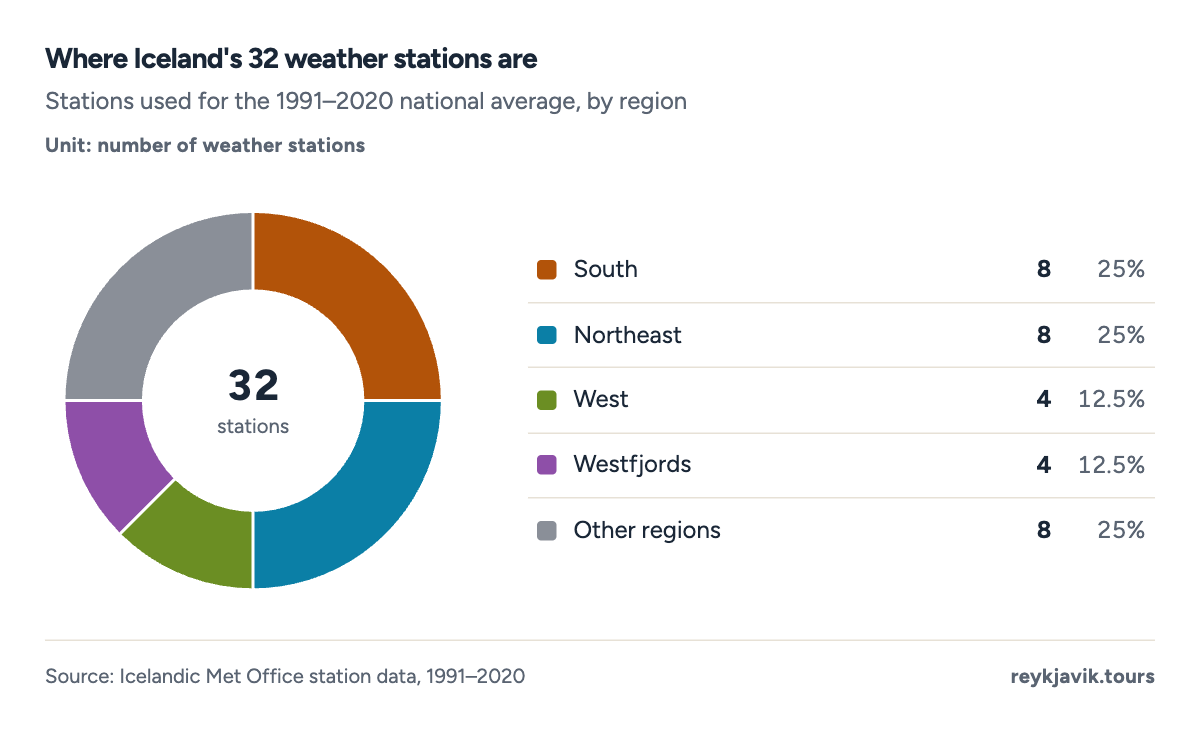
- The South and the Northeast each have 8 of the 32 stations.
- The Southern Peninsula has 1 station, so its average rests on Keflavík Airport alone.
| 1 | Southern Peninsula | 7.0 | 1 |
| 2 | Northwest | 6.2 | 2 |
| 3 | South | 5.7 | 8 |
| 4 | West | 5.3 | 4 |
| 5 | Westfjords | 4.8 | 4 |
| 6 | Northeast | 4.7 | 8 |
| 7 | Capital Region | 4.6 | 2 |
| 8 | East | 4.5 | 3 |
Regional averages help with planning, but they are not where most people meet the wind. For most visitors that happens in one place: the arrivals area at Keflavík.
Keflavík Airport: the first gust visitors meet
Keflavík Airport sits on the flat, open Reykjanes peninsula, exposed to weather from almost every direction. Its long-term average of 7.0 m/s1 is one of the highest in the country, and in February it climbs to 8.1 m/s1. Even its calmest month, July, averages 5.5 m/s1, higher than the national average for the year as a whole.
That makes the airport a misleading first impression. In February, Keflavík's average is 47%1 higher than Reykjavík's, so the wind that greets travellers outside the terminal is stronger than the wind they will usually find in the city.
Reykjavík average wind speed (m/s)
Reykjavík averages 4.6 m/s1 (16 km/h, 10 mph), well below the national figure. Buildings, trees and low hills slow the wind near the ground, and the city's station reflects that.
The seasons still show. February is the windiest month at 5.5 m/s1 and July the calmest at 3.5 m/s1. From May to September, the monthly average stays below 4.5 m/s1.
- 5.3JanJ
- 5.5FebF
- 5.2MarM
- 4.8AprA
- 4.4MayM
- 3.8JunJ
- 3.5JulJ
- 3.7AugA
- 4.4SepS
- 4.4OctO
- 4.9NovN
- 5.1DecD
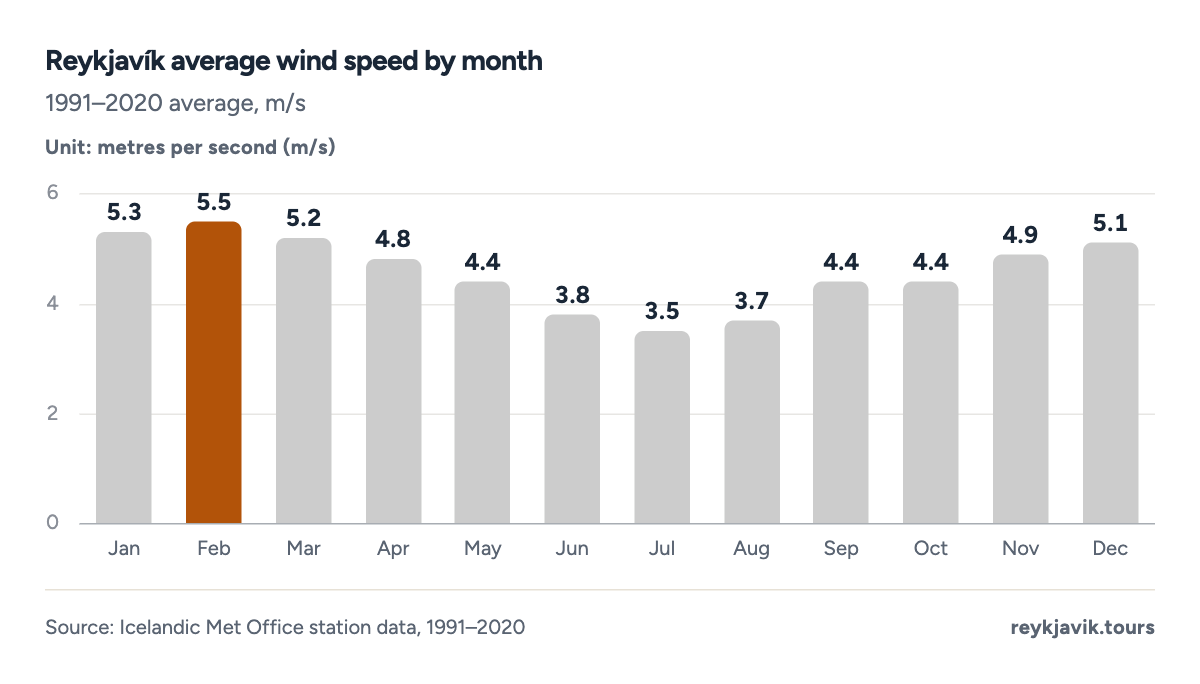
- February is Reykjavík's windiest month at 5.5 m/s.
- July is the calmest at 3.5 m/s.
Akureyri: the calm north
On the north coast, Akureyri shows how much shelter matters. The town lies at the head of the long Eyjafjörður fjord, ringed by mountains, and averages only 3.7 m/s1. Its seasons barely differ: the windiest month, January, averages 4.0 m/s1, and the calmest, August, 3.4 m/s1.
Wind speed by month
Across all 32 stations, the wind follows the seasons closely.
- 6.1JanJ
- 6.1FebF
- 5.9MarM
- 5.4AprA
- 4.9MayM
- 4.4JunJ
- 4.0JulJ
- 4.0AugA
- 4.9SepS
- 5.2OctO
- 5.5NovN
- 5.8DecD
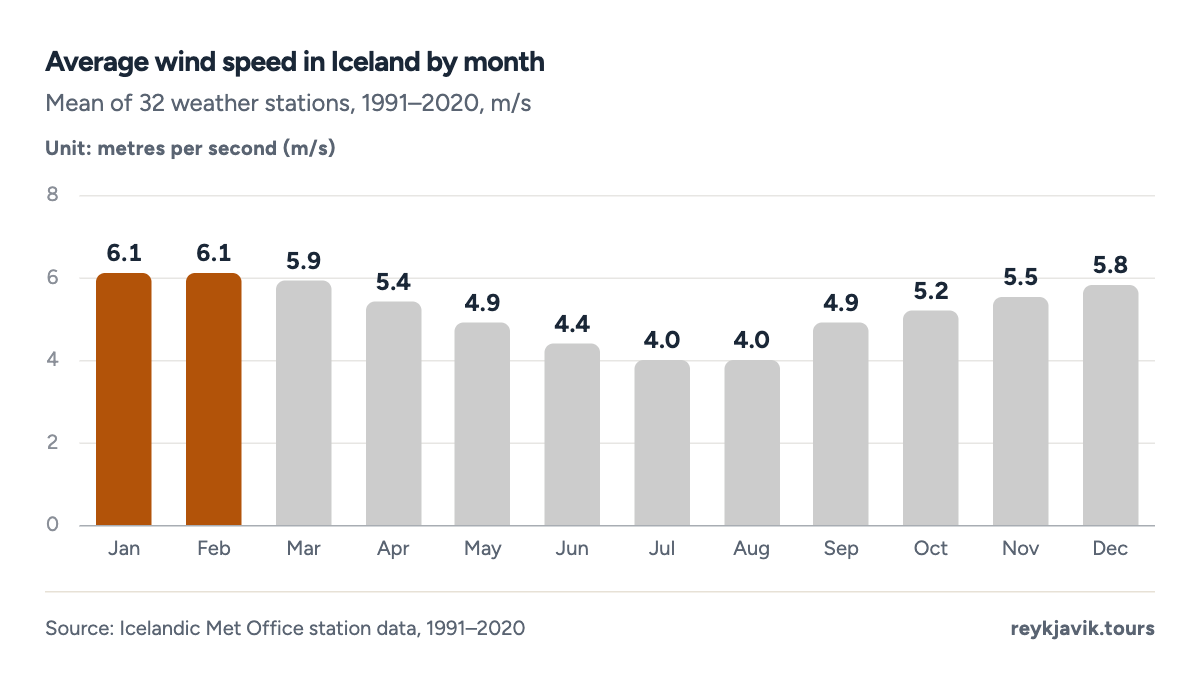
- January and February both average 6.1 m/s.
- July and August both average 4.0 m/s.
Windiest and calmest months
January and February are the windiest months, both averaging 6.1 m/s1. That is when the Atlantic low-pressure systems that sweep past Iceland are at their strongest. The wind eases through spring, reaches its low of 4.0 m/s1 in July and August, and builds again from September.
Winter vs summer
Winter, December to February, averages 6.0 m/s1; summer, June to August, 4.1 m/s1. The difference of 45%1 means that the month you travel matters more than most people expect:
- December to March: the windiest stretch, every month at 5.8 m/s1 or more
- April, May, October and November: transition months between 4.91 and 5.5 m/s1
- June to September: the calmest stretch, between 4.01 and 4.9 m/s1
The table compares the monthly averages for the whole country with four places most visitors pass through.
| January | 6.1 | 5.3 | 4.0 | 4.5 | 7.9 |
| February | 6.1 | 5.5 | 3.9 | 4.7 | 8.1 |
| March | 5.9 | 5.2 | 3.8 | 4.4 | 7.7 |
| April | 5.4 | 4.8 | 3.7 | 4.2 | 7.3 |
| May | 4.9 | 4.4 | 3.9 | 3.8 | 6.6 |
| June | 4.4 | 3.8 | 3.7 | 3.5 | 5.7 |
| July | 4.0 | 3.5 | 3.5 | 3.0 | 5.5 |
| August | 4.0 | 3.7 | 3.4 | 3.0 | 5.8 |
| September | 4.9 | 4.4 | 3.4 | 3.7 | 6.8 |
| October | 5.2 | 4.4 | 3.4 | 4.0 | 6.9 |
| November | 5.5 | 4.9 | 3.6 | 4.2 | 7.6 |
| December | 5.8 | 5.1 | 3.9 | 4.2 | 7.8 |
Vík, Iceland: September average wind speed
Vík í Mýrdal, the south coast village known for its black sand beach, is calmer than its dramatic setting suggests. In September its average wind speed is 3.7 m/s1 (13 km/h, 8 mph), below the national September average of 4.9 m/s1. Over the year, Vík's windiest month is February at 4.7 m/s1, while July and August both average about 3.0 m/s1.
One caveat: the Met Office's monthly record for Vík runs from 1991 to 2013, so these figures cover 23 years rather than the full 30. A monthly average also hides local effects. Along this coast, gusts squeezed between mountains and the sea can be far stronger than the mean suggests.
- 4.5JanJ
- 4.7FebF
- 4.4MarM
- 4.2AprA
- 3.8MayM
- 3.5JunJ
- 3.0JulJ
- 3.0AugA
- 3.7SepS
- 4.0OctO
- 4.2NovN
- 4.2DecD
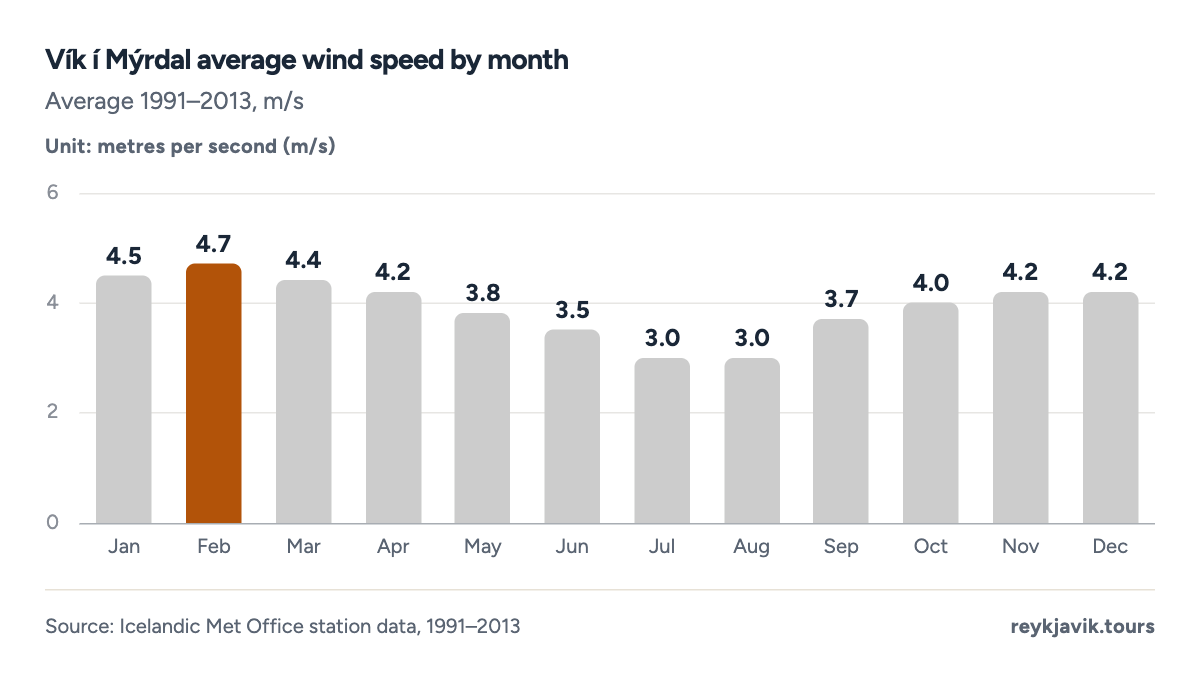
- September averages 3.7 m/s in Vík.
- Vík's windiest month, February, averages 4.7 m/s.
From one village in one month to a whole continent: how does Iceland's wind compare with the rest of Europe?
Iceland vs Europe: the windiest country
Comparing countries needs one consistent measure, so this ranking uses the Global Wind Atlas, a high-resolution model of wind 10 metres above the ground built by the Technical University of Denmark and the World Bank.5 We averaged it over each country's land area, using Natural Earth country borders.6
Iceland comes out at 6.5 m/s5, the highest of any sovereign country in Europe. Only the Faroe Islands, a self-governing territory of Denmark, are windier at 8.0 m/s5. Ireland follows Iceland at 4.9 m/s5 and the United Kingdom at 4.5 m/s5. At the calm end of the list, Slovenia averages 1.2 m/s5.
The Atlas figure for Iceland is higher than the station average of 5.2 m/s because it covers the whole island, including the highlands, ridges and glaciers where few people live and few stations stand.
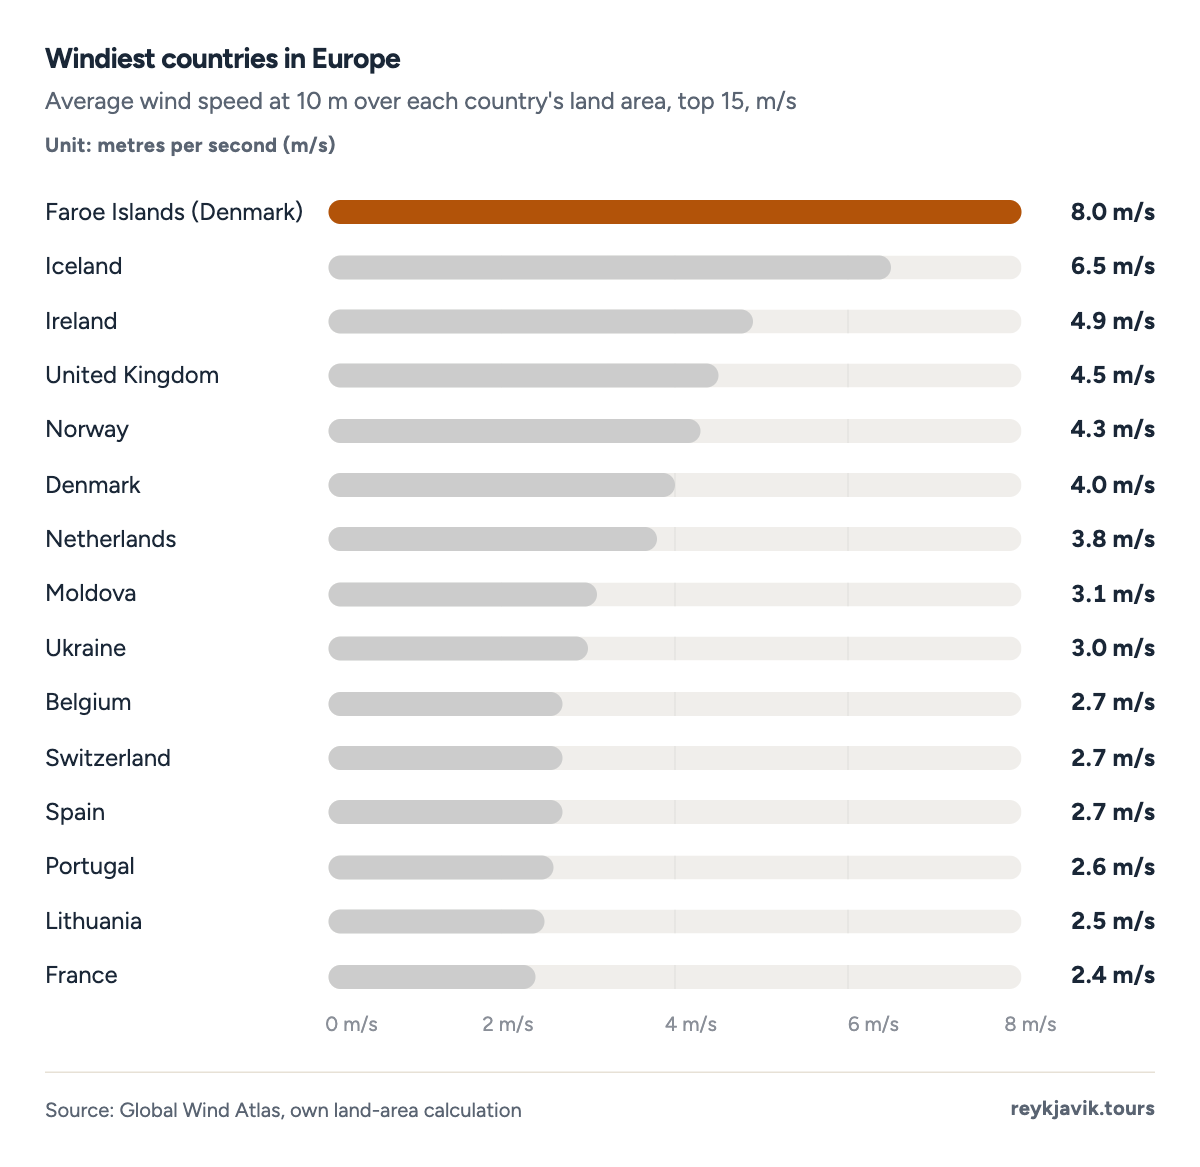
- Iceland averages 6.5 m/s across its land.
- That is 45% more than the United Kingdom's 4.5 m/s.
| 1 | Faroe Islands (Denmark) | 8.0 |
| 2 | Iceland | 6.5 |
| 3 | Ireland | 4.9 |
| 4 | United Kingdom | 4.5 |
| 5 | Norway | 4.3 |
| 6 | Denmark | 4.0 |
| 7 | Netherlands | 3.8 |
| 8 | Moldova | 3.1 |
| 9 | Ukraine | 3.0 |
| 10 | Belgium | 2.7 |
| 11 | Switzerland | 2.7 |
| 12 | Spain | 2.7 |
| 13 | Portugal | 2.6 |
| 14 | Lithuania | 2.5 |
| 15 | France | 2.4 |
| 16 | Poland | 2.4 |
| 17 | Cyprus | 2.4 |
| 18 | Germany | 2.4 |
| 19 | Albania | 2.3 |
| 20 | Hungary | 2.3 |
| 21 | Austria | 2.3 |
| 22 | Greece | 2.2 |
| 23 | Sweden | 2.2 |
| 24 | Luxembourg | 2.1 |
| 25 | Belarus | 2.1 |
| 26 | Estonia | 2.1 |
| 27 | Italy | 2.1 |
| 28 | Romania | 2.1 |
| 29 | Czechia | 2.0 |
| 30 | Latvia | 2.0 |
| 31 | Finland | 2.0 |
| 32 | Serbia | 2.0 |
| 33 | Montenegro | 1.9 |
| 34 | North Macedonia | 1.9 |
| 35 | Bulgaria | 1.9 |
| 36 | Slovakia | 1.7 |
| 37 | Croatia | 1.5 |
| 38 | Bosnia and Herzegovina | 1.4 |
| 39 | Slovenia | 1.2 |
Is Iceland getting less windy?
The Met Office's yearly summaries compare each year with the long-term average. 2020 was unusually windy, 0.6 m/s7 above average. Every year since has been at or below the 1991–2020 average: 0.2 m/s4 below in 2021, 0.1 m/s8 below in 2022, 0.2 m/s9 below in 2023, close to average in 202410 and 0.5 m/s11 below in 2025.
Five calm-leaning years in a row stand out, but they are not a trend. Wind varies strongly from one year to the next, and the 2020 summary does not say which baseline it used.
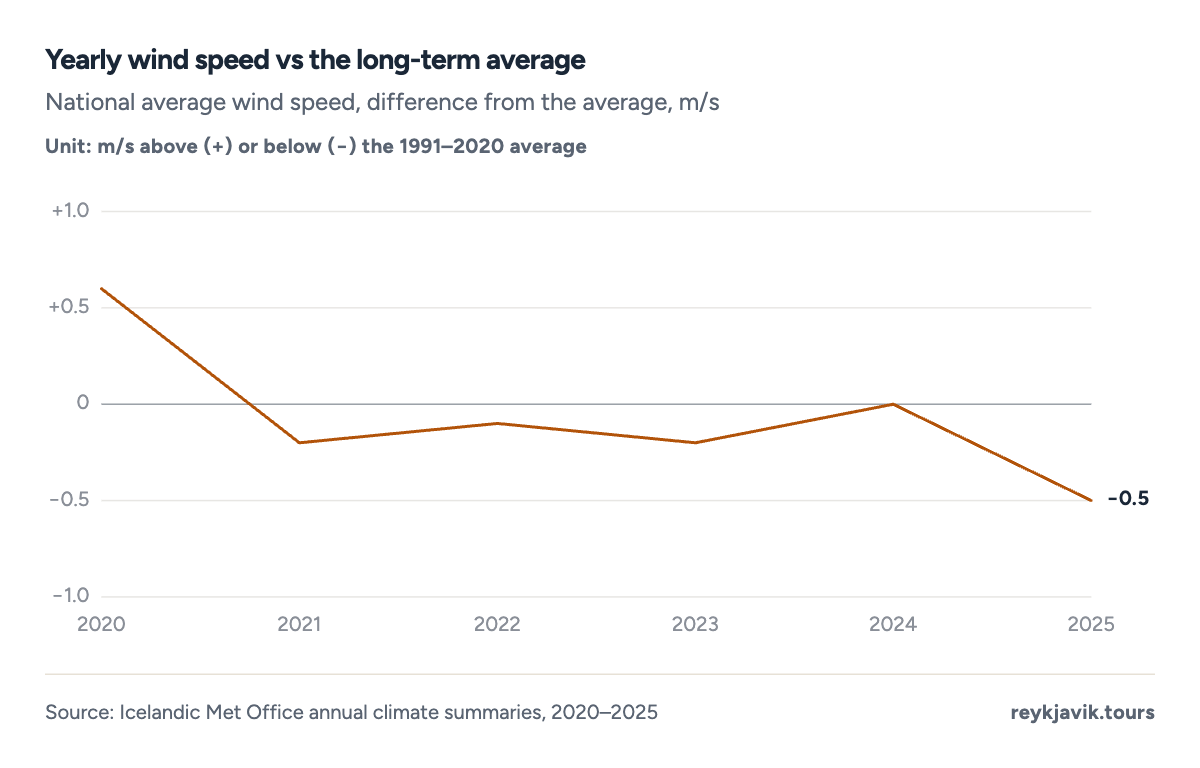
- 2020 was the only year above average, by 0.6 m/s.
- 2025 was the calmest year of the six, 0.5 m/s below average.
| 2020 | +0.6 | Average (period not stated) |
| 2021 | −0.2 | 1991–2020 average |
| 2022 | −0.1 | 1991–2020 average |
| 2023 | −0.2 | 1991–2020 average |
| 2024 | 0.0 | 1991–2020 average ("close to average") |
| 2025 | −0.5 | 1991–2020 average |
Wind above the lowlands
Weather stations measure the wind 10 metres above the ground, mostly near settlements. Higher up and further inland, it is much stronger. The Met Office's wind resource model puts wind speeds 50 metres above the highlands at 6–8 m/s12 in summer and 10–11 m/s12 in winter. In sheltered areas the same model gives about 3 m/s12 in summer and 5 m/s12 in winter.
That contrast is why the highlands come up whenever wind power in Iceland is discussed, and why a calm morning in a valley town says little about conditions on a mountain pass a short drive away.
What Iceland's wind feels like
Wind speed alone does not tell you how a day will feel. Moving air strips heat from the skin, so the same temperature feels much colder in a breeze. The Met Office describes this with a wind-chill index based on a model of the human face.13 At 0 °C, a 10 m/s wind makes it feel like −7 °C13. At −10 °C and 20 m/s, it feels like −23 °C13.
| 5 m/s (18 km/h) | 1 °C | −5 °C | −11 °C | −17 °C | −24 °C |
| 10 m/s (36 km/h) | 0 °C | −7 °C | −14 °C | −20 °C | −27 °C |
| 15 m/s (54 km/h) | −2 °C | −8 °C | −15 °C | −22 °C | −29 °C |
| 20 m/s (72 km/h) | −2 °C | −9 °C | −16 °C | −23 °C | −31 °C |
To translate wind speeds into what you will see and feel outdoors, the Beaufort scale is still the most practical guide. Iceland's national average sits at force 3, Keflavík's at force 4, and anything from 20.8 m/s2 upwards counts as a storm.
| 0 | Logn | 0–0.2 | Calm; smoke rises straight up |
| 1 | Andvari | 0.3–1.5 | Smoke drifts; flags hang still |
| 2 | Kul | 1.6–3.3 | Wind felt on the face; small flags stir |
| 3 | Gola | 3.4–5.4 | Light flags extended; leaves rustle |
| 4 | Stinningsgola | 5.5–7.9 | Loose paper blows; small branches sway |
| 5 | Kaldi | 8.0–10.7 | Small trees bend; ripples on water |
| 6 | Stinningskaldi | 10.8–13.8 | Large branches bend; umbrellas hard to use |
| 7 | Allhvass vindur | 13.9–17.1 | Whole trees sway; walking into the wind is tiring |
| 8 | Hvassviðri | 17.2–20.7 | Twigs and branches break; walking is difficult |
| 9 | Stormur | 20.8–24.4 | Minor damage to buildings; hard to keep balance |
| 10 | Rok | 24.5–28.4 | Trees uprooted; considerable damage |
| 11 | Ofsaveður | 28.5–32.6 | Widespread damage; dangerous to be outside |
| 12 | Fárviðri | 32.7 and above | Anything loose is blown away; roofs damaged |
What the wind means for life in Iceland
The averages in this report are calm enough to sound harmless, but life in Iceland is organised around the wind's extremes rather than its mean.
For travel, the month matters. From December to March the national monthly average stays at 5.8 m/s1 or more, and exposed places like Keflavík average about 8 m/s1 in winter months. Winter trips need slack in the schedule for weather; summer trips, when the national average falls to 4.0 m/s1, meet a much gentler country.
For health, the stake is cold rather than speed. A wind that counts as a gentle breeze on the Beaufort scale can turn a freezing day into one that feels like −7 °C13 on exposed skin. On a winter walk or a stop at a viewpoint, the felt temperature is the number to watch, not the thermometer.
For the economy, the wind is both a cost and a resource. The same highland winds that reach 10–11 m/s12 in winter make the interior a large untapped energy resource, alongside the hydropower and geothermal energy the country already relies on.
Conclusions
- The most quoted number understates Iceland's wind. The station average of 5.2 m/s1 describes the places where people live, mostly coastal lowlands and sheltered towns. The land itself averages 6.5 m/s5, enough to make Iceland the windiest sovereign country in Europe.
- First impressions mislead. Most visitors arrive at Keflavík, which averages 7.0 m/s1, and then stay in Reykjavík, at 4.6 m/s1. The wind that greets them is not the wind they will live with in the city, and the reverse is true the moment they drive into the highlands.
- Timing hides the real wind. The calmest months, June to August, fall in Iceland's busiest travel season. Most visitors meet a country about 30%1 calmer than its winter self, and leave with an impression gentler than the Icelandic year really is.
- The real stake is not speed but temperature and exposure. An average that sounds like a gentle breeze still turns 0 °C into −7 °C13, and a record gust more than twice the top of the Beaufort scale shows what the same air can do. For a trip, a road, a building or a wind farm, the useful question is not how windy Iceland is on average, but where, when and how exposed.
Methodology
- Period 1991–2020
- 32 weather stations
- 39 European countries
- Checked Sept 15, 2026
Definition. Average wind speed is the mean wind speed measured 10 m above the ground, in metres per second (1 m/s = 3.6 km/h = 2.24 mph).
Data sources. Station data from the Icelandic Met Office's monthly and annual values,1 records from its list of Icelandic weather records,3 yearly deviations from its annual climate summaries,11 and country averages from the Global Wind Atlas5 clipped to land with Natural Earth borders.6
Calculations. For every station with at least 20 of 30 years of wind data, we averaged its 1991–2020 annual values; the national figure is the mean of those 32 station averages. Monthly and regional figures use the same stations. Country figures are area-weighted means of Global Wind Atlas cells inside each country's land borders. Wind chill uses the face-model formula the Met Office describes and reproduces its published example.
Limitations. Stations are mostly lowland and coastal, and some have gaps: Vík's monthly record ends in 2013. Using only the nine complete-record stations gives 5.7 m/s instead of 5.2 m/s. The Southern Peninsula figure rests on one station, and the 2020 deviation is reported without a stated baseline.
Sources
- Veðurstofa Íslands (Icelandic Met Office). “Mánaðar- og ársgildi valinna veðurstöðva (monthly and annual values for selected weather stations).” Veðurstofa Íslands. vedur.is. Accessed 15 Sept. 2026. Back to text
- Jónsson, Trausti. “Nöfn vindstiga og greining veðurhæðar (names of wind force levels).” Veðurstofa Íslands, 21 Nov. 2007. vedur.is. Accessed 15 Sept. 2026. Back to text
- Veðurstofa Íslands (Icelandic Met Office). “Íslensk veðurmet (Icelandic weather records).” Veðurstofa Íslands. vedur.is. Accessed 15 Sept. 2026. Back to text
- Veðurstofa Íslands. “Tíðarfar ársins 2021.” Veðurstofa Íslands, 20 Jan. 2022. vedur.is. Accessed 15 Sept. 2026. Back to text
- Technical University of Denmark (DTU) and World Bank. “Global Wind Atlas 3: mean wind speed at 10 m.” Global Wind Atlas. globalwindatlas.info. Accessed 15 Sept. 2026. Back to text
- Natural Earth. “Admin 0 – Countries, 1:10m.” Natural Earth. naturalearthdata.com. Accessed 15 Sept. 2026. Back to text
- Veðurstofa Íslands. “Tíðarfar ársins 2020.” Veðurstofa Íslands, 19 Jan. 2021. vedur.is. Accessed 15 Sept. 2026. Back to text
- Veðurstofa Íslands. “Tíðarfar ársins 2022.” Veðurstofa Íslands, 1 Feb. 2023. vedur.is. Accessed 15 Sept. 2026. Back to text
- Veðurstofa Íslands. “Tíðarfar ársins 2023.” Veðurstofa Íslands, 29 Jan. 2024. vedur.is. Accessed 15 Sept. 2026. Back to text
- Icelandic Met Office. “The weather in Iceland in 2024.” Icelandic Met Office, 5 Feb. 2025. en.vedur.is. Accessed 15 Sept. 2026. Back to text
- Veðurstofa Íslands. “Tíðarfar ársins 2025.” Veðurstofa Íslands, 28 Jan. 2026. vedur.is. Accessed 15 Sept. 2026. Back to text
- Veðurstofa Íslands. “Vindauðlindin á Íslandi (Iceland's wind resource).” Veðurstofa Íslands. vedur.is. Accessed 15 Sept. 2026. Back to text
- Sigurðsson, Árni. “Wind-chill table.” Icelandic Met Office, 26 Feb. 2010. en.vedur.is. Accessed 15 Sept. 2026. Back to text
About the author
Laufey turns public statistics on tourism and travel into research people can check and cite.
Every figure on this page links to its source. How we research
Related research
More data on Iceland's weather and travel from Reykjavik Tours.
- WeatherIceland Temperature by Month (2026 Data)39 °F average temperature in IcelandRead the research →
- WeatherIceland Weather by Month (2026 Data)4.5 in rain in September, Iceland's wettest monthRead the research →
- WeatherIceland Daylight Hours by Month (2026 Data)21.2 h of daylight in Reykjavík on the longest dayRead the research →
- WeatherHow Much Snow Does Iceland Get? (2026 Data)55 days a year with snow on the ground in ReykjavíkRead the research →
- TravelHow Many Days in Iceland? (2026 Data)7.1 nights average stay of foreign visitorsRead the research →
- Travel planningHow Often Can You See the Northern Lights in Iceland? (2026 Data)~50% chance of aurora on any dark-season nightRead the research →