Iceland Temperature by Month (2026 Data)
How warm or cold Iceland is in every month, from daytime highs to night lows, in Reykjavík and around the country, and where the trend is heading.
- Published
- Updated
- 9 sources
- 63 statistics
- 9 min read

- M.Sc. in Atmospheric Sciences, University of Iceland (Háskóli Íslands), with a minor thesis on North Atlantic storm-track variability
- Former research assistant at the Icelandic Meteorological Office (Veðurstofa Íslands), working on subarctic climate modeling and volcanic-ash dispersion forecasting
- B.A. in Sociology, also from the University of Iceland, with fieldwork on rural depopulation and tourism's impact on small fishing communities (Westfjords focus)
- Grew up in Akureyri, spent seven years living in Reykjavík and two in a small village in the Westfjords - brings first-hand experience of Iceland's regional weather extremes and community life
- Fluent in Icelandic and English; has translated Icelandic Met Office public advisories for international outlets
- Published field notes and data-driven pieces on glacier retreat (Vatnajökull), aurora forecasting, and the socioeconomic effects of overtourism in the Golden Circle

- M.A. in Journalism, University of Iceland, with additional coursework in Environmental Communication at the University of Bergen (Norway), giving a comparative Nordic lens
- 12+ years in Icelandic media, including editorial roles at RÚV (Iceland's national broadcaster) covering weather-related public safety reporting (storms, volcanic eruptions, road closures)
- Former fact-checking lead for a travel-and-culture desk, specializing in verifying tourism statistics, safety advisories, and climate data against primary sources (Vedur.is, Statistics Iceland)
- Has overseen editorial standards for bilingual (Icelandic/English) publications, ensuring both cultural nuance and accuracy for international readers
- Advocate for citing primary sources (Icelandic Met Office, Icelandic Tourist Board / Ferðamálastofa) rather than secondhand reporting
Key findings
- 31–51 °FIceland's average temperature by month ranges from 31–51 °F (−0.6 to 10.5 °C), coldest in February and warmest in July.
- 39 °FThe average temperature in Iceland is 39 °F (4.1 °C) over the year.
- 57 °FIn July, Iceland's average daily high is 57 °F (14.1 °C) and the average low 46 °F (7.7 °C).
- 41 °FReykjavík's average temperature is 41 °F (5.1 °C), 2 °F warmer than Iceland as a whole.
- 35 °FIceland is the coldest country in Europe, averaging 35 °F (1.8 °C) across its whole land area.
- 2.0 °FIceland's warmest year on record was 2025, 2.0 °F (1.1 °C) above the 1991–2020 average.
- 87 °FIceland's highest recorded temperature is 87 °F (30.5 °C), measured at Teigarhorn on 22 June 1939.
Iceland's name promises ice, yet its coldest month averages 31 °F1 (−0.6 °C), barely below freezing. Measured across the whole country, January is milder here than in Norway, Sweden or Finland.2 The catch comes in summer: July, the warmest month, averages only 51 °F1 (10.5 °C), and no country in Europe has a cooler one. That mix of gentle winters and cool summers decides what you pack, how you drive and what "summer" means on a trip here.
The numbers hold a few surprises. 2025 was the warmest year ever measured in Iceland, straight after 2024, the coldest since 1998.3 The capital runs about 2 °F1 warmer than the country as a whole, and the northeast interior is colder still. This report uses three decades of Icelandic Met Office measurements to show how warm Iceland is in every month, in Reykjavík and around the country, and where the long-term trend points.
Iceland climate by month
Averaged across 30 Met Office weather stations for 1991–2020, the year follows a simple curve. December to March sit close to freezing, between 31 °F1 (−0.6 °C) and 32 °F1 (0.0 °C). Spring then warms quickly: April averages 36 °F1 (2.3 °C) and May 42 °F1 (5.5 °C). The short summer peaks in July at 51 °F1 (10.5 °C), and by October the monthly mean is back down to 39 °F1 (3.7 °C).
The whole range, from the coldest to the warmest month, is only about 20 °F1 (11 °C). Continental cities at the same latitude see far wider swings, because the sea around Iceland stores summer heat and releases it in winter.
- 31.7JanJ
- 31.0FebF
- 32.1MarM
- 36.1AprA
- 41.9MayM
- 47.7JunJ
- 51.0JulJ
- 50.4AugA
- 45.8SepS
- 38.7OctO
- 34.2NovN
- 31.8DecD
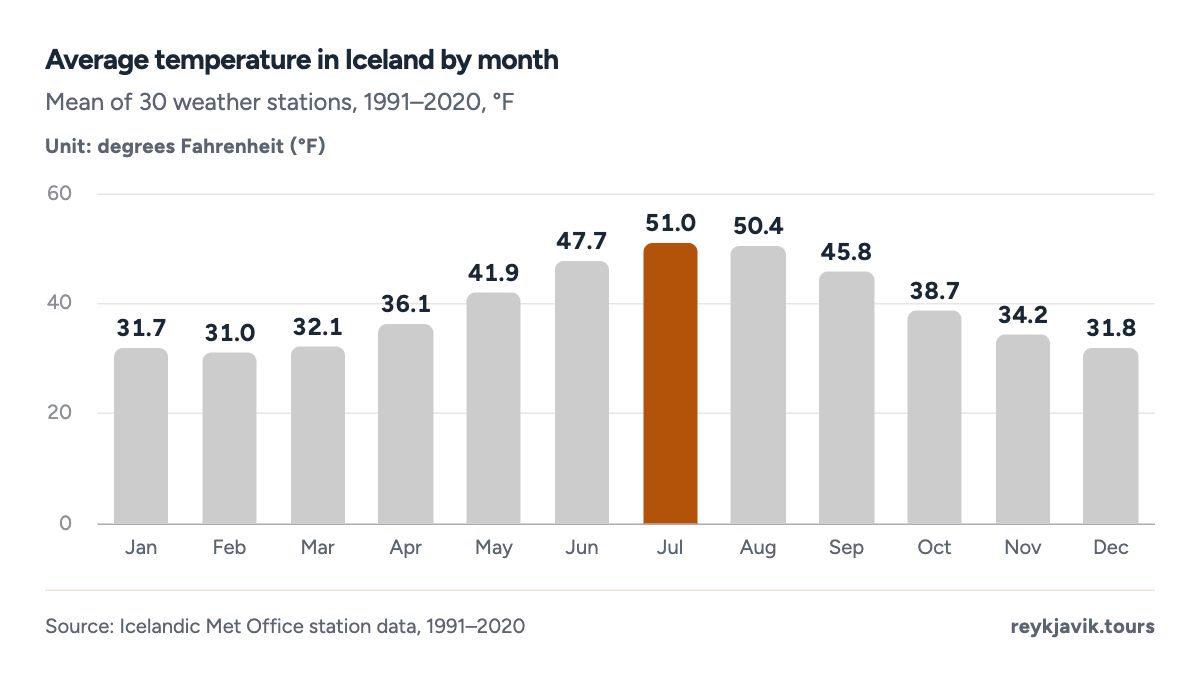
- July is the warmest month at 51.0 °F.
- February is the coldest at 31.0 °F.
- Four months, December to March, average below 36.1 °F.
A monthly mean hides the difference between day and night. On an average July day the temperature climbs to 57 °F1 (14.1 °C) and drops to 46 °F1 (7.7 °C) at night. In February the daily high reaches only 36 °F1 (2.4 °C), and the average night falls to 26 °F1 (−3.3 °C). From November to April the average night is below freezing, so frost and icy mornings are normal for half the year.
- Average high
- Mean
- Average low
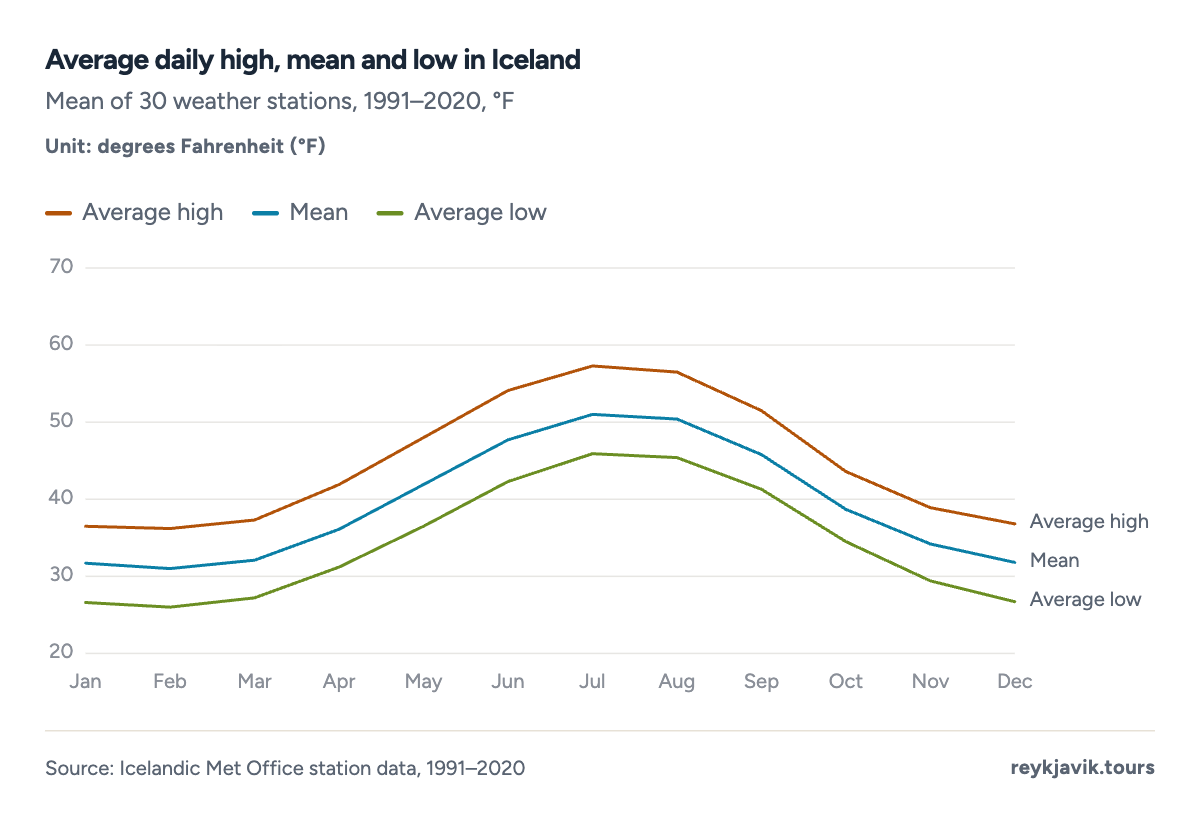
- The average July high is 57.3 °F.
- The average February low is 26.0 °F.
- The gap between the average high and low stays between 9 °F and 12 °F all year.
| January | 32 | −0.2 | 37 | 2.5 | 27 | −3.0 |
| February | 31 | −0.6 | 36 | 2.4 | 26 | −3.3 |
| March | 32 | 0.0 | 37 | 3.0 | 27 | −2.7 |
| April | 36 | 2.3 | 42 | 5.5 | 31 | −0.5 |
| May | 42 | 5.5 | 48 | 8.9 | 37 | 2.5 |
| June | 48 | 8.7 | 54 | 12.3 | 42 | 5.7 |
| July | 51 | 10.5 | 57 | 14.1 | 46 | 7.7 |
| August | 50 | 10.2 | 57 | 13.6 | 45 | 7.5 |
| September | 46 | 7.7 | 51 | 10.8 | 41 | 5.2 |
| October | 39 | 3.7 | 44 | 6.5 | 35 | 1.4 |
| November | 34 | 1.2 | 39 | 3.8 | 29 | −1.4 |
| December | 32 | −0.1 | 37 | 2.7 | 27 | −2.9 |
Average temperature in Iceland
Over the whole year, the weather stations average 39 °F1 (4.1 °C). The Met Office does not publish a national table by month, so this report calculates it from the Met Office's own station records: every station with at least 20 complete years between 1991 and 2020, averaged month by month. The yearly result matches the Met Office's published national figure: its summary for 2025 reports 41 °F3 (5.2 °C), 2.0 °F3 (1.1 °C) above the 1991–2020 average, which puts that average at 4.1 °C.
Weather stations stand where people live, mostly along the coast and in lowland valleys. Measured across the entire island, including the highlands and glaciers where almost nobody lives, the yearly average drops to 35 °F2 (1.8 °C). Both numbers are right; they describe different places. For a trip that stays on the Ring Road, the station figure is the useful one.
A yearly average smooths over a lot. For planning, the month you travel matters far more than the number for the year.
Month by month
Average temperature in Iceland in January
January averages 32 °F1 (−0.2 °C), with an average daily high of 37 °F1 (2.5 °C) and an average low of 27 °F1 (−3.0 °C). Days are short, and the average night is well below freezing.
Average temperature in Iceland in February
February averages 31 °F1 (−0.6 °C), with an average daily high of 36 °F1 (2.4 °C) and an average low of 26 °F1 (−3.3 °C). The coldest month on average, though rarely far below freezing near the coast.
Average temperature in Iceland in March
March averages 32 °F1 (0.0 °C), with an average daily high of 37 °F1 (3.0 °C) and an average low of 27 °F1 (−2.7 °C). Still wintry: the average high is barely above the January figure.
Average temperature in Iceland in April
April averages 36 °F1 (2.3 °C), with an average daily high of 42 °F1 (5.5 °C) and an average low of 31 °F1 (−0.5 °C). Spring arrives by day, but the average night is still around freezing.
Average temperature in Iceland in May
May averages 42 °F1 (5.5 °C), with an average daily high of 48 °F1 (8.9 °C) and an average low of 37 °F1 (2.5 °C). The first month with nights clearly above freezing on average.
Average temperature in Iceland in June
June averages 48 °F1 (8.7 °C), with an average daily high of 54 °F1 (12.3 °C) and an average low of 42 °F1 (5.7 °C). Long light and mild afternoons; evenings stay cool.
Average temperature in Iceland in July
July averages 51 °F1 (10.5 °C), with an average daily high of 57 °F1 (14.1 °C) and an average low of 46 °F1 (7.7 °C). The warmest month, with the highest average daytime temperature of the year.
Average temperature in Iceland in August
August averages 50 °F1 (10.2 °C), with an average daily high of 57 °F1 (13.6 °C) and an average low of 45 °F1 (7.5 °C). Almost as warm as July, and the nights are just as mild.
Average temperature in Iceland in September
September averages 46 °F1 (7.7 °C), with an average daily high of 51 °F1 (10.8 °C) and an average low of 41 °F1 (5.2 °C). Autumn begins, but September is only about 2 °F cooler than June.
Average temperature in Iceland in October
October averages 39 °F1 (3.7 °C), with an average daily high of 44 °F1 (6.5 °C) and an average low of 35 °F1 (1.4 °C). The mean falls fast; the average night is only just above freezing.
Average temperature in Iceland in November
November averages 34 °F1 (1.2 °C), with an average daily high of 39 °F1 (3.8 °C) and an average low of 29 °F1 (−1.4 °C). Nights drop below freezing on average again.
Average temperature in Iceland in December
December averages 32 °F1 (−0.1 °C), with an average daily high of 37 °F1 (2.7 °C) and an average low of 27 °F1 (−2.9 °C). About as cold as January, with the shortest days of the year.
Summer vs winter
Average summer temperature in Iceland
From June to August the stations average 50 °F1 (9.8 °C). That is cool by European standards: a summer afternoon is more like a spring day further south, and a sweater is still useful in the evening.
Average winter temperature in Iceland
From December to February the average is 32 °F1 (−0.3 °C), just below freezing. The difference between summer and winter is only about 18 °F1 (10 °C).
- Winter (Dec–Feb): around freezing, nights below it
- Spring (Mar–May): from winter-like March to a mild May
- Summer (Jun–Aug): cool and steady, highs in the 50s °F
- Autumn (Sep–Nov): a fast slide from September warmth back to freezing nights
Reykjavik temperature by month
The capital is milder than the country as a whole, especially in winter. January and February in Reykjavík average 33 °F1 (0.7 °C) and 33 °F1 (0.6 °C), above freezing. July averages 53 °F1 (11.6 °C), with an average daily high of 59 °F1 (14.9 °C).
- 33.2JanJ
- 33.0FebF
- 34.1MarM
- 38.6AprA
- 44.1MayM
- 49.7JunJ
- 52.9JulJ
- 51.9AugA
- 47.3SepS
- 40.7OctO
- 36.0NovN
- 33.4DecD
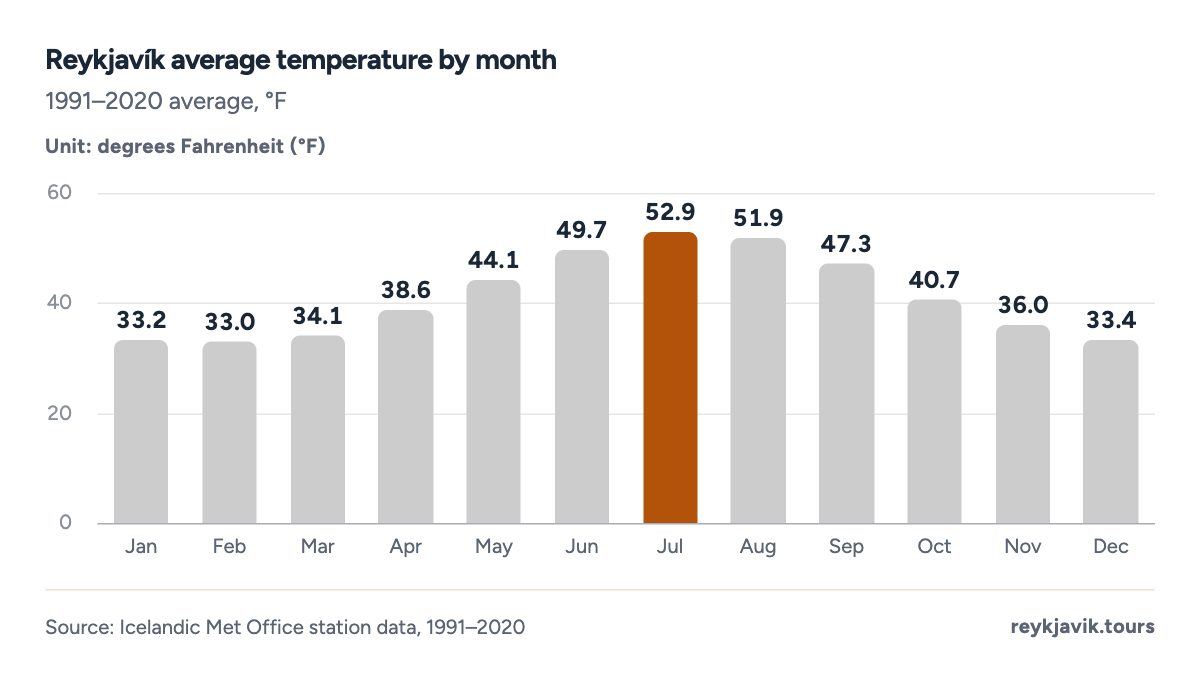
- Reykjavík's warmest month is July at 52.9 °F.
- Even February averages 33.0 °F, above freezing.
| January | 33 | 0.7 | 38 | 3.2 | 29 | −1.7 |
| February | 33 | 0.6 | 38 | 3.4 | 29 | −1.9 |
| March | 34 | 1.2 | 40 | 4.2 | 30 | −1.3 |
| April | 39 | 3.7 | 44 | 6.9 | 34 | 1.1 |
| May | 44 | 6.7 | 50 | 10.1 | 39 | 4.0 |
| June | 50 | 9.8 | 55 | 13.0 | 45 | 7.2 |
| July | 53 | 11.6 | 59 | 14.9 | 48 | 9.1 |
| August | 52 | 11.1 | 57 | 14.1 | 48 | 8.6 |
| September | 47 | 8.5 | 53 | 11.5 | 43 | 6.3 |
| October | 41 | 4.9 | 46 | 7.6 | 37 | 2.7 |
| November | 36 | 2.2 | 40 | 4.7 | 32 | −0.1 |
| December | 33 | 0.8 | 38 | 3.4 | 29 | −1.6 |
Reykjavik average temperature
Over the year, Reykjavík averages 41 °F1 (5.1 °C), about 2 °F1 warmer than the national station average. Recent years have swung on both sides of that figure: 2024 averaged 40 °F4 (4.3 °C) and 2025 43 °F3 (6.1 °C).
Warmest and coldest places in Iceland
The warmest weather stations line the south coast, where the sea is mildest. Vík í Mýrdal averages 43 °F1 (5.9 °C), the highest of the 30 stations. The coldest sit inland in the northeast, far from the sea and higher up: Grímsstaðir á Fjöllum averages only 35 °F1 (1.4 °C), and in February its average night falls to 18 °F1 (−7.7 °C).
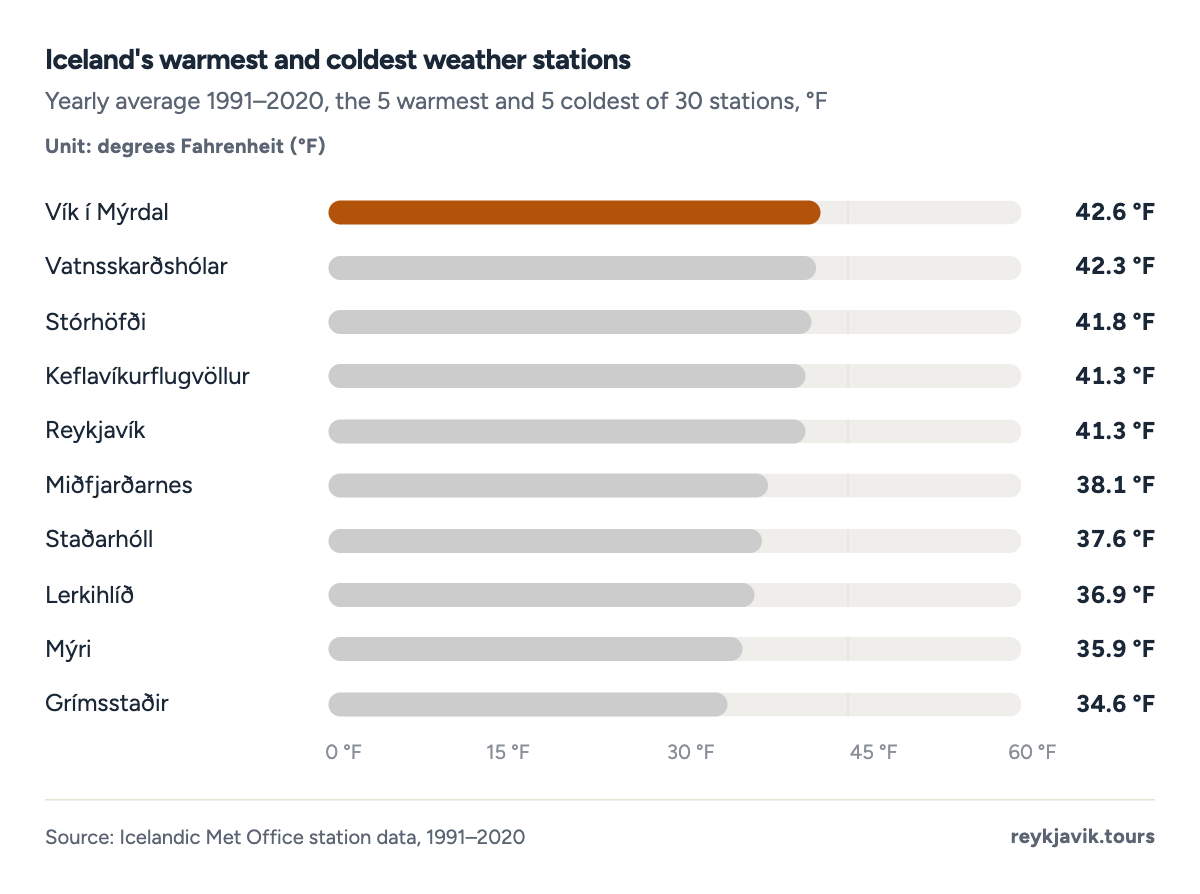
- Vík í Mýrdal is the warmest station at 42.6 °F.
- Grímsstaðir is the coldest at 34.6 °F.
| 1 | Vík í Mýrdal | South | 42.6 | 5.9 | Jul | Feb |
| 2 | Vatnsskarðshólar | South | 42.3 | 5.7 | Jul | Feb |
| 3 | Stórhöfði | South | 41.8 | 5.5 | Jul | Feb |
| 4 | Keflavíkurflugvöllur | Southern Peninsula | 41.3 | 5.2 | Jul | Feb |
| 5 | Reykjavík | Capital Region | 41.3 | 5.1 | Jul | Feb |
| 6 | Kirkjubæjarklaustur | South | 41.2 | 5.1 | Jul | Feb |
| 7 | Bláfeldur | West | 41.0 | 5.0 | Jul | Feb |
| 8 | Eyrarbakki | South | 40.7 | 4.9 | Jul | Dec |
| 9 | Stykkishólmur | West | 40.0 | 4.5 | Jul | Feb |
| 10 | Lambavatn | Westfjords | 40.0 | 4.5 | Jul | Feb |
| 11 | Dalatangi | East | 40.0 | 4.4 | Aug | Mar |
| 12 | Hæll | South | 39.7 | 4.3 | Jul | Feb |
| 13 | Akureyri | Northeast | 39.6 | 4.2 | Jul | Feb |
| 14 | Sauðanesviti | Northeast | 39.5 | 4.2 | Aug | Feb |
| 15 | Hjarðarland | South | 39.4 | 4.1 | Jul | Dec |
| 16 | Hólar í Dýrafirði | Westfjords | 39.2 | 4.0 | Jul | Feb |
| 17 | Ásgarður | West | 38.9 | 3.9 | Jul | Feb |
| 18 | Bolungarvík | Westfjords | 38.9 | 3.9 | Jul | Feb |
| 19 | Skjaldþingsstaðir | East | 38.9 | 3.8 | Jul | Feb |
| 20 | Litla-Ávík | Westfjords | 38.9 | 3.8 | Aug | Feb |
| 21 | Mánárbakki | Northeast | 38.8 | 3.8 | Aug | Feb |
| 22 | Stafholtsey | West | 38.6 | 3.7 | Jul | Feb |
| 23 | Bergstaðir | Northwest | 38.5 | 3.6 | Jul | Feb |
| 24 | Svínafell | East | 38.4 | 3.6 | Jul | Feb |
| 25 | Hraun á Skaga | Northwest | 38.3 | 3.5 | Aug | Feb |
| 26 | Miðfjarðarnes | Northeast | 38.1 | 3.4 | Aug | Feb |
| 27 | Staðarhóll | Northeast | 37.6 | 3.1 | Jul | Feb |
| 28 | Lerkihlíð | Northeast | 36.9 | 2.7 | Jul | Feb |
| 29 | Mýri | Northeast | 35.9 | 2.2 | Jul | Feb |
| 30 | Grímsstaðir | Northeast | 34.6 | 1.4 | Jul | Feb |
By region
Grouped into Iceland's eight regions, the south and the capital area are warmest, both around 41 °F1 (5.1 °C). The Northeast, with its high inland plateau, is the coldest region at 38 °F1 (3.1 °C).
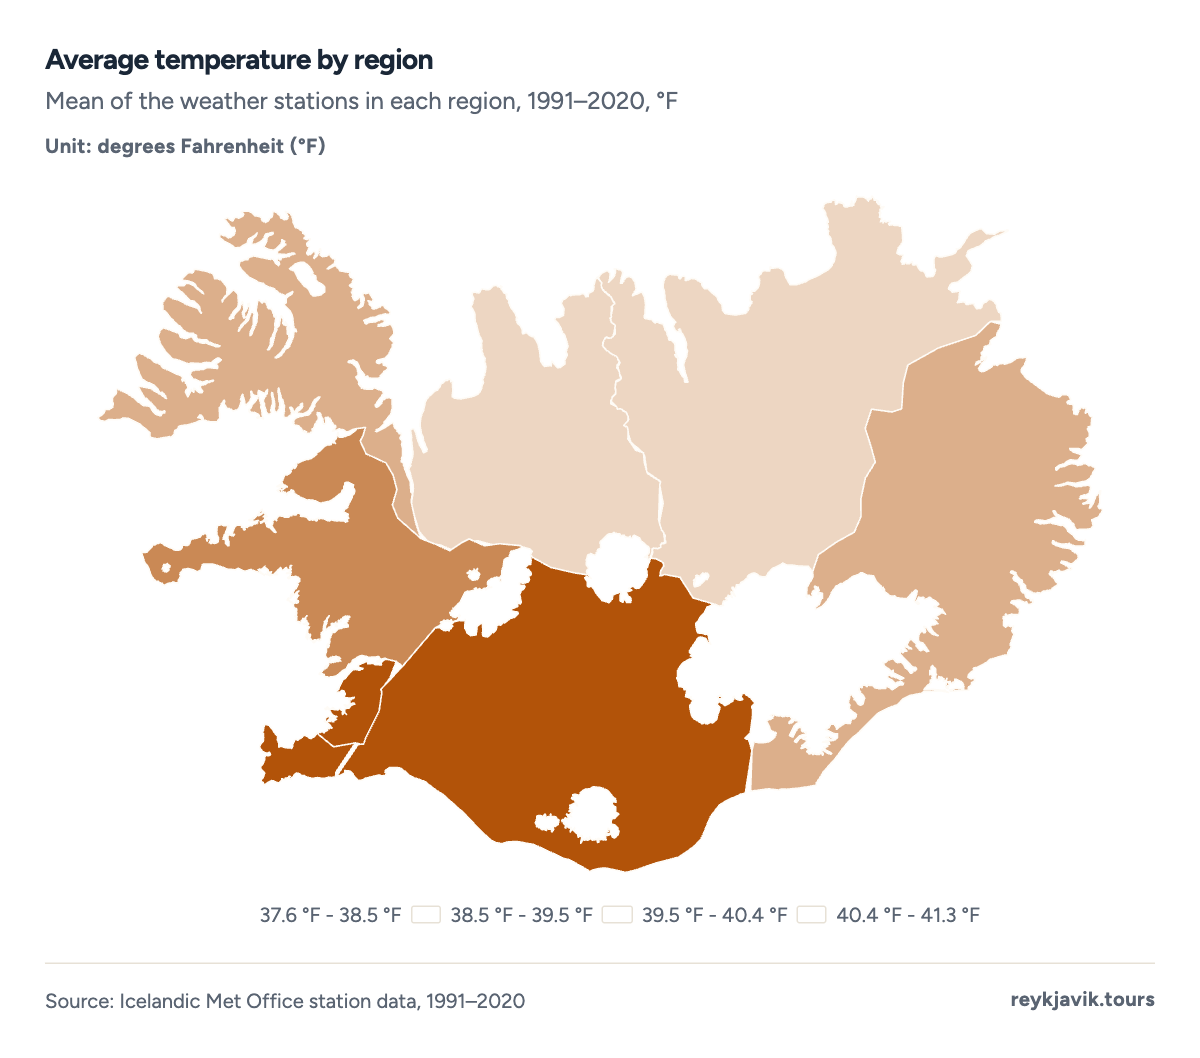
- The Southern Peninsula and the Capital Region average 41.3 °F.
- The Northeast is the coldest region at 37.6 °F.
Akureyri and the north
Akureyri, the largest town in the north, averages 40 °F1 (4.2 °C) over the year. Its winters are colder than Reykjavík's, with January and February at 31 °F1 (−0.8 °C), but its summer afternoons are just as warm: the average July high is 59 °F1 (15.1 °C), slightly above the capital's. A colder winter and an equally warm summer afternoon: the north has the bigger seasonal swing.
- Iceland
- Reykjavík
- Akureyri
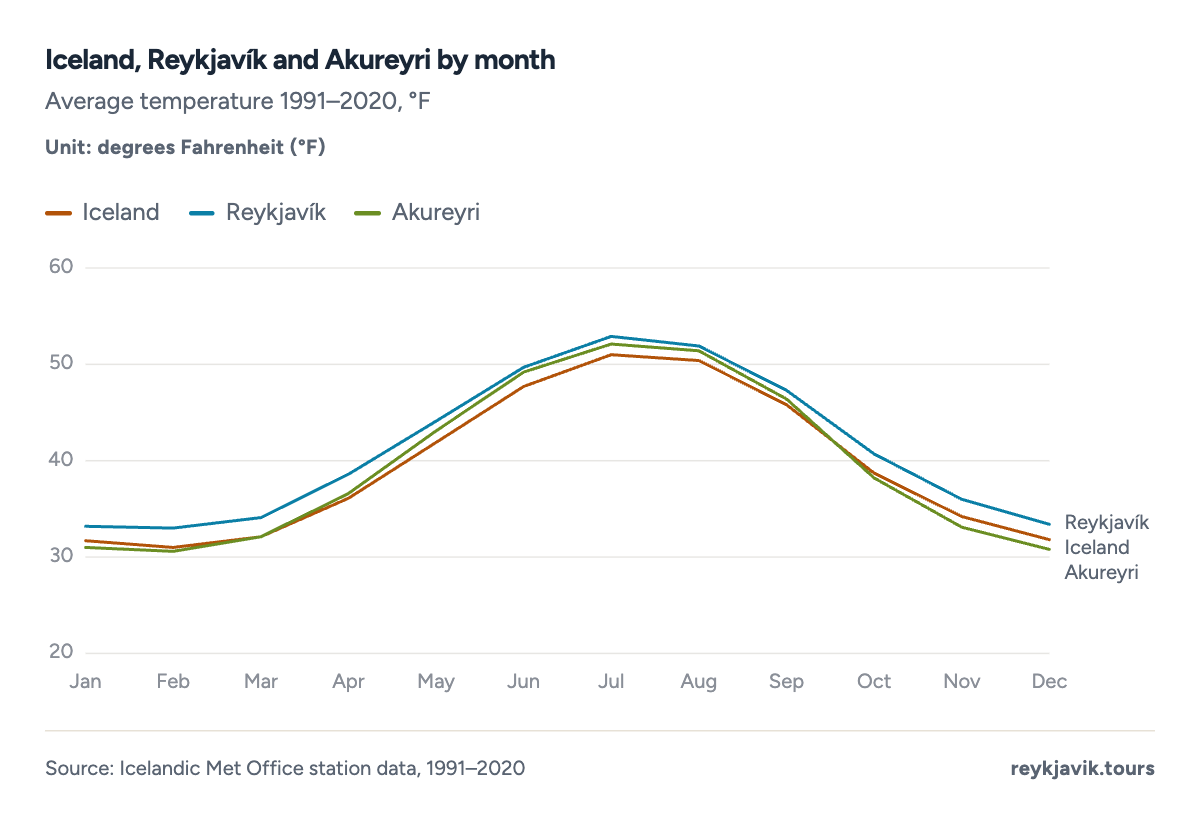
- In February, Reykjavík averages 33.0 °F and Akureyri 30.6 °F.
- In July, both towns average above 52.1 °F.
| January | 32 | 33 | 31 | 36 | 25 |
| February | 31 | 33 | 31 | 35 | 25 |
| March | 32 | 34 | 32 | 36 | 26 |
| April | 36 | 39 | 37 | 40 | 30 |
| May | 42 | 44 | 43 | 45 | 38 |
| June | 48 | 50 | 49 | 49 | 46 |
| July | 51 | 53 | 52 | 53 | 49 |
| August | 50 | 52 | 51 | 52 | 48 |
| September | 46 | 47 | 46 | 48 | 42 |
| October | 39 | 41 | 38 | 42 | 33 |
| November | 34 | 36 | 33 | 38 | 28 |
| December | 32 | 33 | 31 | 36 | 25 |
So how hot, and how cold, can it actually get?
Temperature records in Iceland
The highest temperature ever measured in Iceland is 87 °F5 (30.5 °C), at Teigarhorn on the east coast on 22 June 1939. The lowest is -36 °F5 (−38.0 °C), recorded at Grímsstaðir and Möðrudalur in the northeast interior on 21 January 1918.
Reykjavík's own records are far less extreme: 78 °F5 (25.7 °C) on 30 July 2008 and -12 °F5 (−24.5 °C) on 21 January 1918, the same day as the national low.
| Highest in Iceland | 87 | 30.5 | Teigarhorn | 22 June 1939 |
| Lowest in Iceland | −36 | −38.0 | Grímsstaðir and Möðrudalur | 21 January 1918 |
| Highest in Reykjavík | 78 | 25.7 | Reykjavík | 30 July 2008 |
| Lowest in Reykjavík | −12 | −24.5 | Reykjavík | 21 January 1918 |
Iceland vs Europe
To compare countries fairly, the World Bank's climate portal averages temperature over each country's entire land area. On that measure, Iceland is the coldest country in Europe at 35 °F2 (1.8 °C), just below Norway at 36 °F2 (2.2 °C) and Finland at 36 °F2 (2.4 °C).
The detail is more interesting than the ranking. Iceland has the coolest July in Europe, 48 °F2 (8.9 °C), cooler even than the Faroe Islands. Yet its land-wide January, 27 °F2 (−2.9 °C), is far milder than Sweden's 19 °F2 (−7.2 °C) or Finland's 15 °F2 (−9.5 °C). Iceland's climate is shaped by the ocean, not by the Arctic: cool all year, but rarely bitterly cold.
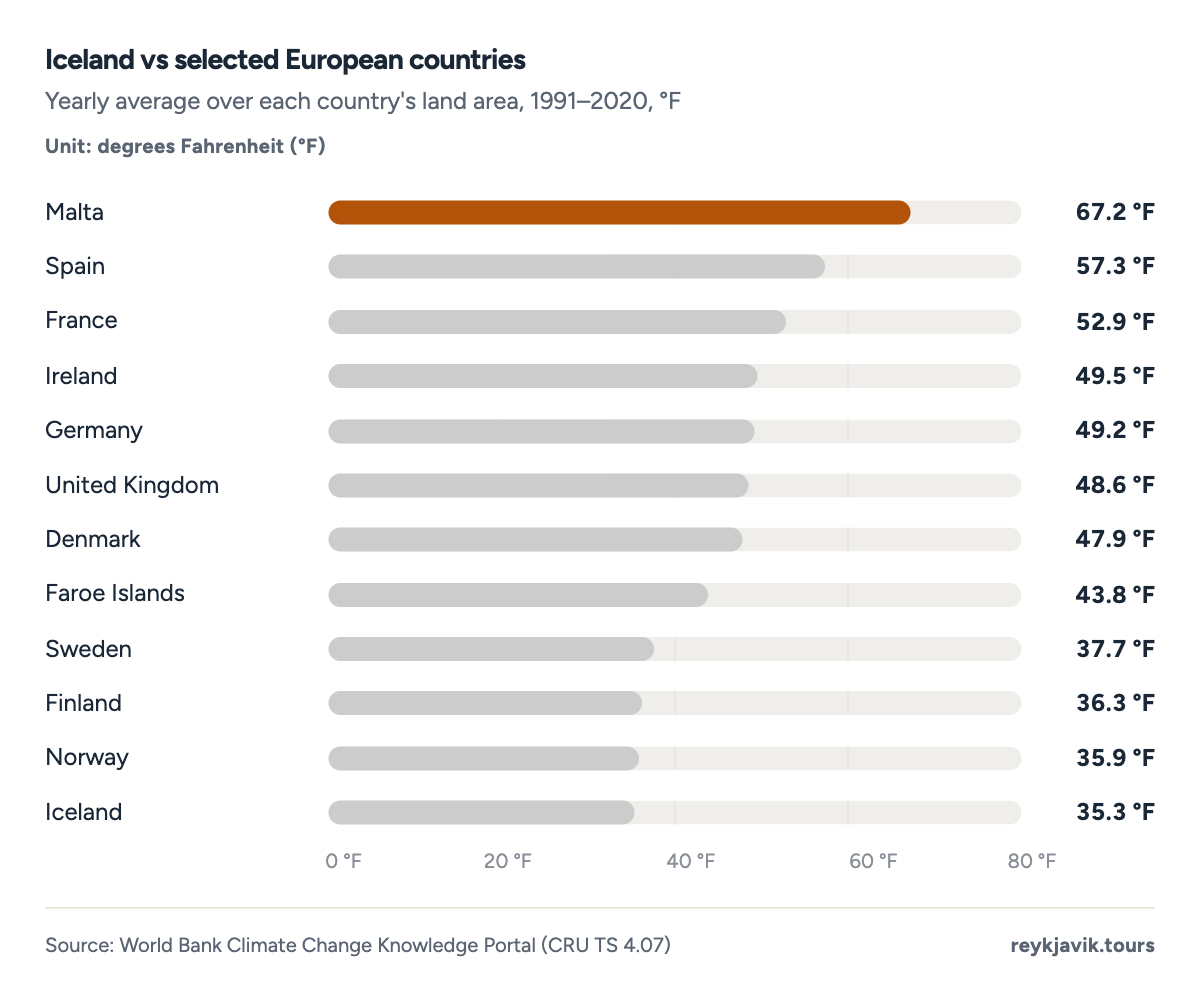
- Iceland averages 35.3 °F across its land, the lowest in Europe.
- Norway follows at 35.9 °F.
| 1 | Malta | 67.2 | 19.5 | 80 | 55 |
| 2 | Cyprus | 66.0 | 18.9 | 82 | 51 |
| 3 | Portugal | 60.5 | 15.8 | 73 | 49 |
| 4 | Greece | 57.6 | 14.2 | 75 | 41 |
| 5 | Spain | 57.3 | 14.0 | 74 | 43 |
| 6 | Italy | 55.7 | 13.2 | 72 | 41 |
| 7 | Albania | 54.3 | 12.4 | 72 | 37 |
| 8 | Croatia | 53.5 | 11.9 | 71 | 35 |
| 9 | France | 52.9 | 11.6 | 68 | 40 |
| 10 | Hungary | 52.6 | 11.5 | 72 | 32 |
| 11 | Serbia | 52.4 | 11.4 | 71 | 33 |
| 12 | Bulgaria | 52.4 | 11.3 | 72 | 31 |
| 13 | Moldova | 51.5 | 10.8 | 73 | 29 |
| 14 | North Macedonia | 51.3 | 10.7 | 70 | 32 |
| 15 | Belgium | 51.2 | 10.6 | 66 | 38 |
| 16 | Netherlands | 50.8 | 10.5 | 65 | 38 |
| 17 | Bosnia and Herzegovina | 50.6 | 10.3 | 68 | 32 |
| 18 | Romania | 50.2 | 10.1 | 70 | 29 |
| 19 | Luxembourg | 50.0 | 10.0 | 65 | 35 |
| 20 | Montenegro | 49.8 | 9.9 | 68 | 32 |
| 21 | Slovenia | 49.7 | 9.8 | 67 | 32 |
| 22 | Ireland | 49.5 | 9.7 | 59 | 42 |
| 23 | Germany | 49.2 | 9.6 | 65 | 34 |
| 24 | United Kingdom | 48.6 | 9.2 | 60 | 39 |
| 25 | Ukraine | 48.6 | 9.2 | 71 | 26 |
| 26 | Denmark | 47.9 | 8.9 | 63 | 35 |
| 27 | Slovakia | 47.8 | 8.8 | 66 | 28 |
| 28 | Poland | 47.7 | 8.7 | 67 | 27 |
| 29 | Czechia | 47.4 | 8.6 | 65 | 30 |
| 30 | Austria | 45.3 | 7.4 | 63 | 28 |
| 31 | Belarus | 45.3 | 7.4 | 67 | 24 |
| 32 | Lithuania | 45.2 | 7.3 | 65 | 26 |
| 33 | Latvia | 44.3 | 6.8 | 64 | 26 |
| 34 | Faroe Islands | 43.8 | 6.6 | 51 | 39 |
| 35 | Switzerland | 43.6 | 6.4 | 59 | 29 |
| 36 | Estonia | 43.3 | 6.3 | 64 | 25 |
| 37 | Sweden | 37.7 | 3.2 | 59 | 19 |
| 38 | Finland | 36.3 | 2.4 | 61 | 15 |
| 39 | Norway | 35.9 | 2.2 | 54 | 22 |
| 40 | Iceland | 35.3 | 1.8 | 48 | 27 |
Is Iceland getting warmer?
Single years swing widely. 2024 averaged 38 °F4 (3.4 °C), 1.4 °F4 (0.8 °C) below the 1991–2020 average and the coldest year since 1998. A year later, 2025 averaged 41 °F3 (5.2 °C), the warmest year since measurements began. The three years before were close to average: slightly above in 2021,6 equal to it in 20227 and just below in 2023.8
| 2021 | just above average | 42 | 40 |
| 2022 | equal to average | 41 | 40 |
| 2023 | 0.2 °F (0.1 °C) below | 41 | 39 |
| 2024 | 38 °F (3.4 °C), 1.4 °F below | 40 | 38 |
| 2025 | 41 °F (5.2 °C), 2.0 °F above, record | 43 | 41 |
Iceland warming rate compared to global average
Over the long run the direction is clear. Since continuous measurements began in the mid-19th century, Iceland has warmed by about 1.4 °F9 (0.8 °C) per century, a rate the Met Office's climate report calls comparable to global warming over the same period. The pace has not been even: from 1980 to 2015 Iceland warmed by 0.85 °F9 (0.47 °C) per decade, most of all in the west and northwest.
Where the trend points
A straight line fitted to Iceland's yearly average since 1949 rises by about 0.25 °F1 (0.14 °C) per decade. Extended forward, it reaches roughly 40 °F1 (4.6 °C) by 2050, with a wide range because single years vary so much. Fitted to 1991–2025 only, the line climbs faster, about 0.4 °F1 (0.24 °C) per decade. That faster rate is close to the Met Office's own climate models, which project 3.6–5.4 °F9 (2–3 °C) of warming by the end of the century in a moderate emissions scenario and 5.4–9 °F9 (3–5 °C) in a high one, with more warming in the north than the south.
Projection: linear trend of 1949–2025 yearly values, 95% prediction range. Our calculation, not a forecast.
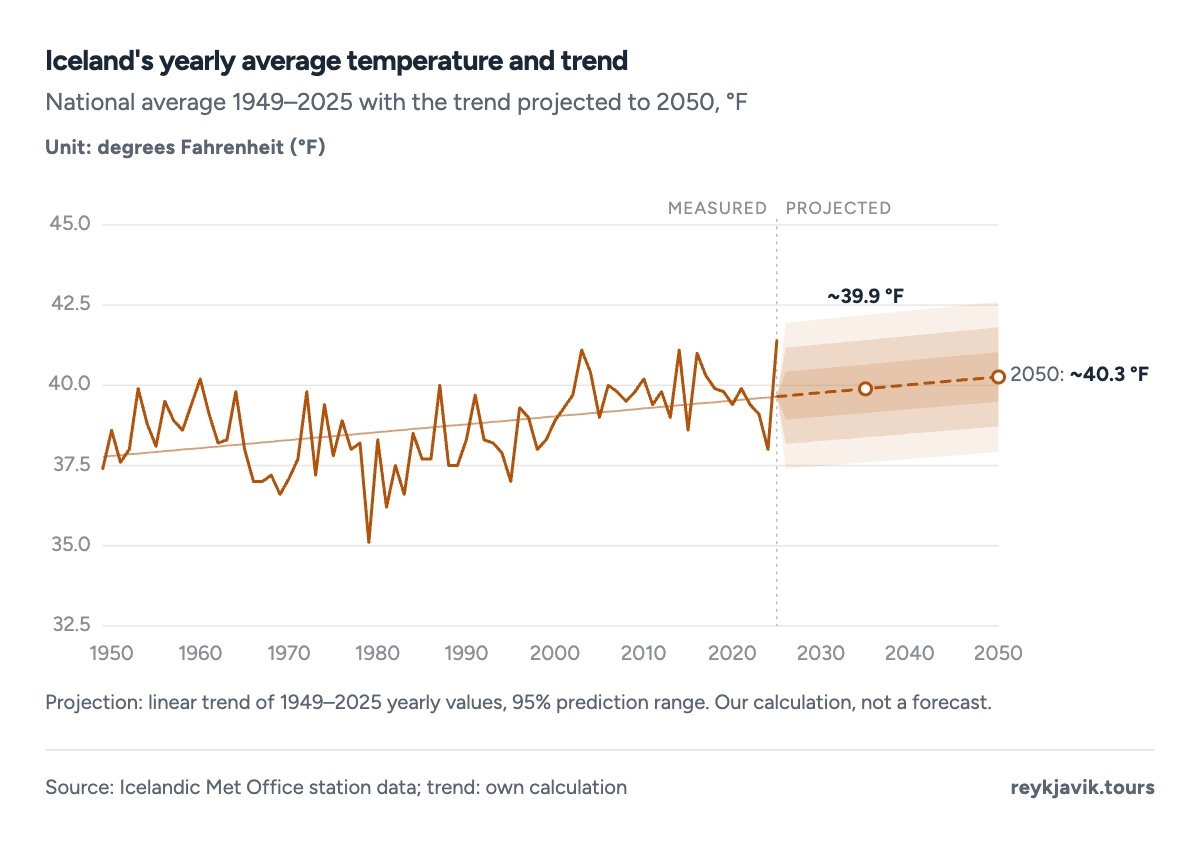
- 2025 was the warmest year in the series at 41.4 °F.
- The trend line reaches about 40.3 °F by 2050.
What the temperature means for a trip
The averages in this report are mild enough to sound easy, but the details decide how a day feels. Even in July the average night falls to 46 °F1 (7.7 °C), so warm layers belong in a summer bag as much as a winter one.
From November to April the average night is below freezing across the station network, which means frost on car windows and icy stretches of road in the morning, even when the afternoon is above freezing. The shoulder months are the least predictable: May averages 42 °F1 (5.5 °C), but its nights are only just above freezing.
Where you go matters as much as when. The south coast is the mildest part of the country, while the northeast interior is on average about 4 °F1 (2 °C) colder, and a clear winter night there can fall far below the national average.
Conclusions
- Iceland has an ocean climate, not an Arctic one. Its coldest month averages 31 °F1 (−0.6 °C) and its warmest only 51 °F1 (10.5 °C): winters are milder than on the Nordic mainland, and summers are the coolest in Europe.
- The number depends on where it is measured. Weather stations, which stand where people live, average 39 °F1 (4.1 °C); the whole island, highlands and glaciers included, averages 35 °F2 (1.8 °C).
- Reykjavík is not the whole country. The capital runs about 2 °F1 warmer than the station average, while inland stations in the northeast are the coldest in Iceland.
- Single years swing more than the trend. 2024 was the coldest year since 1998 and 2025 the warmest on record, while the long-term line rises by a fraction of a degree per decade. Over decades, the direction is warmer, and faster in recent years than over the whole record.
Methodology
- Period 1991–2020 (trend 1949–2025)
- 30 weather stations
- 40 European countries
- Checked Sept 16, 2026
Definition. Temperature is the air temperature measured at weather stations, 2 m above the ground. Monthly mean, average daily high and average daily low are shown in °F with °C in brackets (°F = °C × 9/5 + 32).
Data sources. Station data from the Icelandic Met Office's monthly values,1 records from its list of Icelandic weather records,5 recent years from its annual climate summaries,3 long-term warming and scenarios from the 2018 report of Iceland's Scientific Committee on Climate Change,9 and country averages from the World Bank Climate Change Knowledge Portal.2
Calculations. Stations with at least 20 of the 30 years 1991–2020 complete (all 12 months) count; each month's national figure is the mean of those 30 station averages. The yearly national series 1949–2025 adds each year's mean station anomaly to the 1991–2020 average, and matches the Met Office's published figures for 2024 and 2025. The trend is a least-squares line with a 95% prediction range.
Limitations. Stations are mostly coastal and lowland, so the highlands are colder than these averages. Early years of the national series rest on fewer stations. The trend projection is a straight-line extrapolation, not a climate forecast. The station-to-region mapping for Svínafell is assumed.
Sources
- Veðurstofa Íslands (Icelandic Met Office). “Mánaðargildi veðurstöðva (monthly values for weather stations).” Veðurstofa Íslands. vedur.is. Accessed 16 Sept. 2026. Back to text
- World Bank Group. “Climate Change Knowledge Portal: observed climatology 1991–2020 (CRU TS 4.07).” World Bank. climateknowledgeportal.worldbank.org. Accessed 16 Sept. 2026. Back to text
- Veðurstofa Íslands. “Tíðarfar ársins 2025.” Veðurstofa Íslands, 28 Jan. 2026. vedur.is. Accessed 16 Sept. 2026. Back to text
- Icelandic Met Office. “The weather in Iceland in 2024.” Icelandic Met Office, 5 Feb. 2025. en.vedur.is. Accessed 16 Sept. 2026. Back to text
- Veðurstofa Íslands (Icelandic Met Office). “Íslensk veðurmet (Icelandic weather records).” Veðurstofa Íslands. vedur.is. Accessed 16 Sept. 2026. Back to text
- Veðurstofa Íslands. “Tíðarfar ársins 2021.” Veðurstofa Íslands, 20 Jan. 2022. vedur.is. Accessed 16 Sept. 2026. Back to text
- Veðurstofa Íslands. “Tíðarfar ársins 2022.” Veðurstofa Íslands, 1 Feb. 2023. vedur.is. Accessed 16 Sept. 2026. Back to text
- Veðurstofa Íslands. “Tíðarfar ársins 2023.” Veðurstofa Íslands, 29 Jan. 2024. vedur.is. Accessed 16 Sept. 2026. Back to text
- Vísindanefnd um loftslagsbreytingar (Scientific Committee on Climate Change). “Loftslagsbreytingar og áhrif þeirra á Íslandi (Climate change and its effects in Iceland).” Veðurstofa Íslands, 2018. vedur.is. Accessed 16 Sept. 2026. Back to text
About the author
Laufey turns public statistics on tourism and travel into research people can check and cite.
Every figure on this page links to its source. How we research
Related research
More data on Iceland's weather and travel from Reykjavik Tours.
- WeatherIceland Weather by Month (2026 Data)4.5 in rain in September, Iceland's wettest monthRead the research →
- WeatherAverage Wind Speed in Iceland (2026 Data)5.2 m/s average wind speed in IcelandRead the research →
- WeatherIceland Daylight Hours by Month (2026 Data)21.2 h of daylight in Reykjavík on the longest dayRead the research →
- WeatherHow Much Snow Does Iceland Get? (2026 Data)55 days a year with snow on the ground in ReykjavíkRead the research →
- TravelHow Many Days in Iceland? (2026 Data)7.1 nights average stay of foreign visitorsRead the research →
- Travel planningHow Often Can You See the Northern Lights in Iceland? (2026 Data)~50% chance of aurora on any dark-season nightRead the research →