How Many Volcanoes Are in Iceland? (2026 Data)
Iceland's volcanic systems counted, how often they erupt, the biggest volcanoes and eruptions, and what earthquakes, ash and gas mean beyond the island.
- Published
- Updated
- 21 sources
- 121 statistics
- 10 min read

- M.Sc. in Atmospheric Sciences, University of Iceland (Háskóli Íslands), with a minor thesis on North Atlantic storm-track variability
- Former research assistant at the Icelandic Meteorological Office (Veðurstofa Íslands), working on subarctic climate modeling and volcanic-ash dispersion forecasting
- B.A. in Sociology, also from the University of Iceland, with fieldwork on rural depopulation and tourism's impact on small fishing communities (Westfjords focus)
- Grew up in Akureyri, spent seven years living in Reykjavík and two in a small village in the Westfjords - brings first-hand experience of Iceland's regional weather extremes and community life
- Fluent in Icelandic and English; has translated Icelandic Met Office public advisories for international outlets
- Published field notes and data-driven pieces on glacier retreat (Vatnajökull), aurora forecasting, and the socioeconomic effects of overtourism in the Golden Circle

- M.A. in Journalism, University of Iceland, with additional coursework in Environmental Communication at the University of Bergen (Norway), giving a comparative Nordic lens
- 12+ years in Icelandic media, including editorial roles at RÚV (Iceland's national broadcaster) covering weather-related public safety reporting (storms, volcanic eruptions, road closures)
- Former fact-checking lead for a travel-and-culture desk, specializing in verifying tourism statistics, safety advisories, and climate data against primary sources (Vedur.is, Statistics Iceland)
- Has overseen editorial standards for bilingual (Icelandic/English) publications, ensuring both cultural nuance and accuracy for international readers
- Advocate for citing primary sources (Icelandic Met Office, Icelandic Tourist Board / Ferðamálastofa) rather than secondhand reporting
Key findings
- 33Iceland has 33 volcanic systems, according to the official Catalogue of Icelandic Volcanoes.
- 20At least 20 volcanic eruptions happen in Iceland every century, according to a peer-reviewed study.
- 48Iceland has had 48 confirmed volcanic eruptions since 1900, 12 of them in the 2020s.
- 6,923 feetIceland's tallest volcano, Öræfajökull, rises 6,923 feet (2,110 m).
- 9,500The Laki eruption of 1783–84 killed about 9,500 people, around 19% of Iceland's population.
- 87Iceland records about 87 reviewed earthquakes a day on average, based on 2016–2025.
- 104,000The 2010 Eyjafjallajökull eruption forced the cancellation of 104,000 flights in eight days.
- 9.6 million tonnesHoluhraun's 2014–15 eruption released 9.6 million tonnes of sulphur dioxide, against 0.06 million tonnes from Iceland's human activities in 2015.
Iceland has had 121 volcanic eruptions in the 2020s alone, more than in any full decade since 1900. About one third2 of the island, roughly 11,600 square miles (30,000 km²), lies within its active volcanic zones, and the Icelandic Met Office's seismic network records about 873 reviewed earthquakes on an average day. Counting the volcanoes behind all this is harder than it sounds, because scientists count volcanic systems, not single mountains, and the most repeated number online has no official source at all.
The stakes are real. The Laki eruption of 1783–84 was followed by famine that killed about 9,5001 people, around 19%4 of Iceland's population, and the 2010 eruption of Eyjafjallajökull forced the cancellation of 104,0005 flights across Europe in eight days. This report brings together the official Catalogue of Icelandic Volcanoes, peer-reviewed research, the Met Office's earthquake catalogue and EUROCONTROL's figures to show how many volcanoes Iceland has, how often they erupt and which are the biggest.
Iceland's volcanoes, counted
The official answer comes from the Catalogue of Icelandic Volcanoes, run by the Icelandic Met Office, the University of Iceland and Iceland's Civil Protection. It lists 331 volcanic systems. A volcanic system is not one mountain: it is a zone of fissures and craters, often around a central volcano, fed by the same magma, and the longest, Askja and Bárðarbunga, each stretch about 118 miles1 (190 km). Fremrinámar and Kverkfjöll run about 81 miles1 (130 km), Grímsvötn and Krafla about 62 miles1 (100 km), and even the Reykjanes system is about 28 miles1 (45 km) long.
Other sources count differently. The European research infrastructure EPOS refers to 326 volcanic systems in Iceland's active volcanic zones, and a peer-reviewed review of Iceland's volcanism since the last ice age attributes most of it to 307 active systems in the volcanic zones. Counting systems under the sea as well, an overview on natt.is puts the total at around 418. A figure of about 130 volcanoes is widely repeated online, but no primary source for it could be found, so it is not used here.
| Öræfajökull | Moderate | 6,923 | 2,110 | 1727 CE | yes (above 1,000 m) |
| Bárðarbunga | High | 6,562 | 2,000 | 2014 CE | partly |
| Kverkfjöll | Moderate | 6,342 | 1,933 | ~700 CE | partly |
| Snæfell | Inactive | 6,014 | 1,833 | No eruptions in the last 10,000 years | small summit glacier |
| Hofsjökull | Low | 5,889 | 1,795 | Early Holocene | yes |
| Esjufjöll | Low | 5,725 | 1,745 | 1927 CE | mostly |
| Grímsvötn | High | 5,650 | 1,722 | 2011 CE | partly |
| Eyjafjallajökull | Moderate | 5,417 | 1,651 | 2010 CE | partly |
| Þórðarhyrna | Moderate | 5,413 | 1,650 | 1903 CE | yes |
| Tungnafellsjökull | Low | 4,997 | 1,523 | Unknown. Two small eruptions in 10,000 years | partly |
| Askja | Moderate | 4,974 | 1,516 | 1961 CE | limited |
| Hekla | High | 4,888 | 1,490 | 2000 CE | not stated |
| Katla | High | 4,888 | 1,490 | 1918 CE | partly |
| Tindfjallajökull | Inactive | 4,803 | 1,464 | No eruptions in the last 10,000 years | partly (caldera) |
| Snæfellsjökull | Moderate | 4,744 | 1,446 | ~200 CE | small ice cap |
| Langjökull | Low | 4,708 | 1,435 | 1600 BCE | partly |
| Prestahnúkur | Low | 4,544 | 1,385 | ~900 CE | partly |
| Torfajökull | Moderate | 3,904 | 1,190 | 1477 CE | not stated |
| Ljósufjöll | Low | 3,488 | 1,063 | 10th century CE | not stated |
| Helgrindur | Low | 3,235 | 986 | Unknown. Two small eruptions in 10,000 years | not stated |
| Fremrinámar | Low | 3,182 | 970 | ~1000 BCE | not stated |
| Hengill | Low | 2,635 | 803 | ~100 CE | not stated |
| Krafla | Moderate | 2,625 | 800 | 1975-1984 CE | not stated |
| Brennisteinsfjöll | Moderate | 2,001 | 610 | Late 10th century CE | no |
| Hrómundartindur | Low | 1,804 | 550 | ~8000-9000 BCE | not stated |
| Þeistareykir | Low | 1,772 | 540 | ~400 BCE | not stated |
| Heiðarsporðar | Low | 1,608 | 490 | ~200 BCE | not stated |
| Fagradalsfjall | High | 1,263 | 385 | 2023 CE | not stated |
| Krýsuvík | Moderate | 1,181 | 360 | 1188 CE | no |
| Vestmannaeyjar | Moderate | 928 | 283 | 1973 CE | not stated |
| Grímsnes | Low | 656 | 200 | ~5000 BCE | not stated |
| Reykjanes | Moderate | 459 | 140 | 2025 CE | not stated |
| Eldey | Low | 230 | 70 | 1926 CE | not stated |
Number of active volcanic systems in Iceland
Not all of the systems are equally alive. The Catalogue rates 51 as highly active: Bárðarbunga, Grímsvötn, Hekla, Katla and Fagradalsfjall. 121 are rated moderate and 141 low. Only 21, Snæfell and Tindfjallajökull, are marked inactive, which leaves 311 systems that are not.
- Low1442.4%
- Moderate1236.4%
- High515.2%
- Inactive26.1%
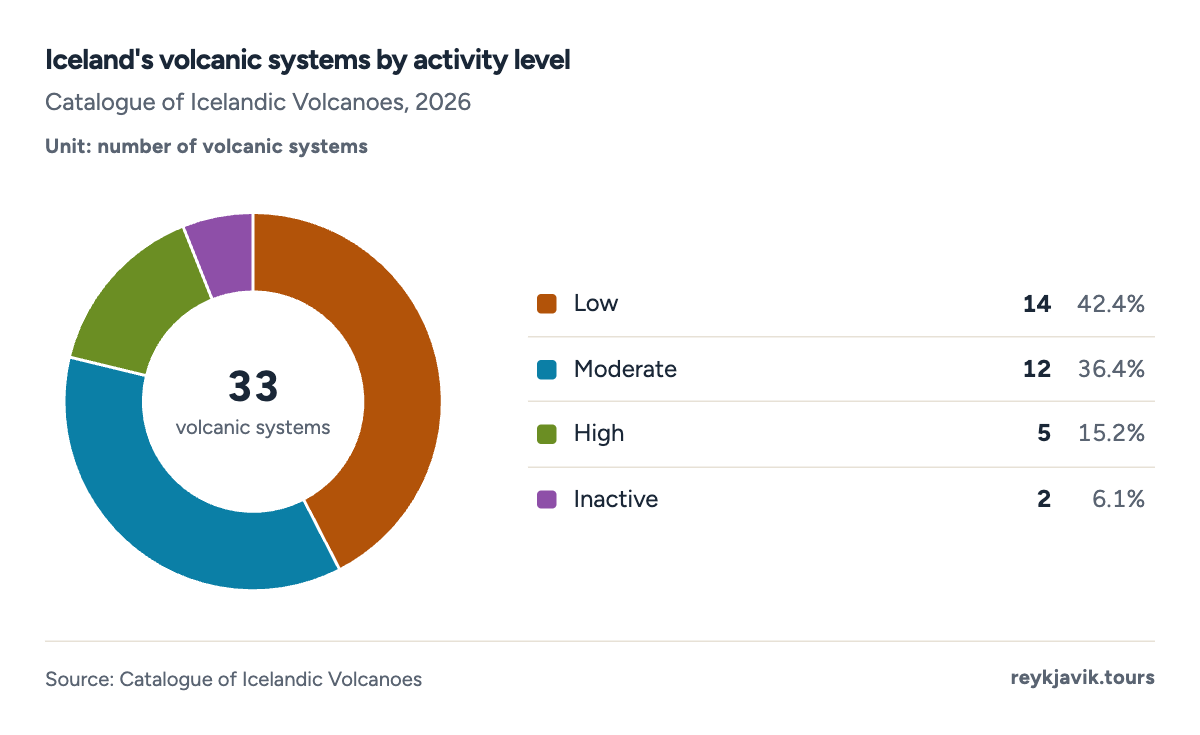
- 5 systems are rated highly active.
- 2 systems are marked inactive.
How many active volcanoes are in Iceland
Five systems do most of the work. Over the last 1,100 years, Grímsvötn has erupted about once every 10 years1, and Bárðarbunga and Katla about once every 50 years1 each. Others are far slower: the Catalogue puts Öræfajökull at about one eruption every 500 years1 and Esjufjöll at about one every 1,000 years1. The fifth, Fagradalsfjall, lies on the Reykjanes Peninsula.
Many of Iceland's volcanoes sit under ice. The Catalogue describes glacier or ice cover on part of 161 of the 33 systems, including Grímsvötn and Katla, both under ice up to 2,300 feet1 (700 m) thick; Katla's ice-filled caldera measures about 5.6 by 8.7 miles1 (9 by 14 km). "The most active volcanoes in the country are covered or capped by a thick glacier," the 2008 review notes.7 Katla's eruption of 1823 was followed by a flood in which 31 people drowned.
- No ice cover described1751.5%
- Ice cover on part of the system1648.5%
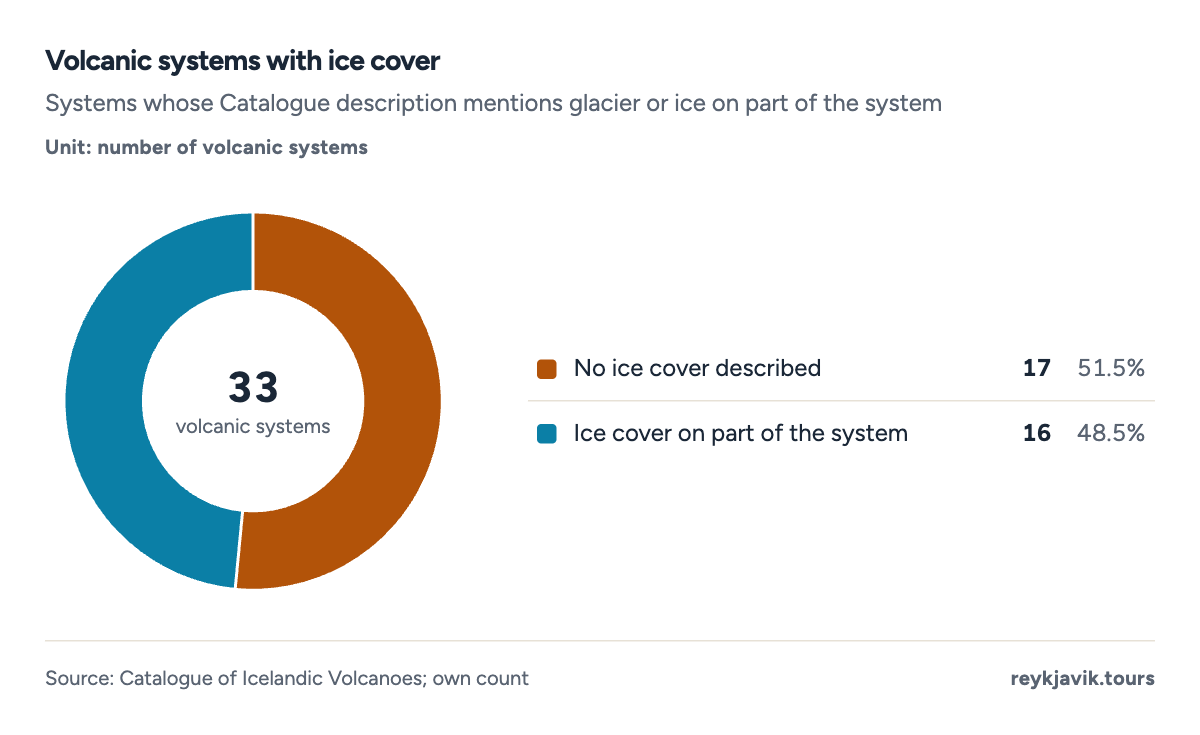
- 16 of 33 systems have ice on part of the system.
- 17 descriptions mention no ice.
Number of active volcanoes in Italy vs Iceland
International comparisons usually count individual volcanoes rather than systems, and the result depends on the list. The volcano list of NOAA's National Centers for Environmental Information, based on older data from the Smithsonian Institution's Global Volcanism Program, includes 4410 volcano locations in Iceland, against 1510 in Italy and 11310 in Japan. The United States tops that list with 19110, followed by Russia with 17010 and Indonesia with 13610.
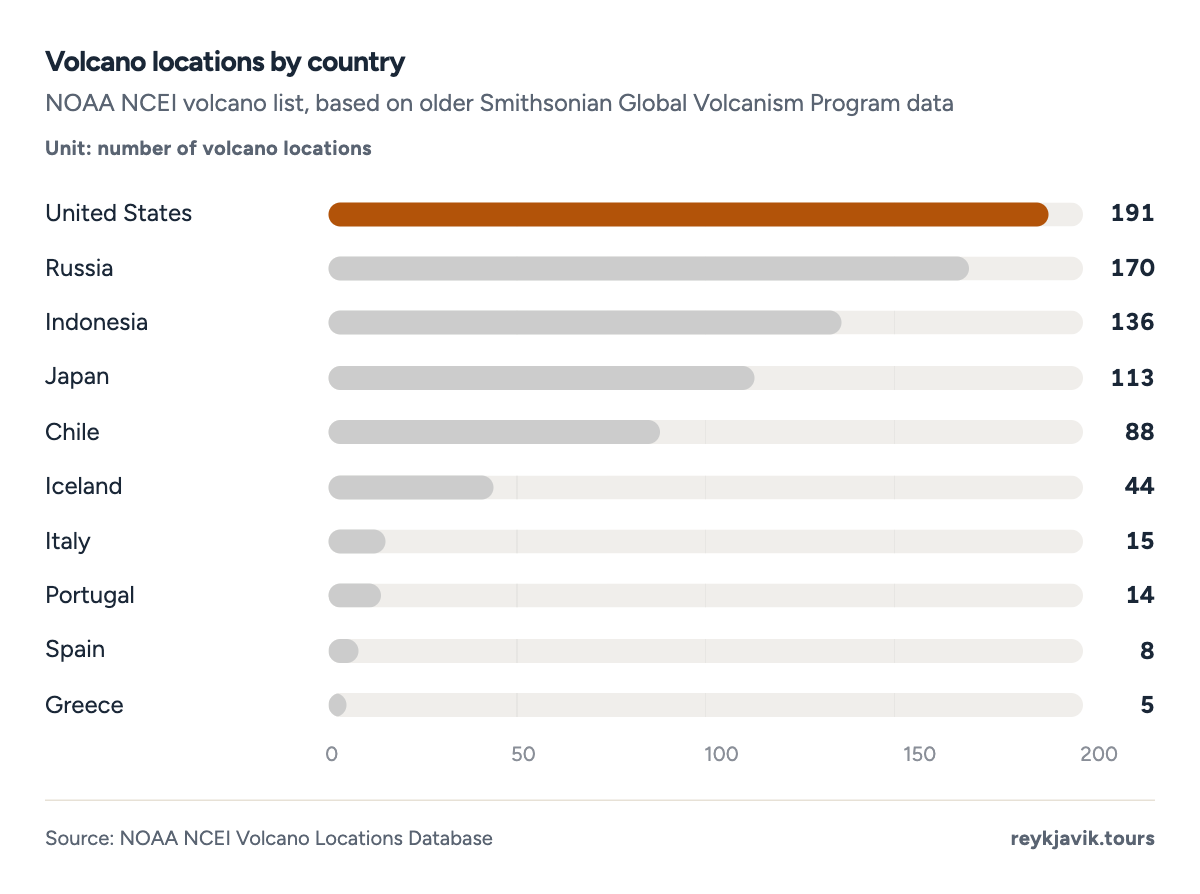
- Iceland has 44 volcano locations in the list.
- Italy has 15.
| 1 | United States | 191 |
| 2 | Russia | 170 |
| 3 | Indonesia | 136 |
| 4 | Japan | 113 |
| 5 | Chile | 88 |
| 6 | Iceland | 44 |
| 7 | Italy | 15 |
| 8 | Portugal | 14 |
| 9 | Spain | 8 |
| 10 | Greece | 5 |
How often do volcanoes erupt in Iceland
Over the long run, Iceland averages at least 207 eruptions per century, according to the 2008 peer-reviewed review of its volcanism. Since the end of the last ice age, about 11,000 years ago, Icelandic volcanoes have produced around 2,4007 eruptions and about 566 km³7 of magma, roughly 136 cubic miles. In historical time, roughly the last 1,100 years, the count is 2177: 1617 explosive and 567 effusive. Three in four eruptions are explosive, and about 86%7 of those are "wet".
Grímsvötn is the most active system by far, with about 1101 eruptions in the last 1,100 years. Bárðarbunga follows with at least 261, Hekla with 231 in the last millennium and Katla with at least 211. The small Eldey system has had 61 small submarine or explosive eruptions over the same period.
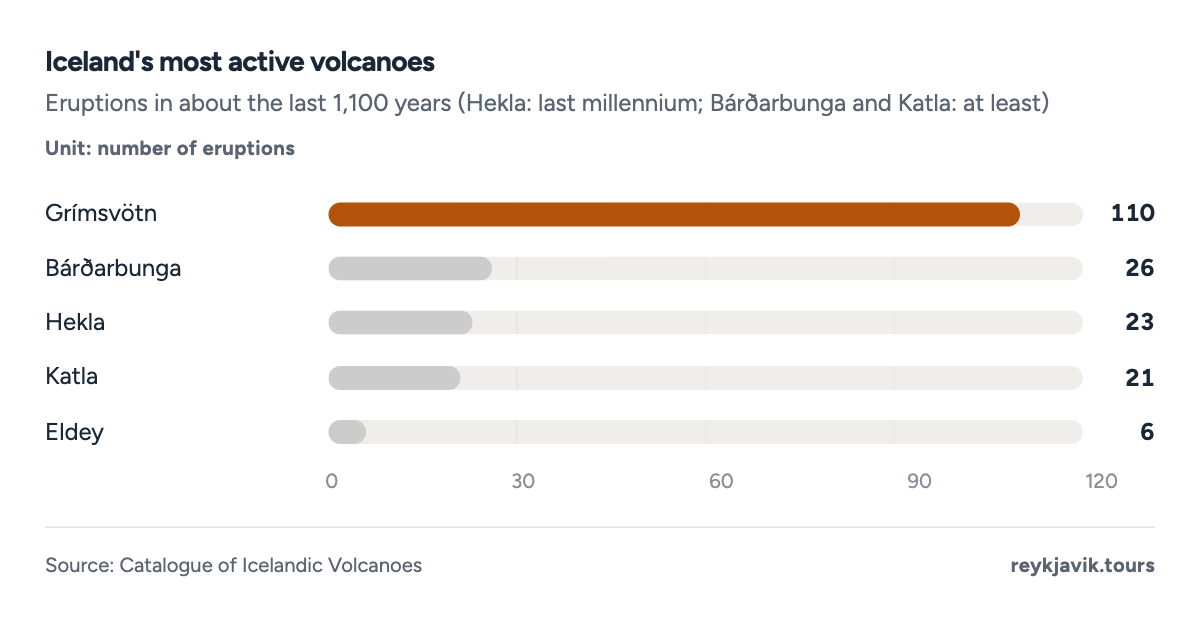
- Grímsvötn has erupted about 110 times.
- Hekla has erupted 23 times in the last millennium.
- Explosive16174.2%
- Effusive (lava)5625.8%
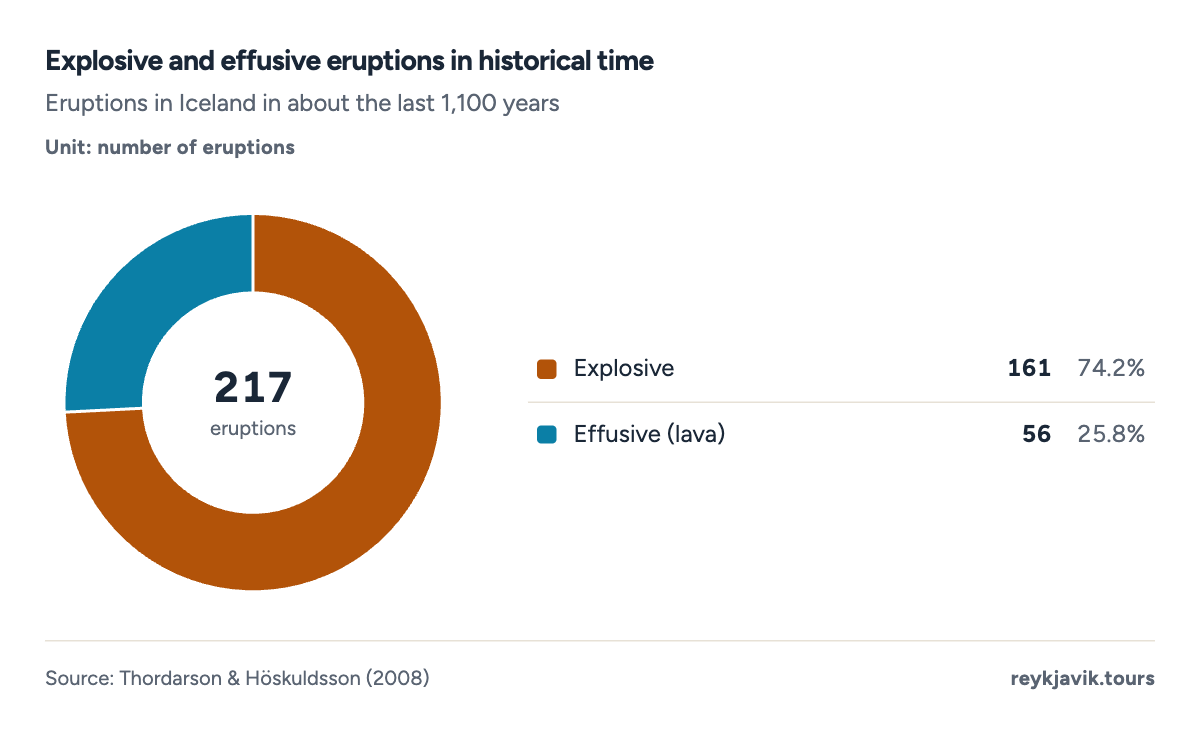
- 161 of the eruptions were explosive.
- 56 were effusive lava eruptions.
How many eruptions in Iceland since 1900?
Counting the Catalogue's records and the recent Reykjanes eruptions, Iceland has had 481 confirmed eruptions since 1900, about one every 2.6 years11 on average. They come in bursts rather than evenly. The 1980s brought 81, mostly small fissure eruptions at Krafla between 1975 and 1984, while the 1950s had 01. The 2020s, not yet over, already hold the record with 121.
A straight line through the counts per decade rises by about 0.411 eruptions a decade and points to roughly 711 per decade by the 2040s. That trend is illustrative only: eruptions arrive in episodes such as the Krafla eruptions and the Reykjanes series, and the peer-reviewed long-term average of at least 207 per century is the steadier guide.
Projection: linear trend of 1900–2020 per-decade values, 95% prediction range. Our calculation, not a forecast.
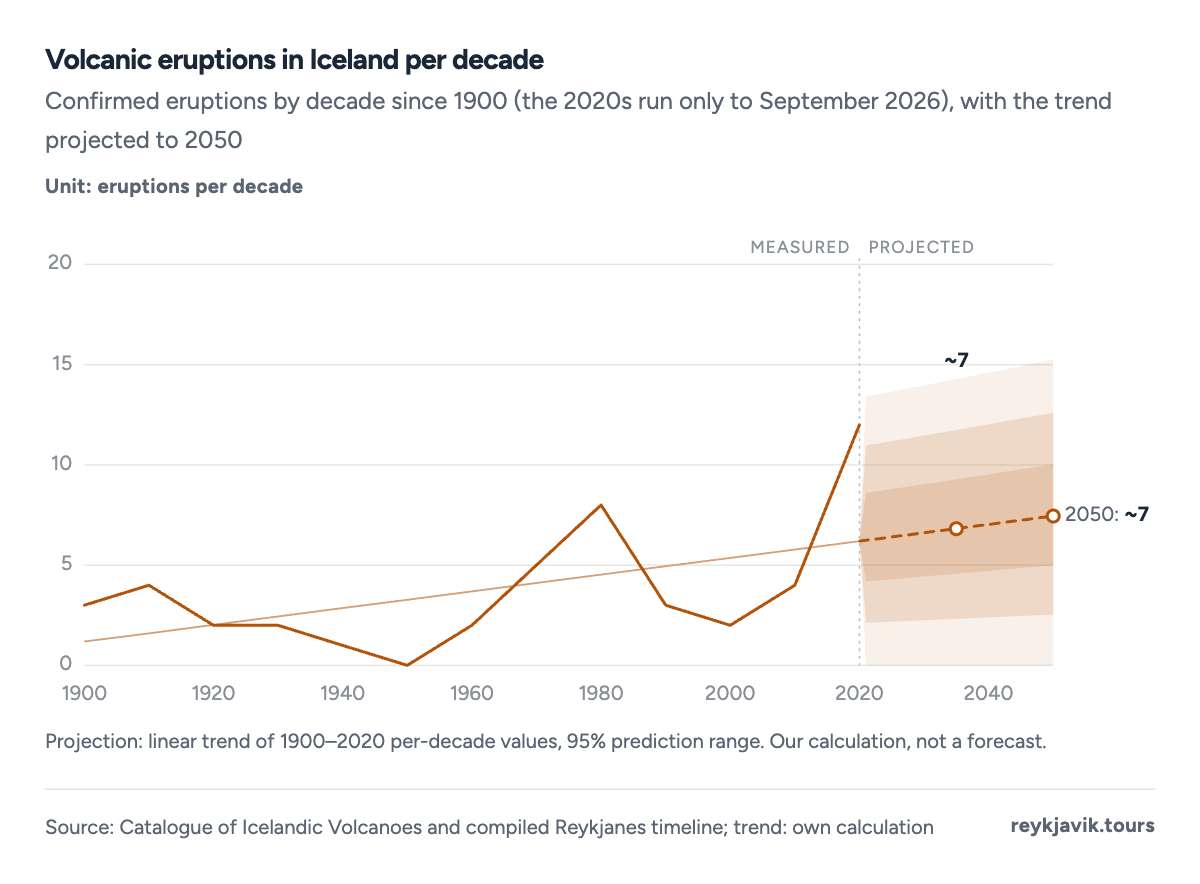
- The 2020s have had 12 eruptions so far.
- The 1950s had 0.
Eruptions have started in every month of the year. Of the 401 eruptions since 1900 with a known start month, March has the most, 61, and June the fewest, 11. With so few events, the pattern does not point to a volcanic season.
- 3JanJ
- 2FebF
- 6MarM
- 4AprA
- 5MayM
- 1JunJ
- 3JulJ
- 4AugA
- 3SepS
- 3OctO
- 3NovN
- 3DecD
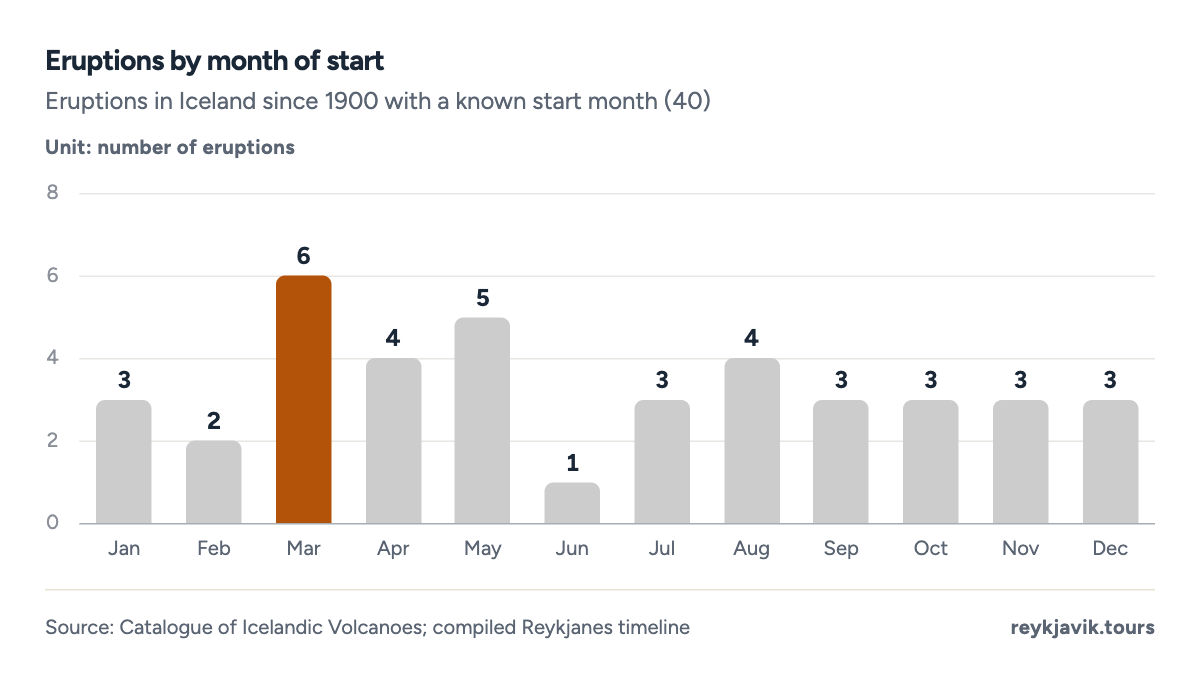
- March has the most eruption starts, 6.
- June has the fewest, 1.
| Bárðarbunga | 1902 | 1903 | Small |
| Þórðarhyrna | 1903 | 1903 | Moderate |
| Grímsvötn | May 1903 | 1904 | Moderate, Large |
| Bárðarbunga | Jun 1910 | 1910 | Small |
| Hekla | Apr 1913 | May 1913 | Small |
| Katla | Oct 1918 | Nov 1918 | Large |
| Grímsvötn | 1919 | – | Small |
| Grímsvötn | Oct 1922 | Oct 1922 | Moderate |
| Eldey | 1926 | – | Small (submarine) |
| Grímsvötn | Mar 1934 | Apr 1934 | Small, Moderate |
| Grímsvötn | 1938 | – | Unknown |
| Hekla | Mar 1947 | Apr 1948 | Moderate |
| Askja | 1961 | 1961 | Moderate |
| Vestmannaeyjar (Surtsey) | 1963 | 1967 | Moderate |
| Hekla | May 1970 | Jul 1970 | Small |
| Vestmannaeyjar (Eldfell, Heimaey) | 1973 | 1973 | Moderate |
| Krafla | Dec 1975 | 1975 | Small |
| Krafla | Apr 1977 | 1977 | Small |
| Krafla | Sep 1977 | 1977 | Small |
| Krafla | Mar 1980 | 1980 | Small |
| Krafla | Jul 1980 | 1980 | Small |
| Hekla | Aug 1980 | Aug 1980 | Small |
| Krafla | Oct 1980 | 1980 | Small |
| Krafla | Jan 1981 | 1981 | Small |
| Krafla | Nov 1981 | 1981 | Small |
| Grímsvötn | May 1983 | Jun 1983 | Small |
| Krafla | Sep 1984 | 1984 | Small |
| Hekla | Jan 1991 | Mar 1991 | Small |
| Grímsvötn | Sep 1996 | Oct 1996 | Moderate |
| Grímsvötn | Dec 1998 | Dec 1998 | Moderate |
| Hekla | Feb 2000 | Mar 2000 | Small |
| Grímsvötn | Nov 2004 | Nov 2004 | Small |
| Eyjafjallajökull | Mar 2010 | Apr 2010 | Small |
| Eyjafjallajökull | Apr 2010 | May 2010 | Moderate |
| Grímsvötn | May 2011 | May 2011 | Moderate, Large |
| Bárðarbunga | Aug 2014 | Feb 2015 | Large |
| Fagradalsfjall | Mar 2021 | Sep 2021 | Small |
| Fagradalsfjall | Aug 2022 | Aug 2022 | Small |
| Fagradalsfjall | Jul 2023 | Aug 2023 | Small |
| Sundhnúkur crater row | Dec 2023 | Dec 2023 | Small |
| Sundhnúkur crater row | Jan 2024 | Jan 2024 | Small |
| Sundhnúkur crater row | Feb 2024 | Feb 2024 | Small |
| Sundhnúkur crater row | Mar 2024 | May 2024 | Small |
| Sundhnúkur crater row | May 2024 | Jun 2024 | Small |
| Sundhnúkur crater row | Aug 2024 | Sep 2024 | Small |
| Sundhnúkur crater row | Nov 2024 | Dec 2024 | Small |
| Sundhnúkur crater row | Apr 2025 | Apr 2025 | Small |
| Sundhnúkur crater row | Jul 2025 | Aug 2025 | Small |
All of the 2020s eruptions happened on the Reykjanes Peninsula, where the previous eruption had been around 1240.1 Fagradalsfjall erupted in 2021, 2022 and 2023, and from December 2023 the Sundhnúkur crater row produced 91 eruptions by August 2025. The first Fagradalsfjall eruption, in Geldingadalir, lasted about 183 days9, while the eighth Sundhnúkur eruption in April 2025 lasted about 1 day9. According to the Catalogue, the 2021 eruption covered 4.85 km²1 (about 1.9 square miles) with 0.15 km³1 of lava, and the 2022 eruption added 0.01 km³1 over about three weeks. The first three Sundhnúkur eruptions each ended within 3 days9, while the fourth, from March to May 2024, went on for 53 days9. The dates come from a compiled eruption timeline (volcanoexpress.is); the Met Office confirmed that the ninth eruption had ended on 5 August 2025.12 As of September 2026, the Met Office's aviation colour code for the Reykjanes volcano is yellow, which signals elevated unrest.13
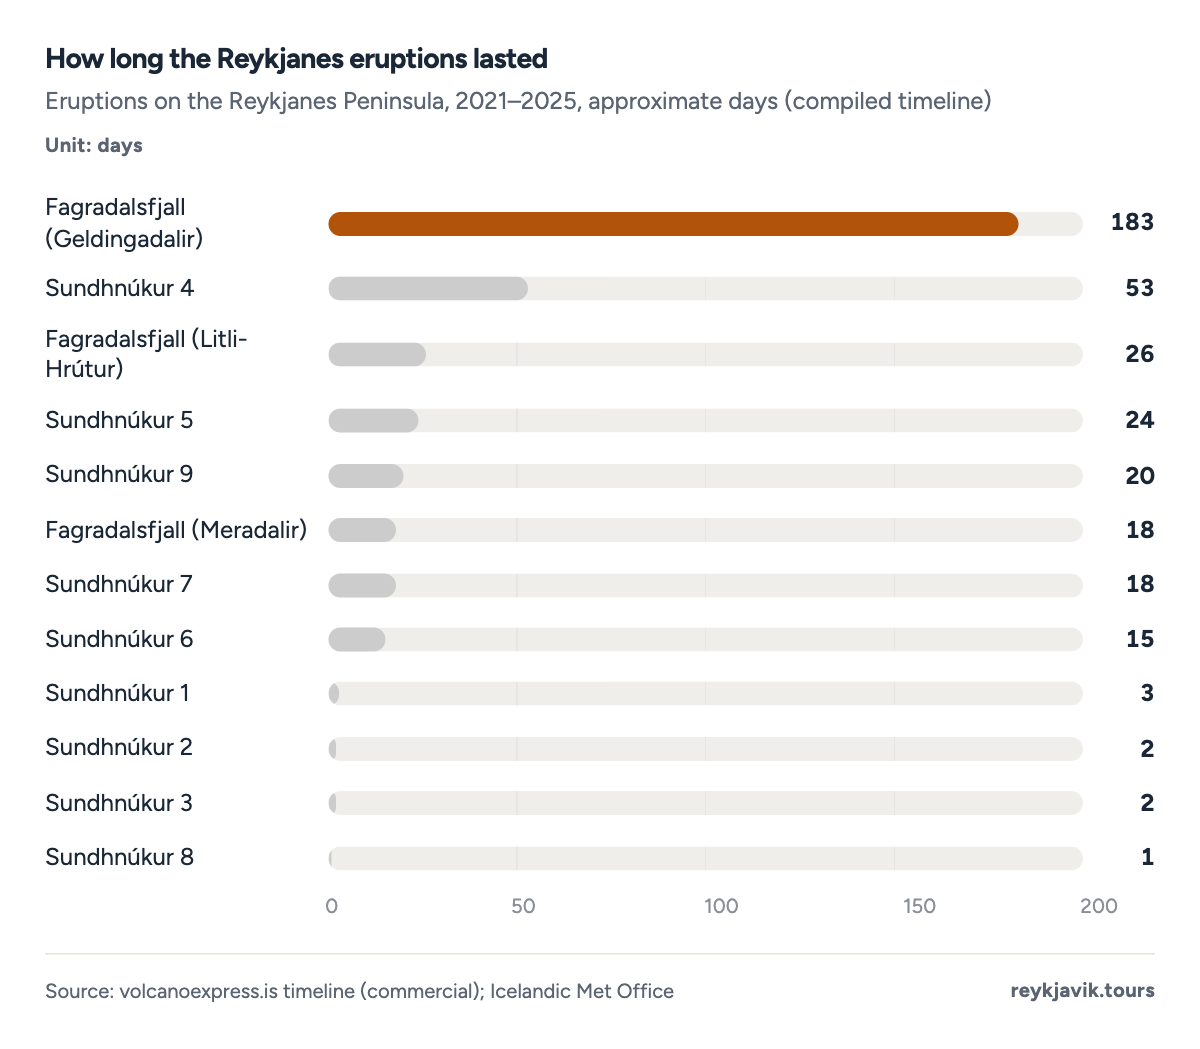
- The 2021 Geldingadalir eruption lasted about 183 days.
- The shortest, in April 2025, lasted about 1 day.
| Fagradalsfjall (Geldingadalir) | 2021-03-19 | 2021-09-18 | 183 |
| Fagradalsfjall (Meradalir) | 2022-08-03 | 2022-08-21 | 18 |
| Fagradalsfjall (Litli-Hrútur) | 2023-07-10 | 2023-08-05 | 26 |
| Sundhnúkur 1 | 2023-12-18 | 2023-12-21 | 3 |
| Sundhnúkur 2 | 2024-01-14 | 2024-01-16 | 2 |
| Sundhnúkur 3 | 2024-02-08 | 2024-02-10 | 2 |
| Sundhnúkur 4 | 2024-03-16 | 2024-05-08 | 53 |
| Sundhnúkur 5 | 2024-05-29 | 2024-06-22 | 24 |
| Sundhnúkur 6 | 2024-08-22 | 2024-09-06 | 15 |
| Sundhnúkur 7 | 2024-11-20 | 2024-12-08 | 18 |
| Sundhnúkur 8 | 2025-04-01 | 2025-04-02 | 1 |
| Sundhnúkur 9 | 2025-07-16 | 2025-08-05 | 20 |
Some famous volcanoes have been quiet for a long time. Katla last erupted in 19181, 108 years11 ago. Hekla last erupted in 20001, and Öræfajökull, the tallest volcano in the country, in 17271, 299 years11 ago.
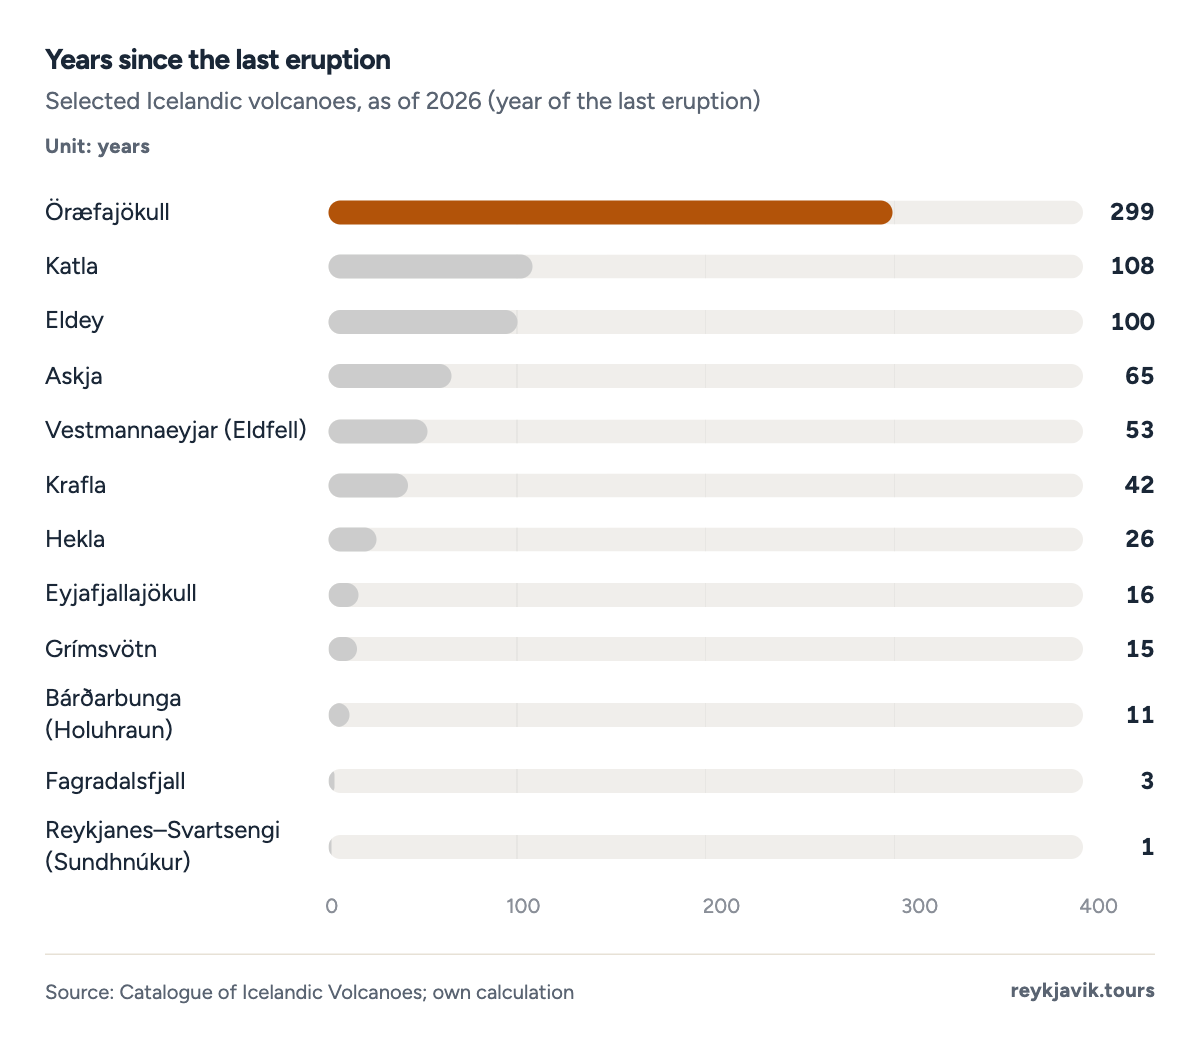
- Katla last erupted 108 years ago.
- Hekla last erupted 26 years ago.
Biggest volcanoes in Iceland
Measured by height, the biggest is Öræfajökull, whose summit reaches 6,923 feet1 (2,110 m). Bárðarbunga follows at 6,562 feet1 (2,000 m) and Kverkfjöll at 6,342 feet1 (1,933 m). Better-known names are lower: Eyjafjallajökull rises to 5,417 feet1 (1,651 m), and Hekla and Katla to 4,888 feet1 (1,490 m) each. The lowest system in the Catalogue, Eldey, reaches just 230 feet1 (70 m).
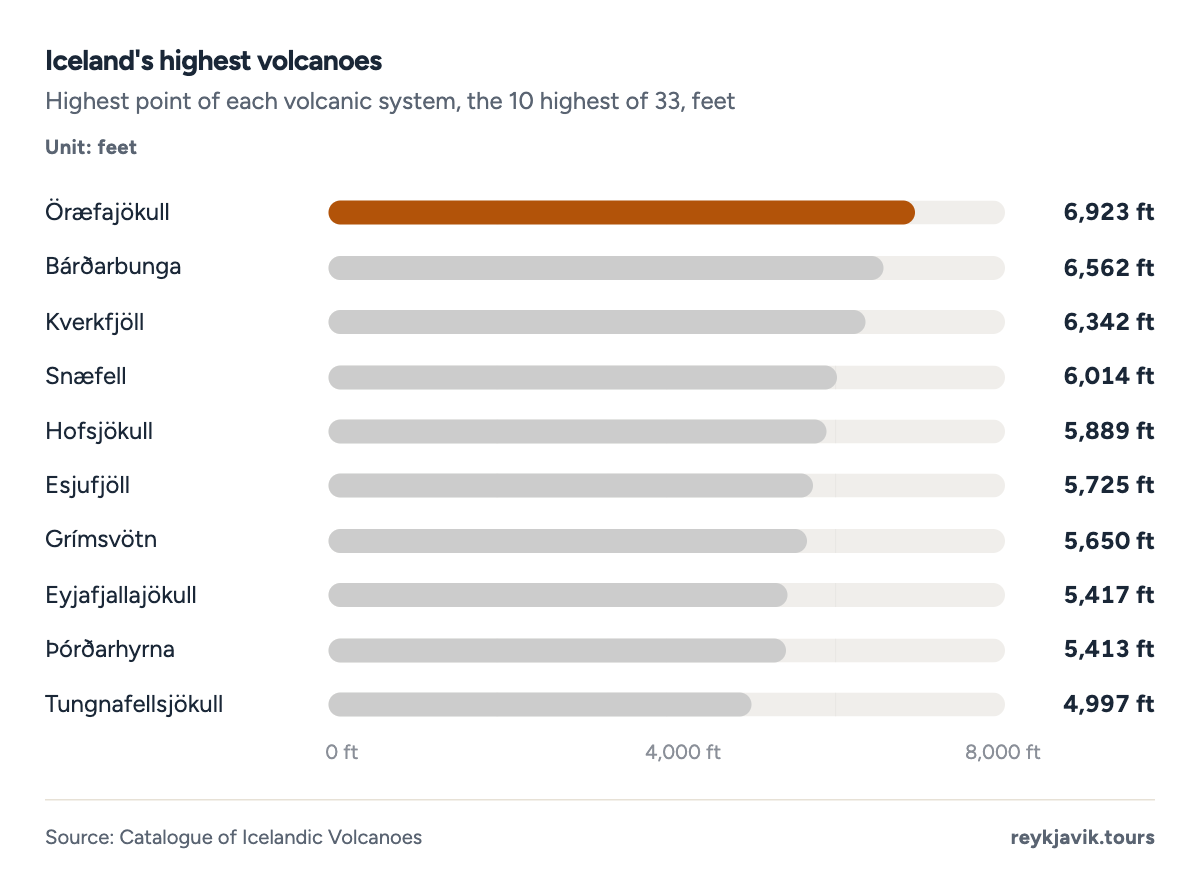
- Öræfajökull rises to 6,923 ft.
- Bárðarbunga rises to 6,562 ft.
| 1 | Öræfajökull | 6,923 | 2,110 |
| 2 | Bárðarbunga | 6,562 | 2,000 |
| 3 | Kverkfjöll | 6,342 | 1,933 |
| 4 | Snæfell | 6,014 | 1,833 |
| 5 | Hofsjökull | 5,889 | 1,795 |
| 6 | Esjufjöll | 5,725 | 1,745 |
| 7 | Grímsvötn | 5,650 | 1,722 |
| 8 | Eyjafjallajökull | 5,417 | 1,651 |
| 9 | Þórðarhyrna | 5,413 | 1,650 |
| 10 | Tungnafellsjökull | 4,997 | 1,523 |
| 11 | Askja | 4,974 | 1,516 |
| 12 | Hekla | 4,888 | 1,490 |
| 13 | Katla | 4,888 | 1,490 |
| 14 | Tindfjallajökull | 4,803 | 1,464 |
| 15 | Snæfellsjökull | 4,744 | 1,446 |
| 16 | Langjökull | 4,708 | 1,435 |
| 17 | Prestahnúkur | 4,544 | 1,385 |
| 18 | Torfajökull | 3,904 | 1,190 |
| 19 | Ljósufjöll | 3,488 | 1,063 |
| 20 | Helgrindur | 3,235 | 986 |
| 21 | Fremrinámar | 3,182 | 970 |
| 22 | Hengill | 2,635 | 803 |
| 23 | Krafla | 2,625 | 800 |
| 24 | Brennisteinsfjöll | 2,001 | 610 |
| 25 | Hrómundartindur | 1,804 | 550 |
| 26 | Þeistareykir | 1,772 | 540 |
| 27 | Heiðarsporðar | 1,608 | 490 |
| 28 | Fagradalsfjall | 1,263 | 385 |
| 29 | Krýsuvík | 1,181 | 360 |
| 30 | Vestmannaeyjar | 928 | 283 |
| 31 | Grímsnes | 656 | 200 |
| 32 | Reykjanes | 459 | 140 |
| 33 | Eldey | 230 | 70 |
Biggest volcanic eruption in Iceland
By volume of lava, the largest eruption since the last ice age produced the Þjórsá lava about 8,600 years ago: 25 km³7, about 6.0 cubic miles. In historical time, the record belongs to Eldgjá, which erupted between 934 and 940 and poured out 19.6 km³7 (4.7 cubic miles). Laki, in 1783–84, followed with 15.1 km³7 (3.6 cubic miles).
Laki was also the deadliest. The Catalogue records about 9,5001 deaths from famine and disease after the loss of more than 200,0001 farm animals, around 19%4 of Iceland's population at the time. Statistics Iceland's records show the population falling from 49,7534 at the start of 1784 to 40,3814 at the start of 1786, a drop of 9,37211 people in two years. Hekla's eruption of 1300 was followed by a famine that killed about 6001 people. The most recent death in the Catalogue's eruption records came in 1947, when a scientist filming Hekla's eruption was killed by a glowing block.1
The largest lava eruption of this century so far was Holuhraun, on the Bárðarbunga system, which ran from August 2014 to February 2015 and produced 1.6 km³1 of lava.
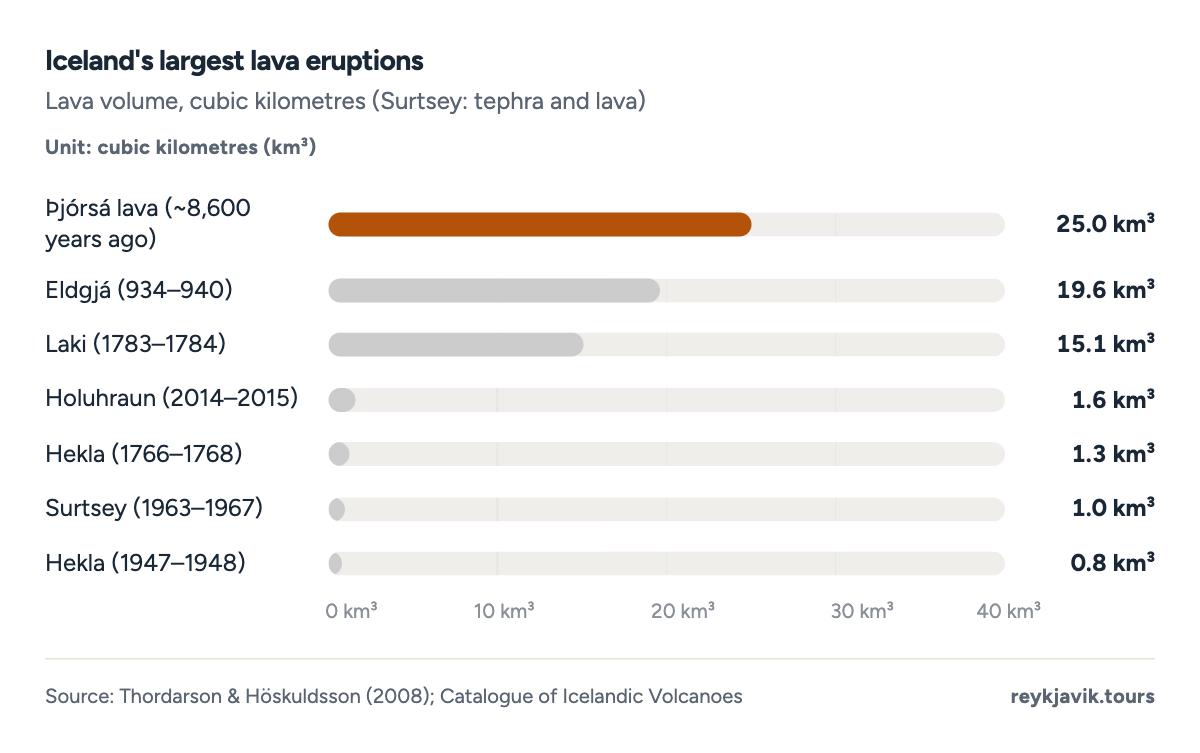
- The Þjórsá lava measured 25 km³.
- Holuhraun produced 1.6 km³.
| 1 | Þjórsá lava (~8,600 years ago) | 25.0 | 6.0 |
| 2 | Eldgjá (934–940) | 19.6 | 4.7 |
| 3 | Laki (1783–1784) | 15.1 | 3.6 |
| 4 | Holuhraun (2014–2015) | 1.6 | 0.4 |
| 5 | Hekla (1766–1768) | 1.3 | 0.3 |
| 6 | Surtsey (1963–1967) | 1.0 | 0.2 |
| 7 | Hekla (1947–1948) | 0.8 | 0.2 |
| 1 | Laki (Grímsvötn system) | 1783 | 9,500 | Famine (resulting from loss of >200.000 animals) and diseases |
| 2 | Hekla | 1300 | 600 | Tephra fall associated with eruption caused famine, killing approximately 600 in the winter following the eruption. |
| 3 | Katla | 1823 | 3 | Drowned in a flood in the aftermath of the eruption |
| 4 | Katla | 1755 | 2 | Lightning |
| 5 | Hekla | 1947 | 1 | A scientist filming the eruption was killed by a glowing block which rolled off the front of a lava flow, killing him instantly. |
| 6 | Hekla | 1510 | 1 | Man killed by block 20 km from volcano |
| 7 | Grímsvötn | 1861 | 1 | Man drowned in the aftermath of the eruption |
Volcanoes are only half of the story underground.
Earthquakes in Iceland
How many earthquakes in Iceland per day
The Icelandic Met Office's network detects thousands of small earthquakes every year. Counting the reviewed events in its catalogue for Iceland and the surrounding shelf, the average from 2016 to 2025 was 31,7213 a year, or about 873 a day. Including events detected only automatically, the average rises to about 1173 a day.
Busy years follow unrest. The most reviewed earthquakes came in 2020, with 48,0023, and the most detections overall in 2021, the year Fagradalsfjall began to erupt, with 72,6513. In 2014, the year of the Holuhraun eruption, 45,6343 earthquakes were reviewed, while the quietest year since 2000 was 2006, with 9,3013. Single months can be extreme: the Met Office's monthly overview reports nearly 10,00014 earthquakes in January 2024, against just over 1,75014 in December 2024. Counts from the early 1990s are not comparable: the network was less sensitive and recorded only about 2,4003 earthquakes a year. The chart below therefore fits its trend to 2000–2025 only, and the wide range shows how much single years swing.
Projection: linear trend of 2000–2025 yearly values, 95% prediction range. Our calculation, not a forecast.
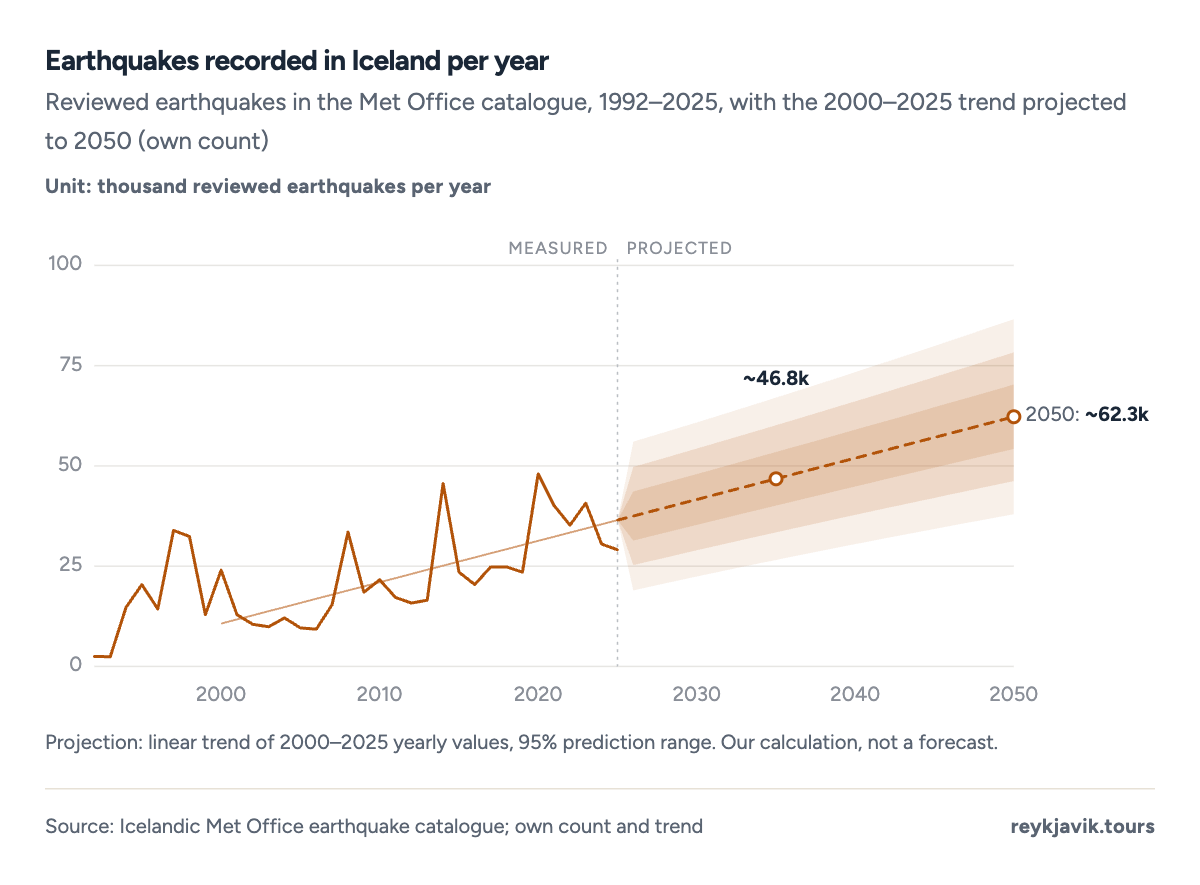
- 2020 had the most reviewed earthquakes, 48.0k.
- 2025 had 29.1k.
| 2025 | 36,248 | 29,066 | 79.6 |
| 2024 | 33,686 | 30,509 | 83.4 |
| 2023 | 62,894 | 40,739 | 111.6 |
| 2022 | 61,702 | 35,185 | 96.4 |
| 2021 | 72,651 | 40,139 | 110.0 |
| 2020 | 60,616 | 48,002 | 131.2 |
| 2019 | 24,771 | 23,538 | 64.5 |
| 2018 | 27,677 | 24,833 | 68.0 |
| 2017 | 25,861 | 24,774 | 67.9 |
| 2016 | 20,990 | 20,421 | 55.8 |
| 2015 | 23,778 | 23,472 | 64.3 |
| 2014 | 55,701 | 45,634 | 125.0 |
| 2013 | 19,148 | 16,453 | 45.1 |
| 2012 | 20,651 | 15,751 | 43.0 |
| 2011 | 22,295 | 17,151 | 47.0 |
| 2010 | 35,631 | 21,573 | 59.1 |
| 2009 | 21,996 | 18,549 | 50.8 |
| 2008 | 44,352 | 33,483 | 91.5 |
| 2007 | 17,866 | 15,415 | 42.2 |
| 2006 | 11,776 | 9,301 | 25.5 |
| 2005 | 11,593 | 9,612 | 26.3 |
| 2004 | 14,145 | 12,061 | 33.0 |
| 2003 | 11,452 | 9,934 | 27.2 |
| 2002 | 12,778 | 10,536 | 28.9 |
| 2001 | 15,650 | 12,936 | 35.4 |
| 2000 | 33,126 | 24,011 | 65.6 |
| 1999 | 22,087 | 12,851 | 35.2 |
| 1998 | 60,738 | 32,441 | 88.9 |
| 1997 | 47,519 | 33,928 | 93.0 |
| 1996 | 14,273 | 14,273 | 39.0 |
| 1995 | 20,353 | 20,353 | 55.8 |
| 1994 | 14,719 | 14,719 | 40.3 |
| 1993 | 2,414 | 2,414 | 6.6 |
| 1992 | 2,485 | 2,485 | 6.8 |
Biggest earthquake in Iceland
The largest known earthquakes in Iceland reach about magnitude 7. The South Iceland earthquake of 14 August 1784 has been estimated at 7.115, and earthquakes in 1910 off the north coast, in 1912 in Rangárvellir and in 1963 at the mouth of Skagafjörður at 7.015 each. In June 2000, two earthquakes of magnitude 6.515 struck South Iceland four days apart. On 29 May 2008, an earthquake near the mountain Ingólfsfjall, about 3 miles (5 km) northwest of Selfoss, was reported by the Met Office at 6.116 on the day. A later study modelled it as two shocks of magnitude 5.817 and 5.917 and noted that teleseismic data gave a magnitude of 6.317.
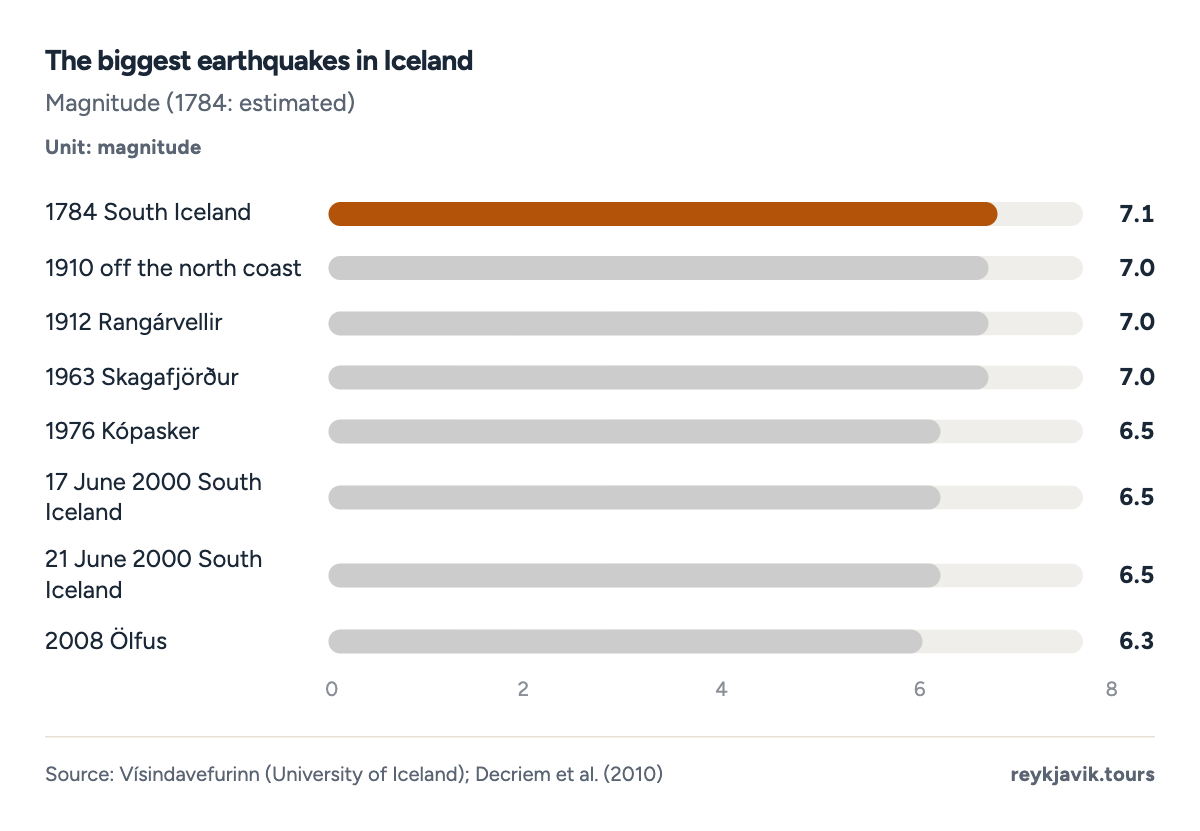
- The 1784 South Iceland earthquake is estimated at 7.1.
- The 2008 Ölfus earthquake measured 6.3.
| 14 Aug 1784 | South Iceland | 7.1 |
| 1910 | Off the north coast | 7.0 |
| 1912 | Rangárvellir, South Iceland | 7.0 |
| 1963 | Mouth of Skagafjörður | 7.0 |
| 1976 | Kópasker | 6.5 |
| 17 Jun 2000 | South Iceland Seismic Zone | 6.5 |
| 21 Jun 2000 | South Iceland Seismic Zone | 6.5 |
| 29 May 2008 | Ölfus, near Ingólfsfjall | 6.3 |
When eruptions reach the world
Most Icelandic eruptions are local events. Eyjafjallajökull in 2010 was not. Its ash cloud closed much of European airspace: EUROCONTROL counted 104,0005 cancelled flights between 15 and 22 April, 48%5 of expected traffic over those eight days, and 80%5 of flights were cancelled on 18 April alone. About 10 million5 passengers could not board their flights, and further ash in May added another 7,0005 cancellations. On 18 April, Europe had fewer than 5,0005 flights, against 24,7005 the Sunday before, and traffic did not return to normal until 23 April. Looking back in 2021, EUROCONTROL put the airlines' losses at €2.7 billion18 and estimated that a similar event today could cause up to 50,00018 cancellations.
How much CO2 did the Iceland volcano emit?
Iceland's largest lava eruption this century released more gas than the whole country's human activities. The Met Office's final estimate for Holuhraun is 9.6 million tonnes19 of sulphur dioxide and 5.1 million tonnes19 of carbon dioxide. Iceland's human-caused emissions in 2015 were 0.06 million tonnes19 of sulphur dioxide and 3 million tonnes19 of carbon dioxide, so the eruption released almost twice the carbon dioxide. The Met Office text calls the sulphur dioxide "16 times" the human total, but its own figures put the ratio at about 160 times19 (9.6 ÷ 0.06). The Met Office adds that Holuhraun released the most sulphur dioxide of any effusive eruption in the world on an annual basis since 197819, along with about 0.1 million tonnes19 of hydrogen chloride. For context, Iceland's total greenhouse gas emissions in 2024, including land use, were 11.0 million tonnes20 of CO₂ equivalent, of which 6.3 million tonnes20 came from land use. These totals cover all greenhouse gases, so they are not directly comparable with a volcano's carbon dioxide alone. No official carbon dioxide total could be found for the 2021–2025 Reykjanes eruptions.
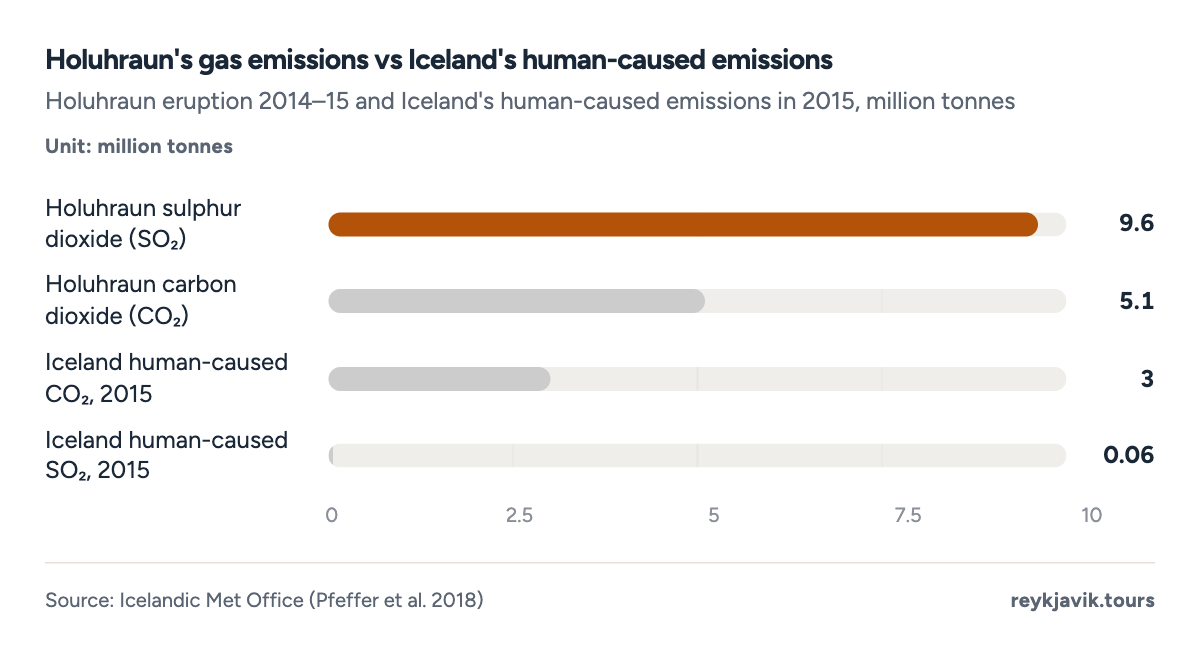
- Holuhraun released 9.6 million tonnes of sulphur dioxide.
- Iceland's human activities emitted 0.06 million tonnes in 2015.
| Holuhraun eruption, 2014–15 | 9.6 | 5.1 |
| Iceland human-caused emissions, 2015 | 0.06 | 3 |
What the numbers mean
Iceland lives with eruptions as a regular event, not a rare disaster: 481 since 1900, about one every 2.6 years11, and 121 in the 2020s so far. Most are small, but the record shows how far the effects can reach, from famine after Laki to 104,0005 cancelled flights in 2010 and gas emissions far above the country's own.
The Met Office's aviation colour codes run from green, for normal, through yellow and orange to red, for an eruption with significant ash. Bárðarbunga returned to green in June 2026 and Grímsvötn in January 2025, but the Reykjanes volcano has stayed yellow, signalling elevated unrest, since 5 August 2025.13 Ice adds another layer of risk and uncertainty, with 161 of the 33 systems partly under ice. The same geology also powers the country: geothermal energy provides over 60%21 of Iceland's primary energy.
Conclusions
- There is more than one right answer to the question. The official Catalogue counts 331 volcanic systems, 311 of them not marked inactive, while lists of individual volcanoes or offshore systems give higher numbers, and the popular "130" has no source.
- The 2020s are already the busiest decade for eruptions since 1900, with 121 so far, all of them on the Reykjanes Peninsula.
- The most active volcanoes are often under ice: 31 of the 51 highly active systems, Bárðarbunga, Grímsvötn and Katla, are partly glacier-covered, as the peer-reviewed review also notes.
- The biggest impacts came from lava floods and gas, not only from explosions. Laki, a lava eruption, was followed by famine and disease that killed about 9,5001 people, and Holuhraun released 9.6 million tonnes19 of sulphur dioxide, against 0.06 million tonnes from all human activity in Iceland in 2015.
Methodology
- Eruptions 1900–Sept 2026
- 33 volcanic systems
- Earthquakes 1992–2025
- Checked Sept 16, 2026
Definition. A volcanic system is a zone of fissures and craters, often with a central volcano, that shares one magma supply; the Catalogue of Icelandic Volcanoes counts systems rather than single mountains. Heights are in feet with metres, volumes in cubic kilometres.
Data sources. Volcanic systems, activity levels, heights, eruptions and deaths from the Catalogue of Icelandic Volcanoes,1 long-term eruption counts from Thordarson and Höskuldsson (2008),7 Reykjanes eruption dates from a compiled timeline,9 earthquakes from the Icelandic Met Office catalogue,3 earthquake magnitudes from the University of Iceland's Vísindavefurinn,15 flight cancellations from EUROCONTROL,5 and gas emissions from the Icelandic Met Office.19
Calculations. Eruptions since 1900 count each confirmed eruption once (Eyjafjallajökull 2010 as two phases, Krafla 1975–1984 as nine eruptions, a possible 1927 Esjufjöll eruption excluded). Ice cover and 'not inactive' are counts from the Catalogue descriptions. Earthquakes are unique reviewed events inside 62.8–67.8° N and 25.0–12.5° W. Laki's share uses Statistics Iceland's 1784 population. Trends are straight least-squares lines drawn forward to 2050 with a 95% prediction range.
Limitations. Counts of volcanoes depend on definitions, and the Smithsonian Global Volcanism Program database could not be accessed, so the country comparison uses NOAA's older list. Reykjanes dates come from a commercial timeline. Early earthquake counts reflect a less sensitive network. Projections are straight-line extrapolations, not forecasts.
Sources
- Icelandic Met Office, University of Iceland Institute of Earth Sciences and Civil Protection. “Catalogue of Icelandic Volcanoes.” Icelandic Met Office. icelandicvolcanos.is. Accessed 16 Sept. 2026. Back to text
- Thordarson, Thor and Chapman, Rachel. “Outline of Geology of Iceland.” University of Iceland, 2012. hi.is. Accessed 16 Sept. 2026. Back to text
- Icelandic Met Office. “Earthquake catalogue (Skjálftalísa API), 1992–2025; own yearly count.” Icelandic Met Office. api.vedur.is. Accessed 16 Sept. 2026. Back to text
- Statistics Iceland (Hagstofa Íslands). “Population – key figures 1703–2026 (MAN00000).” Statistics Iceland. px.hagstofa.is. Accessed 16 Sept. 2026. Back to text
- EUROCONTROL. “Ash-cloud of April and May 2010: impact on air traffic.” EUROCONTROL, 2010. eurocontrol.int. Accessed 16 Sept. 2026. Back to text
- EPOS ERIC. “Volcano observations: Catalogue of Icelandic Volcanoes.” European Plate Observing System. epos-eu.org. Accessed 16 Sept. 2026. Back to text
- Thordarson, Thor and Höskuldsson, Ármann. “Postglacial volcanism in Iceland (Jökull 58: 197–228).” Iceland Glaciological Society and Geoscience Society of Iceland, 2008. jokull.jorfi.is. Accessed 16 Sept. 2026. Back to text
- natt.is. “Eldstöðvar á Íslandi (volcanoes in Iceland).” natt.is (informational). natt.is. Accessed 16 Sept. 2026. Back to text
- volcanoexpress.is. “Reykjanes eruption timeline 2021–2025.” volcanoexpress.is (commercial). volcanoexpress.is. Accessed 16 Sept. 2026. Back to text
- NOAA National Centers for Environmental Information. “Volcano Locations Database (based on older Smithsonian Global Volcanism Program data).” NOAA NCEI. ngdc.noaa.gov. Accessed 16 Sept. 2026. Back to text
- Reykjavik Tours research. “Eruption counts and trends: calculation from the Catalogue of Icelandic Volcanoes.” Reykjavik Tours. reykjavik.tours. Accessed 16 Sept. 2026. Back to text
- Icelandic Met Office. “The ninth eruption on the Sundhnúkur crater row has ended.” Icelandic Met Office, 5 Aug. 2025. en.vedur.is. Accessed 16 Sept. 2026. Back to text
- Icelandic Met Office. “VONA notifications: aviation colour codes for Icelandic volcanoes.” Icelandic Met Office. en.vedur.is. Accessed 16 Sept. 2026. Back to text
- Icelandic Met Office. “Monthly overviews of earthquakes and volcanic activity, 2024.” Icelandic Met Office. vedur.is. Accessed 16 Sept. 2026. Back to text
- Einarsson, Páll. “Hverjir eru stærstu jarðskjálftar á Íslandi? (the largest earthquakes in Iceland).” Vísindavefurinn, University of Iceland, 19 Oct. 2012, updated 24 Feb. 2021. visindavefur.is. Accessed 16 Sept. 2026. Back to text
- Icelandic Met Office. “Earthquake in South Iceland, 29 May 2008.” Icelandic Met Office, 29 May 2008. en.vedur.is. Accessed 16 Sept. 2026. Back to text
- Decriem, J. et al.. “The 2008 May 29 earthquake doublet in SW Iceland (Geophysical Journal International 181(2)).” Oxford University Press, 2010. academic.oup.com. Accessed 16 Sept. 2026. Back to text
- EUROCONTROL. “11 years after the eruption of the Icelandic volcano Eyjafjallajökull.” EUROCONTROL, 17 Nov. 2021. eurocontrol.int. Accessed 16 Sept. 2026. Back to text
- Icelandic Met Office. “Final estimates of the emissions from the Holuhraun eruption based on ground-based measurements now published.” Icelandic Met Office, 22 Jan. 2018. en.vedur.is. Accessed 16 Sept. 2026. Back to text
- Umhverfis- og orkustofnun (Environment and Energy Agency of Iceland). “Nýjar bráðabirgðatölur: losun gróðurhúsalofttegunda á Íslandi 2024.” Umhverfis- og orkustofnun, 27 Aug. 2025. uos.is. Accessed 16 Sept. 2026. Back to text
- Orkustofnun (National Energy Authority). “Geothermal energy.” Orkustofnun. orkustofnun.is. Accessed 16 Sept. 2026. Back to text
About the author
Laufey turns public statistics on tourism and travel into research people can check and cite.
Every figure on this page links to its source. How we research
Related research
More data on Iceland's weather and travel from Reykjavik Tours.
- NatureHow Many Waterfalls in Iceland? (2026 Data)1,624 named waterfalls in IcelandRead the research →
- NatureBiggest Glacier in Iceland (2026 Data)7,720 km² Vatnajökull, Iceland's biggest glacierRead the research →
- NatureHow Often Does the Geysir in Iceland Erupt? (2026 Data)5-10 min between Strokkur's eruptionsRead the research →
- NatureHow Many Square Miles Is Iceland? (2026 Data)39,769 square miles: Iceland's total areaRead the research →
- HousingAverage Rent in Iceland (2026 Data)ISK 269k average monthly rent in IcelandRead the research →
- HousingHow Much Is a House in Iceland? (2026 Data)$467k-779k typical capital-region apartmentRead the research →