How Many People Live in Iceland? (2026 Data)
Iceland's population now and since 1703, where people live, their ages, births and deaths, migration and the official projection to 2074.
- Published
- Updated
- 19 sources
- 121 statistics
- 9 min read

- M.Sc. in Atmospheric Sciences, University of Iceland (Háskóli Íslands), with a minor thesis on North Atlantic storm-track variability
- Former research assistant at the Icelandic Meteorological Office (Veðurstofa Íslands), working on subarctic climate modeling and volcanic-ash dispersion forecasting
- B.A. in Sociology, also from the University of Iceland, with fieldwork on rural depopulation and tourism's impact on small fishing communities (Westfjords focus)
- Grew up in Akureyri, spent seven years living in Reykjavík and two in a small village in the Westfjords - brings first-hand experience of Iceland's regional weather extremes and community life
- Fluent in Icelandic and English; has translated Icelandic Met Office public advisories for international outlets
- Published field notes and data-driven pieces on glacier retreat (Vatnajökull), aurora forecasting, and the socioeconomic effects of overtourism in the Golden Circle

- M.A. in Journalism, University of Iceland, with additional coursework in Environmental Communication at the University of Bergen (Norway), giving a comparative Nordic lens
- 12+ years in Icelandic media, including editorial roles at RÚV (Iceland's national broadcaster) covering weather-related public safety reporting (storms, volcanic eruptions, road closures)
- Former fact-checking lead for a travel-and-culture desk, specializing in verifying tourism statistics, safety advisories, and climate data against primary sources (Vedur.is, Statistics Iceland)
- Has overseen editorial standards for bilingual (Icelandic/English) publications, ensuring both cultural nuance and accuracy for international readers
- Advocate for citing primary sources (Icelandic Met Office, Icelandic Tourist Board / Ferðamálastofa) rather than secondhand reporting
Key findings
- 396,500About 396,500 people live in Iceland, according to Statistics Iceland's count for the end of June 2026.
- 535,110Statistics Iceland projects that Iceland's population will reach 535,110 by 2050.
- 63.9%Almost two-thirds of Iceland's population, 63.9%, lives in the capital region around Reykjavík.
- 19.6%Immigrants make up 19.6% of Iceland's population, and people from Poland are the largest group.
- 1.56Iceland's fertility rate fell to 1.56 children per woman in 2024, the lowest since records began in 1853.
- 84.2Life expectancy in Iceland is 84.2 years for women and 81.0 years for men.
- 3.8Iceland has 3.8 people per square kilometre, the lowest density of the 35 countries in Eurostat's data.
- 260About 260 people with Down syndrome live in Iceland, according to a 2018 State Diagnostic and Counselling Centre estimate.
Iceland needed until 1926 to reach 100,000 people, and then only 81 more years to pass 300,000. Today the count stands at 396,5001, yet in 2024 the fertility rate fell to its lowest level since records began in 1853. The population now grows mainly through migration, not births.
That shift shapes where and how people live. Almost two-thirds of the population lives in the capital region, about 1 in 5 residents is an immigrant, and Statistics Iceland expects around 535,1102 people by 2050. This report brings together Statistics Iceland's population tables, Eurostat and World Bank comparisons and official health figures to show how many people live in Iceland, who they are, where they live and how the population is changing.
Iceland population over time
Statistics Iceland's population series starts with the census of 1703, which counted 50,3583 people. Growth was slow for two centuries: the population passed 100,000 only in 19263. It doubled to 200,000 by 19683, reached 300,000 in 20073 and 350,000 in 20203. On 1 January 2026 it stood at 394,3243, and by the end of June 2026 at 396,5001: 203,0801 men, 193,1801 women and 2301 people registered as non-binary or other.
The chart fits a straight line to the years since 2000, a period that includes both the decline of 2009–2010 and the fast growth that followed, and draws it forward to 2050, where it reaches about 480,0003 people. Statistics Iceland's own median projection, which models births, deaths and migration, is higher: 535,1102 people in 2050.
Projection: linear trend of 2000–2026 yearly values, 95% prediction range. Our calculation, not a forecast.
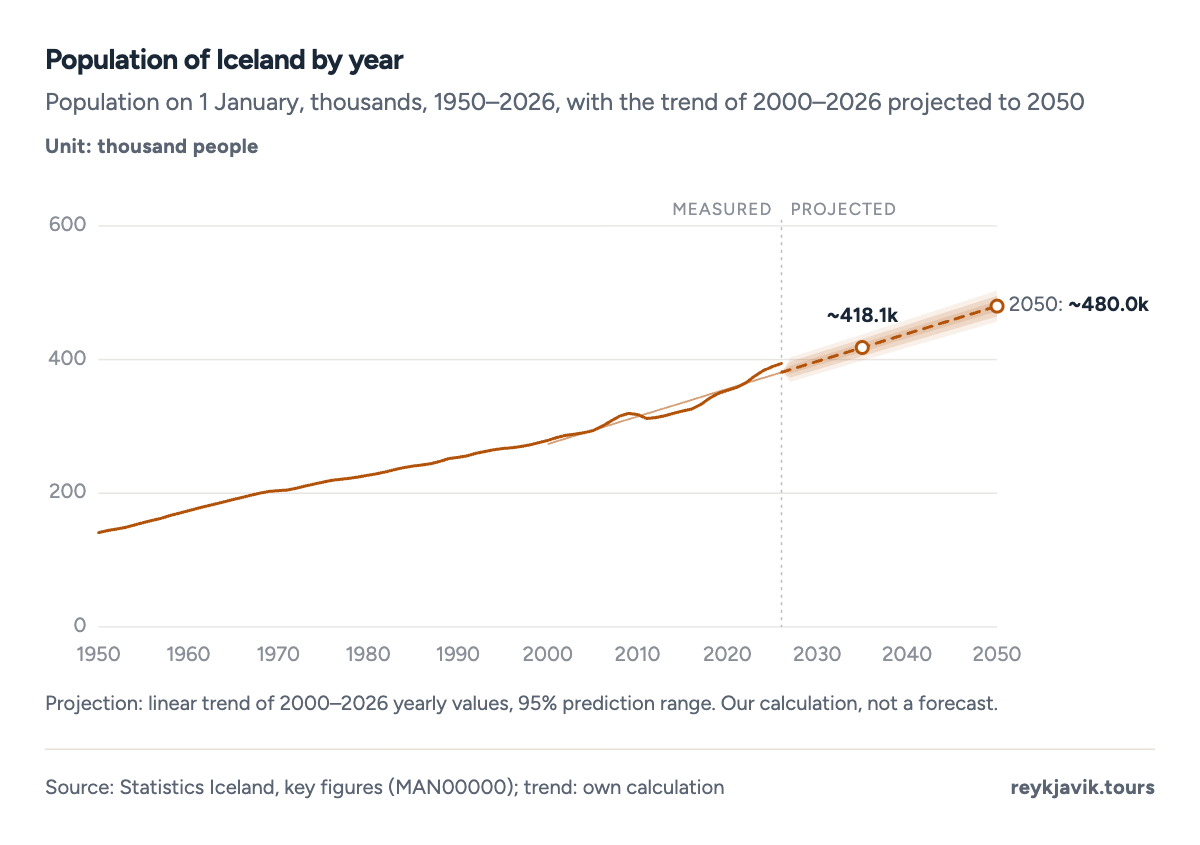
- The population was 394,324 on 1 January 2026.
- It passed 300,000 in 2007.
| Population | 396,500 | End of Q2 2026 |
| Men / women / non-binary or other | 203,080 / 193,180 / 230 | End of Q2 2026 |
| Change in the quarter | +1,450 | Q2 2026 |
| Change in a year | +4,690 (+1.2%) | Q2 2025–Q2 2026 |
| Population on 1 January | 394,324 | 2026 |
| First census | 50,358 | 1703 |
| Passed 100,000 / 200,000 | 1926 / 1968 | 1 January |
| Passed 300,000 / 350,000 | 2007 / 2020 | 1 January |
Iceland population growth rate
In the year to the end of June 2026 the population grew by 4,6904 people, or 1.2%4. Over a full calendar year, 2023 added 8,5083 people (+2.27%). Since 1951, the fastest growth came in 20173 at 2.91%, and the largest rise in numbers in 20223, when the population grew by 10,301. The only years of decline since 1951 were 2009 and 2010; in 2010 the population fell by 5,7893 people.
The World Bank publishes different figures for Iceland because it uses mid-year estimates. Its current release puts the 2023 population at 385,6635 and growth at 0.95%5. The figure of 393,396 that often appears in searches came from an earlier World Bank release and is no longer in its data. For Iceland's own count, Statistics Iceland is the primary source.
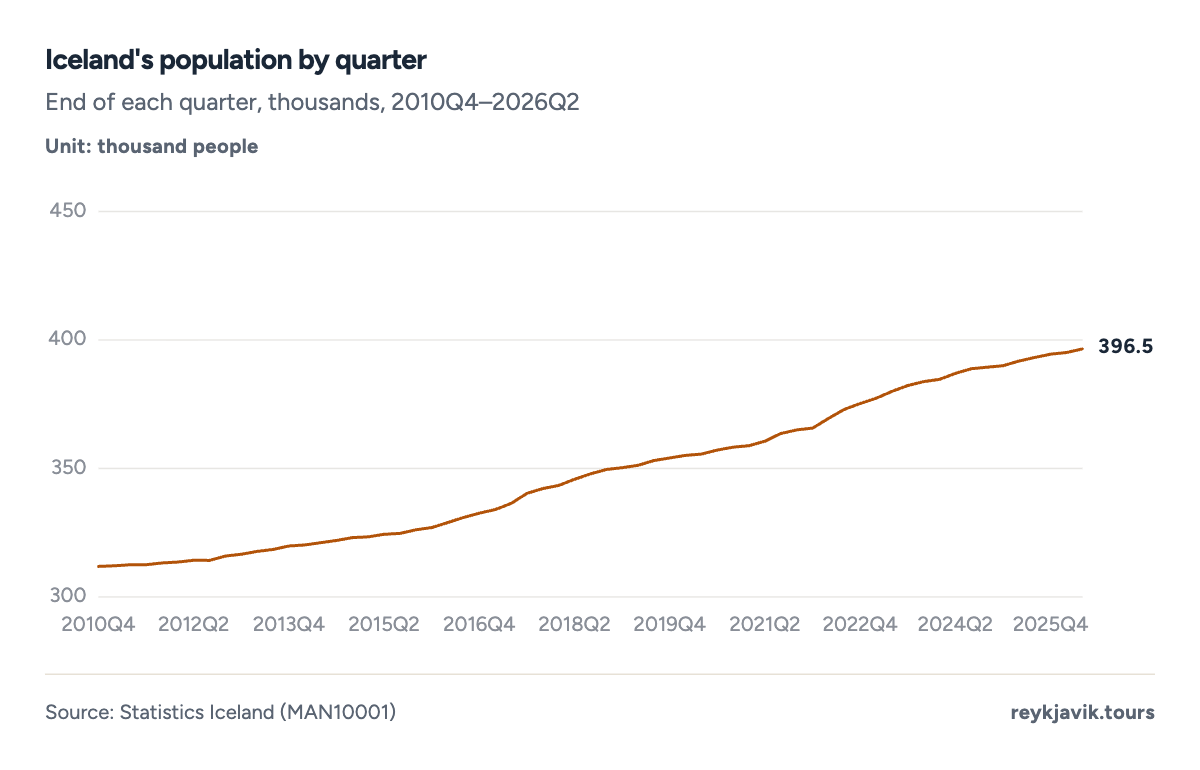
- The population was 396,500 at the end of June 2026.
- It was 311,890 at the end of 2010Q4.
How big will Iceland's population get?
Statistics Iceland's latest projection, based on 1 January 2025, expects growth to continue for four decades. In the median scenario the population reaches 462,6572 in 2035 and 535,1102 in 2050, peaks at 559,2902 in 20672 and then eases to 554,2332 by 2074.
The range is wide because migration is hard to predict. By 2074 the lowest scenario gives 453,0332 people and the highest 697,4522. The median scenario assumes that life expectancy keeps rising, to 87.02 years for women and 82.82 for men by 2050. Projections also miss in the short run: the median scenario expected 397,460 people on 1 January 2026, while the actual count was 394,324.
- Low
- Median
- High
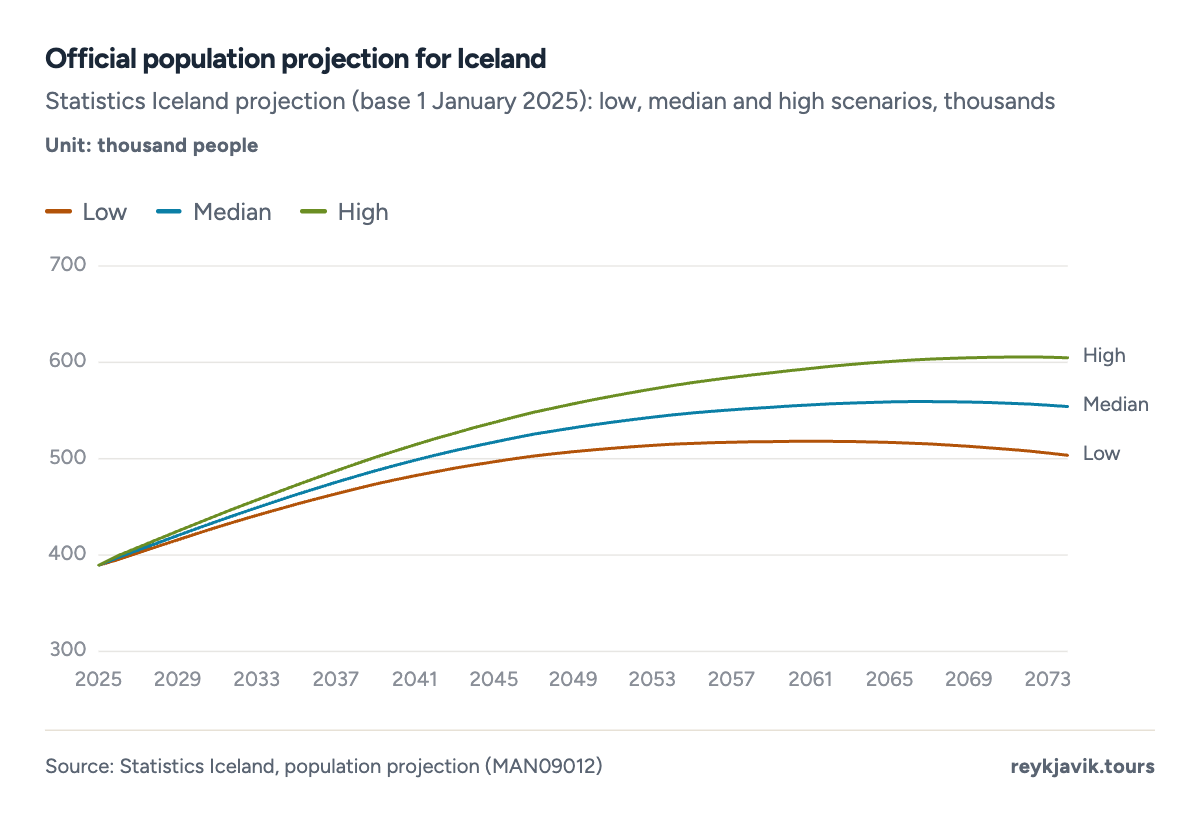
- The median scenario peaks at 559,290 in 2067.
- The high scenario reaches 604,833 by 2074.
| 2025 | 389,444 | 389,444 | 389,444 | 389,444 | 389,444 |
| 2026 | 393,263 | 395,362 | 397,460 | 399,559 | 401,871 |
| 2030 | 417,141 | 422,420 | 427,698 | 432,977 | 438,826 |
| 2035 | 442,940 | 452,799 | 462,657 | 472,516 | 483,724 |
| 2040 | 463,074 | 478,091 | 493,108 | 508,125 | 525,849 |
| 2045 | 476,402 | 496,851 | 517,300 | 537,749 | 563,224 |
| 2050 | 483,103 | 509,107 | 535,110 | 561,114 | 595,465 |
| 2055 | 484,452 | 515,920 | 547,387 | 578,855 | 623,233 |
| 2060 | 481,201 | 517,967 | 554,732 | 591,498 | 647,091 |
| 2065 | 474,882 | 516,868 | 558,853 | 600,839 | 668,775 |
| 2067 | 471,273 | 515,282 | 559,290 | 603,299 | 676,440 |
| 2070 | 464,500 | 511,417 | 558,333 | 605,250 | 686,513 |
| 2074 | 453,033 | 503,633 | 554,233 | 604,833 | 697,452 |
Population of Iceland by age
On 1 January 2026, 17.5%6 of the population were children under 15, 66.3%6 were of working age (15–64) and 16.2%6 were 65 or older. 14,8146 people were 80 or older. The largest five-year age group is people aged 30–34, with 31,8716 people, while the youngest group, children under five, numbers 22,5356.
Statistics Iceland also tracks the dependency ratio, the number of young (under 20) and old (65 and over) people for every 100 people aged 20–64. The old-age ratio has risen from 14.27 in 1951 to 27.07 in 2026, while the young-age ratio has fallen from 73.5 to 40.37.
- Working age (15–64)261,46066.3%
- Children (0–14)69,13517.5%
- 65 and older63,72916.2%
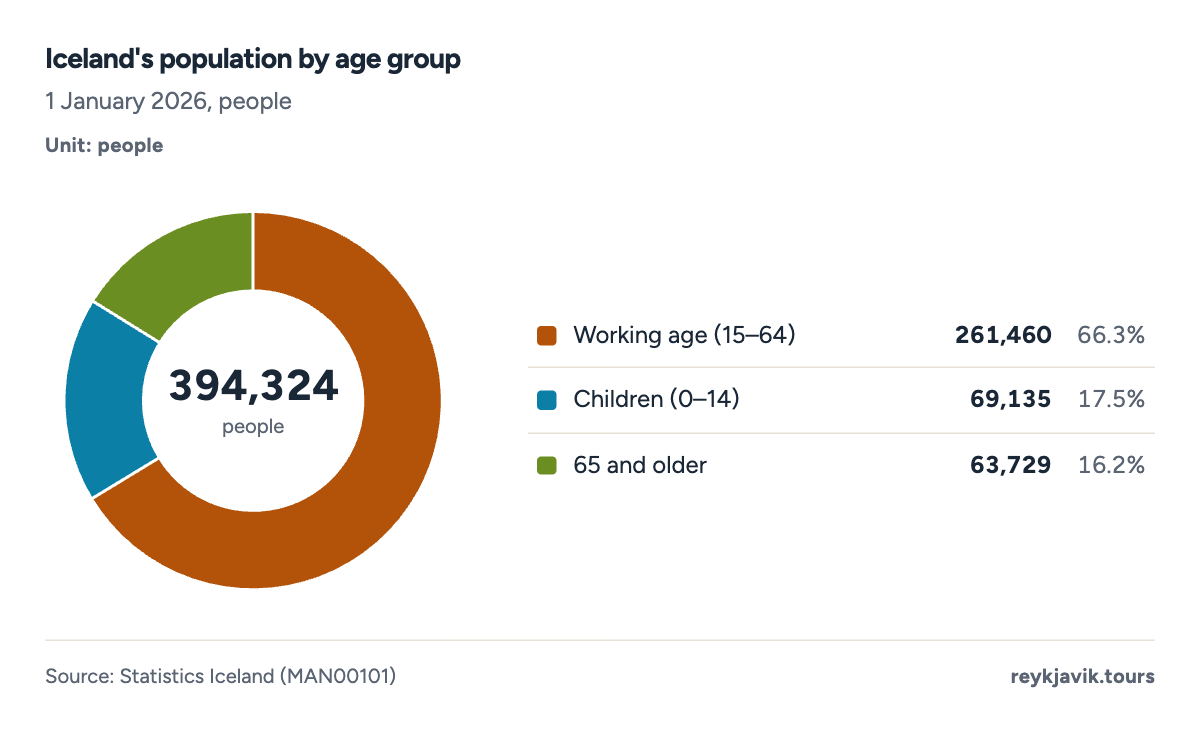
- 66.3% of people are aged 15–64.
- 16.2% are 65 or older.
- Young (under 20)
- Old (65+)
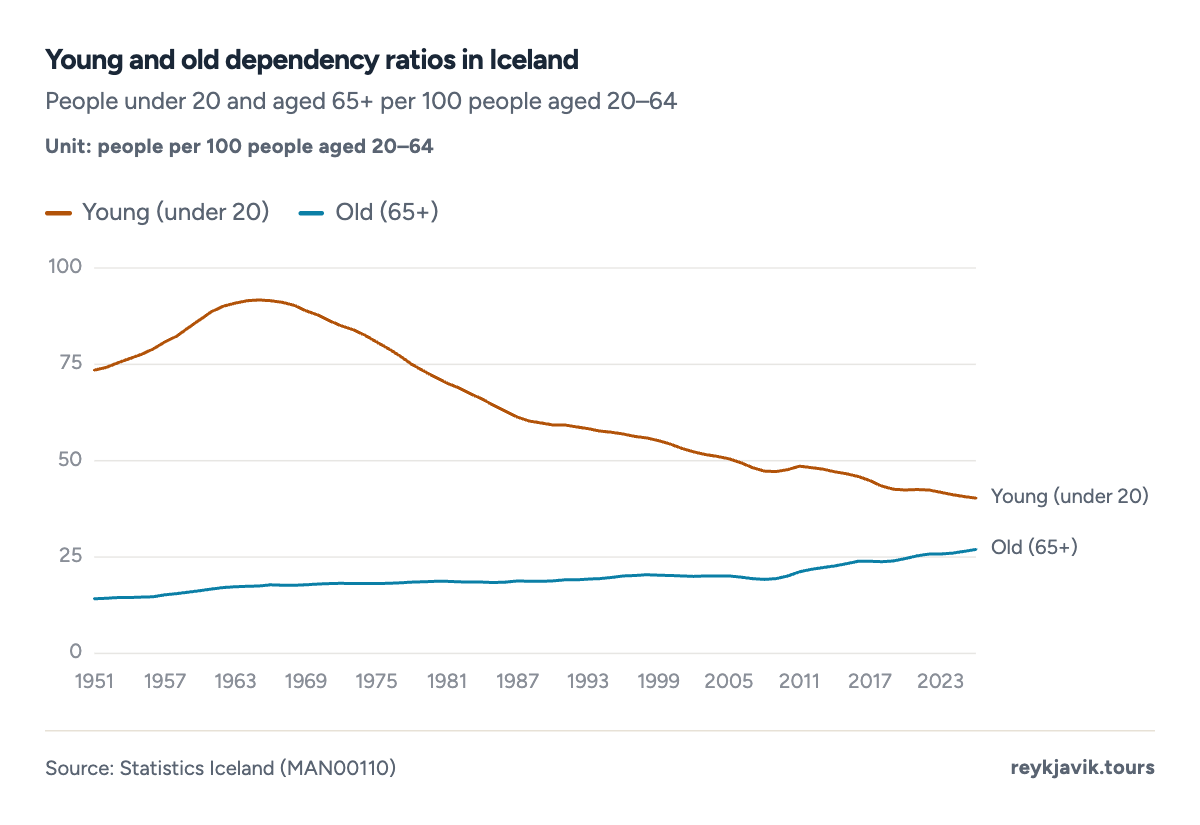
- The old-age ratio reached 27.0 in 2026.
- The young-age ratio fell to 40.3.
| 0-4 | 22,535 | 5.7 |
| 5-9 | 22,633 | 5.7 |
| 10-14 | 23,967 | 6.1 |
| 15-19 | 25,804 | 6.5 |
| 20-24 | 25,543 | 6.5 |
| 25-29 | 29,240 | 7.4 |
| 30-34 | 31,871 | 8.1 |
| 35-39 | 29,799 | 7.6 |
| 40-44 | 26,999 | 6.8 |
| 45-49 | 25,485 | 6.5 |
| 50-54 | 23,835 | 6.0 |
| 55-59 | 21,417 | 5.4 |
| 60-64 | 21,467 | 5.4 |
| 65-69 | 19,839 | 5.0 |
| 70-74 | 16,342 | 4.1 |
| 75-79 | 12,734 | 3.2 |
| 80-84 | 8,112 | 2.1 |
| 85-89 | 4,239 | 1.1 |
| 90+ | 2,463 | 0.6 |
Iceland median age
Half of Iceland's residents are younger than 37.56 and half are older, based on our calculation from Statistics Iceland's single-year age data. In 1970 that midpoint was 24.36. Statistics Iceland itself publishes the mean age, which was 39.26 in 2026 against 28.06 in 1841, the first year in the series.
- Men
- Women
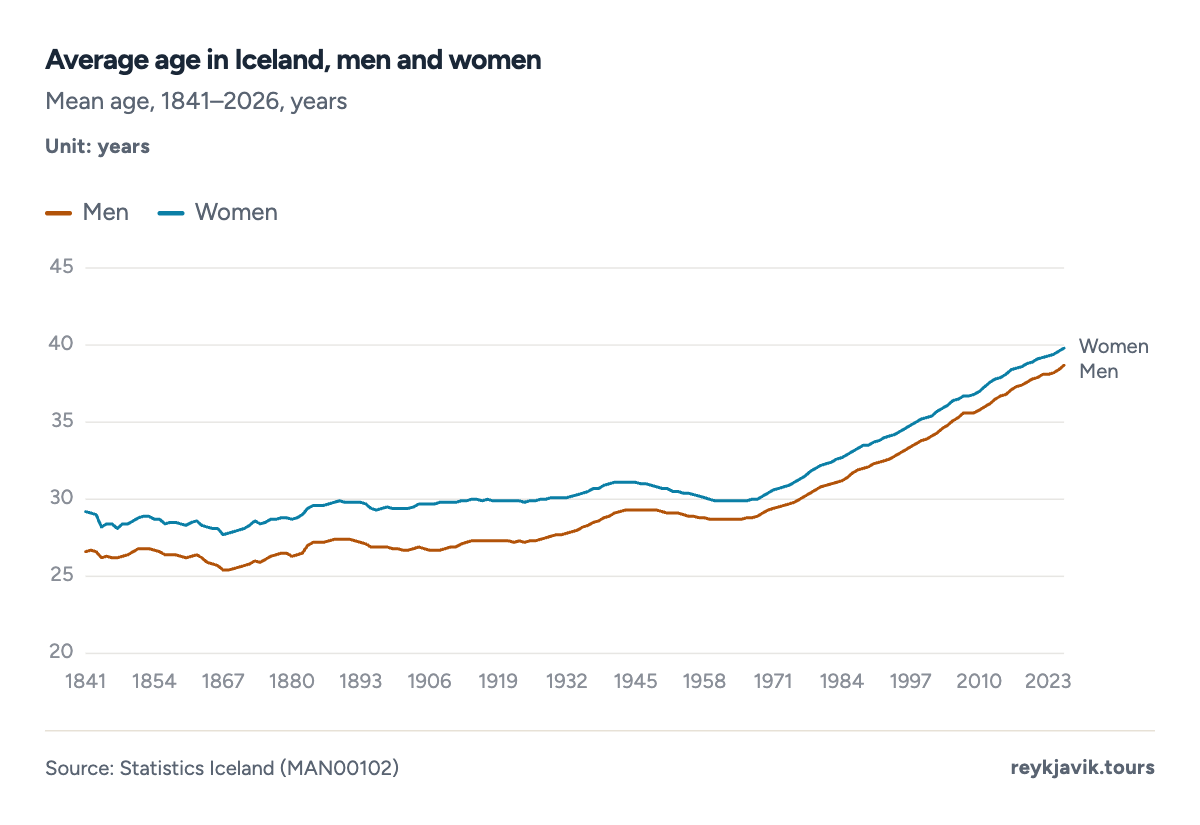
- Women's mean age was 39.8 in 2026.
- Men's mean age was 38.7.
Iceland population by gender
Iceland has slightly more men than women. On 1 January 2026 there were 202,1816 men and 191,9276 women, or 1,0536 men for every 1,000 women. Statistics Iceland also counts people registered as non-binary or other: 2301 at the end of June 2026.
Births, deaths and life expectancy
In 2025, 4,3878 children were born in Iceland and 2,6588 people died, a natural increase of 1,729. The most births in a single year were 5,0268 in 2009. In the same year, net migration added 3,1679 people, more than births minus deaths.
- Births
- Deaths
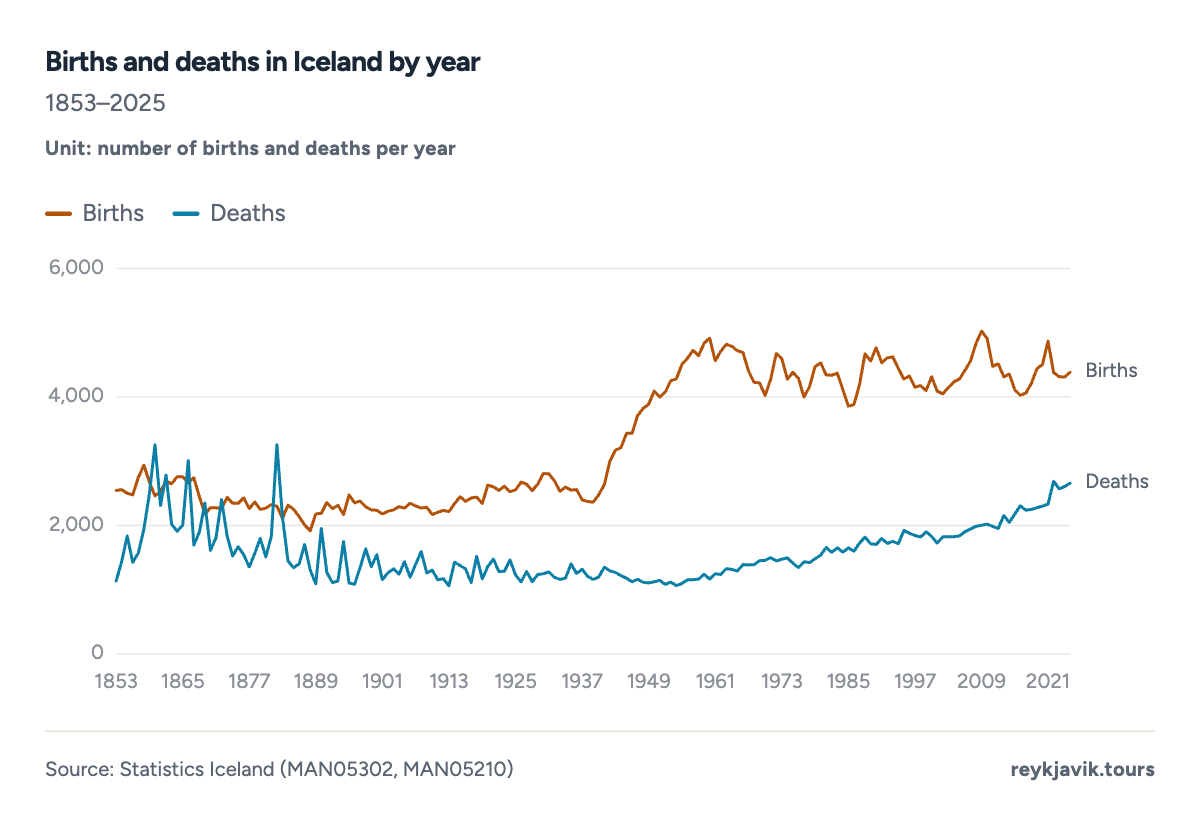
- Births peaked at 5,026 in 2009.
- 2,658 people died in 2025.
| 1860 | 2,460 | 3,256 | −796 | 4.58 |
| 1900 | 2,237 | 1,545 | 692 | 3.93 |
| 1950 | 4,093 | 1,122 | 2,971 | 3.86 |
| 1960 | 4,916 | 1,167 | 3,749 | 4.26 |
| 1980 | 4,528 | 1,538 | 2,990 | 2.48 |
| 2000 | 4,315 | 1,828 | 2,487 | 2.08 |
| 2010 | 4,907 | 2,020 | 2,887 | 2.20 |
| 2020 | 4,505 | 2,302 | 2,203 | 1.79 |
| 2025 | 4,387 | 2,658 | 1,729 | 1.56 |
Total fertility rate of Iceland
The total fertility rate, the average number of children a woman would have over her lifetime at current rates, was 5.668 in 1853. It fell to 2.318 by 1990 and to 1.568 in 2024, the lowest since the series began. In 2025 it was 1.568. A straight line through the years since 1990 keeps falling to 2050; Statistics Iceland's median projection instead assumes about 1.492 children per woman in 2050.
Projection: linear trend of 1990–2025 yearly values, 95% prediction range. Our calculation, not a forecast.
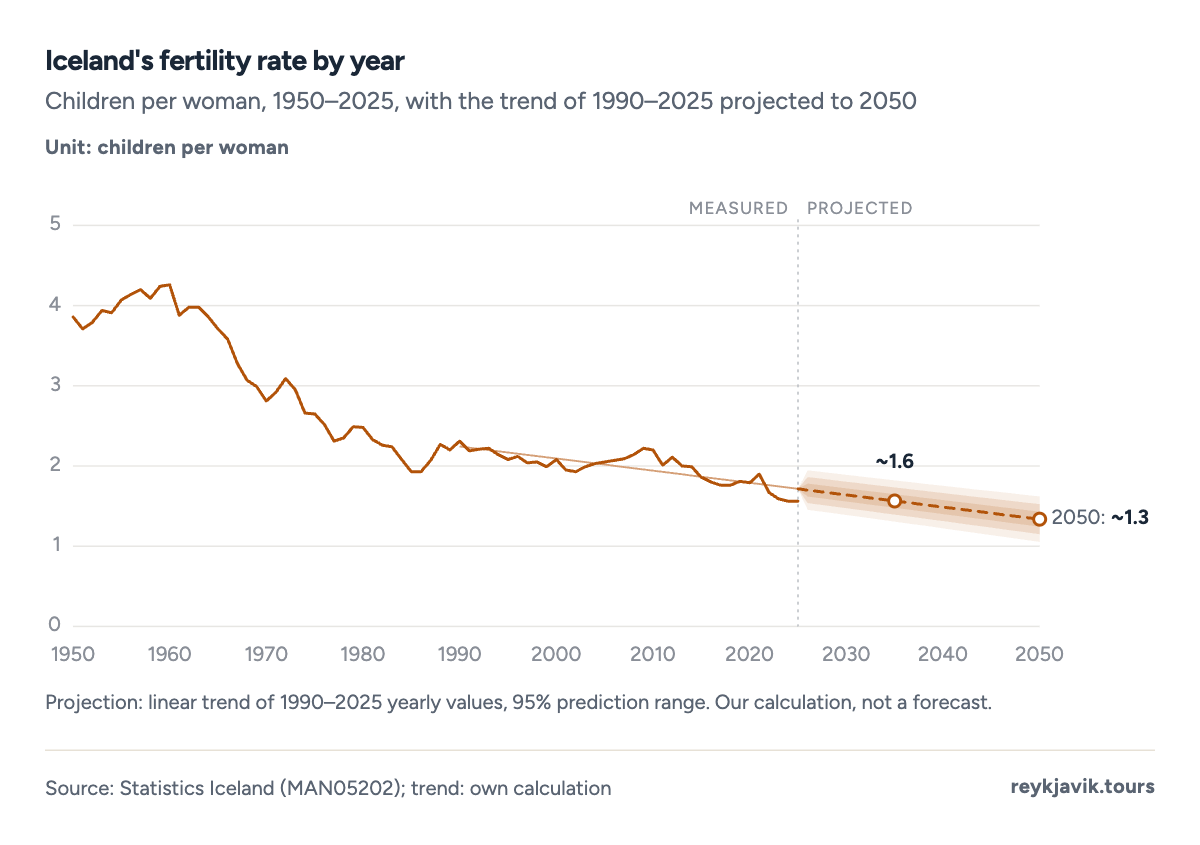
- The rate fell to 1.56 in 2024.
- It was 2.31 in 1990.
Statistics Iceland births by month
Averaged over 2016–2025, August8 has the most births, about 4008, and February8 the fewest, about 3258. Births rise through the summer and early autumn, from July to September, and are lowest in February and December. Single years vary: in 2025 the busiest month was October, with 4348 births, and the quietest February, with 3198.
- 351JanJ
- 325FebF
- 362MarM
- 351AprA
- 366MayM
- 356JunJ
- 390JulJ
- 400AugA
- 397SepS
- 390OctO
- 337NovN
- 327DecD
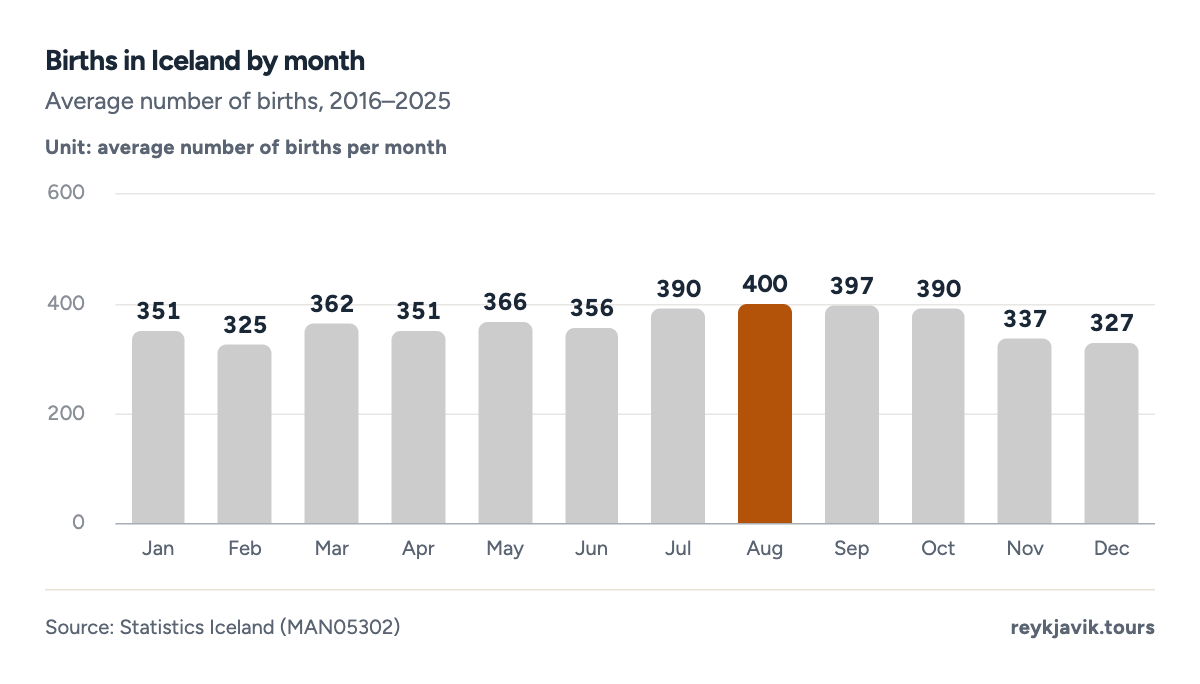
- August averages 400 births.
- February averages 325.
Average life expectancy in Iceland
A baby born in Iceland in 2025 could expect to live 84.210 years if a girl and 81.010 years if a boy. In 1971–1975 the figures were 77.510 and 71.610. Men have gained more, so the gap between women and men has narrowed from 5.9 to 3.2 years.
- Women
- Men
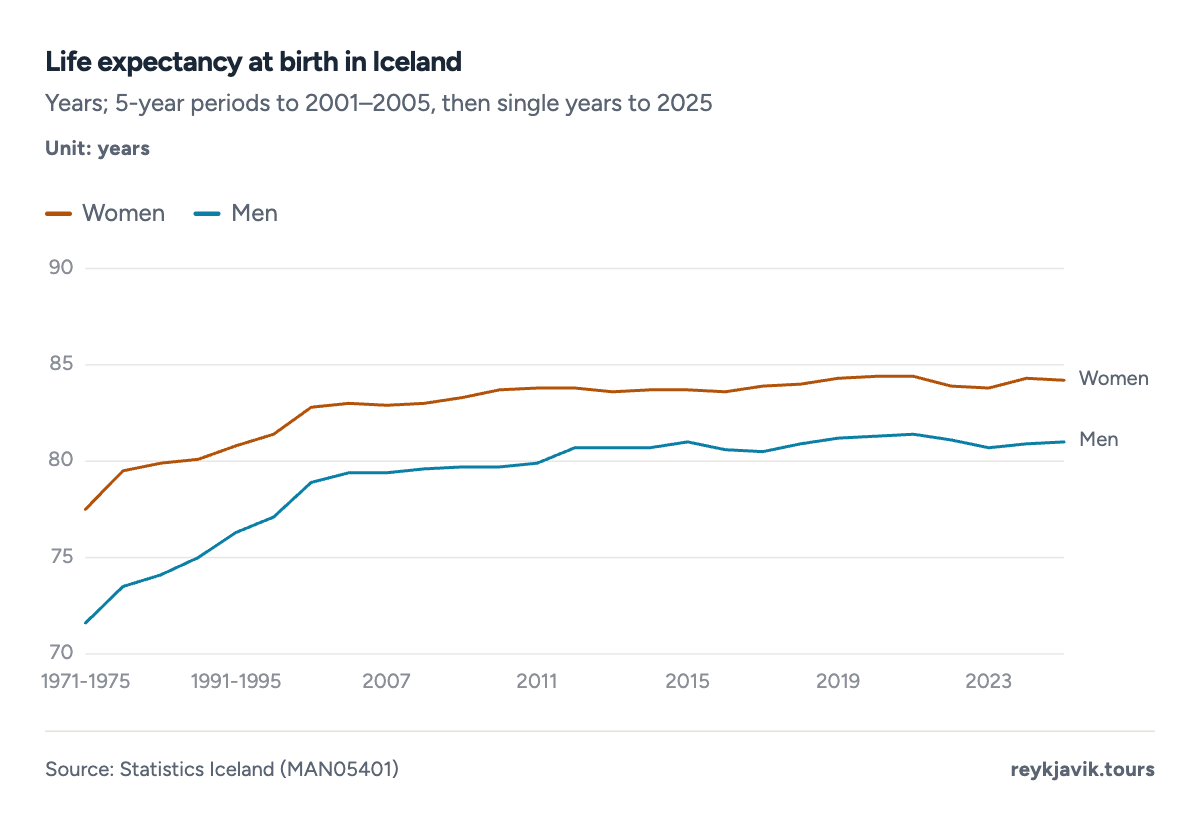
- Women's life expectancy was 84.2 in 2025.
- Men's was 81.0.
Iceland population by city
Most people live in and around the capital. The urban area of Greater Reykjavík had 247,16211 residents on 1 January 2026, followed by Keflavík and Njarðvík with 22,57211, Akureyri with 20,46711 and Selfoss with 11,06611. Only 4.5%11 of the population lives in rural areas outside towns and villages.
By region, the fastest growth over the last ten years came outside the capital: the South grew by 37.7%11 from 2016 to 2026 and the Southern Peninsula by 34.0%11, against 20.6% in the capital region.
Outside the southwest, the Northeast is the largest region with 32,29611 people, followed by the West with 17,99711 and the East with 11,21111. The Northwest and the Westfjords are the smallest, each with just over 7,300 residents, and the Westfjords grew by only 8.8%11 in ten years.
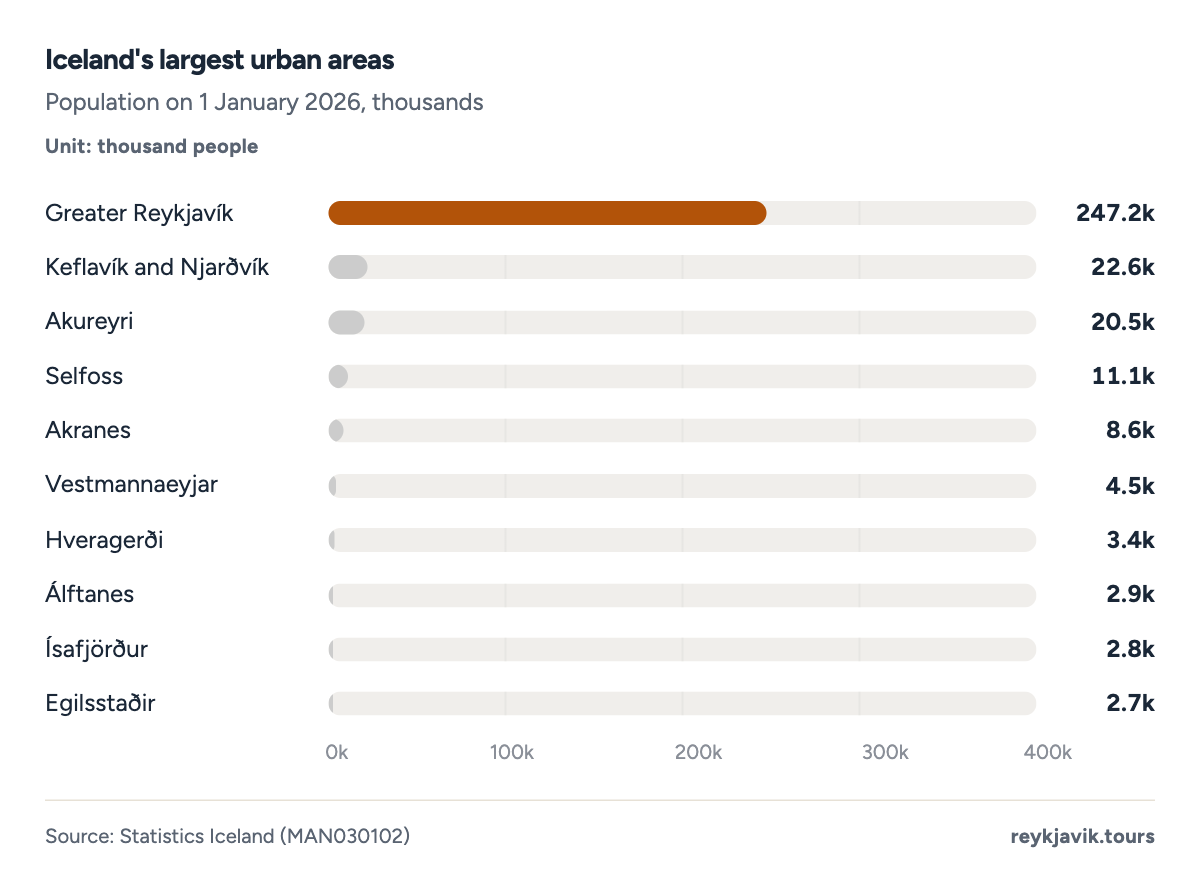
- Greater Reykjavík has 247,162 residents.
- Akureyri has 20,467.
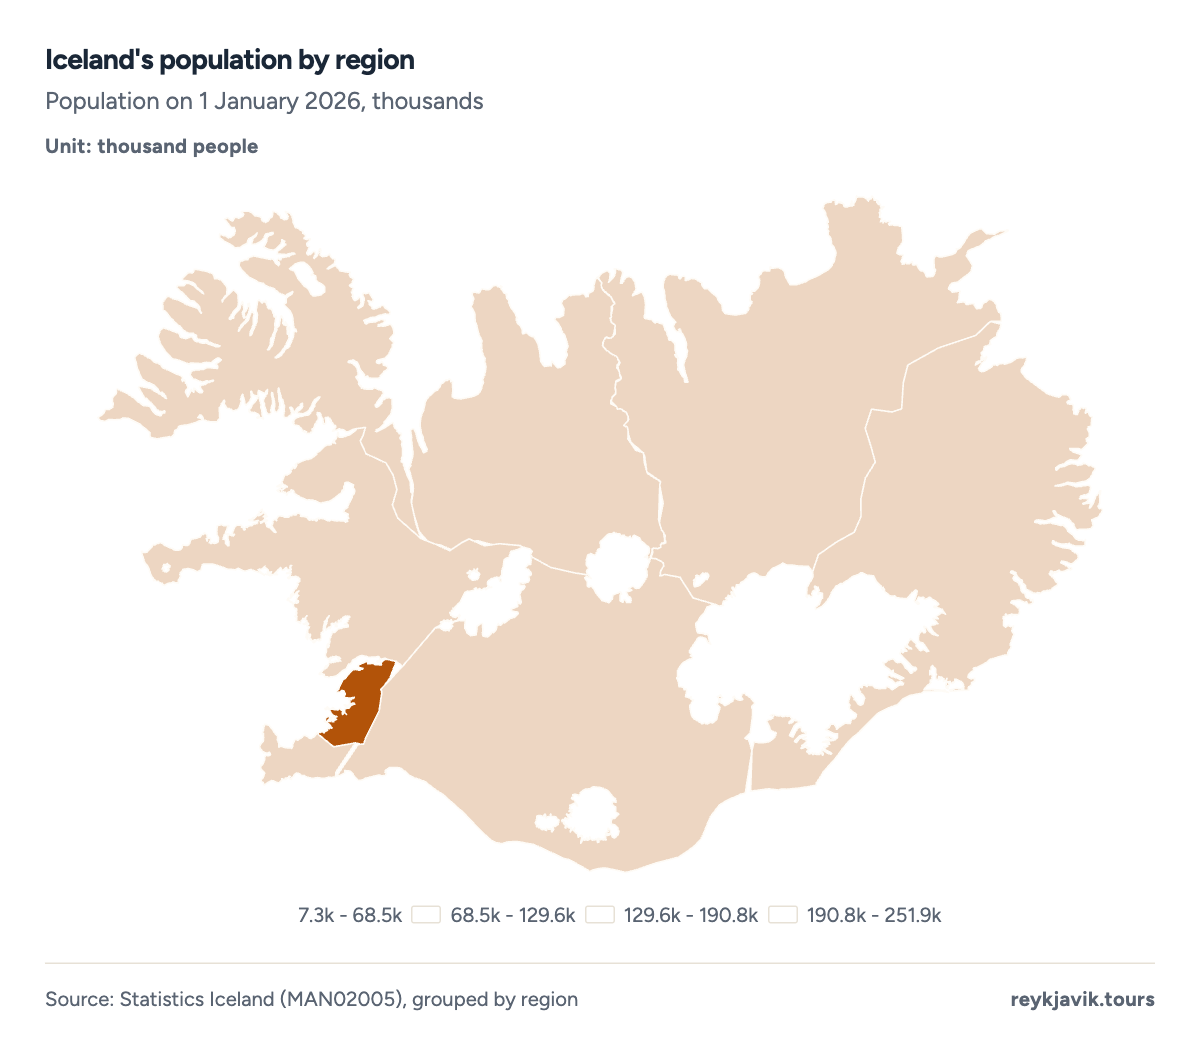
- The capital region has 251,912 people.
- The Westfjords have 7,341.
| 1 | Capital Region | 251,912 | 63.9 | 208,809 | 20.6 |
| 2 | South | 36,570 | 9.3 | 26,551 | 37.7 |
| 3 | Northeast | 32,296 | 8.2 | 29,044 | 11.2 |
| 4 | Southern Peninsula | 29,644 | 7.5 | 22,116 | 34.0 |
| 5 | West | 17,997 | 4.6 | 15,564 | 15.6 |
| 6 | East | 11,211 | 2.8 | 10,163 | 10.3 |
| 7 | Northwest | 7,353 | 1.9 | 7,043 | 4.4 |
| 8 | Westfjords | 7,341 | 1.9 | 6,746 | 8.8 |
| 1 | Greater Reykjavík | 247,162 | 204,825 |
| 2 | Keflavík and Njarðvík | 22,572 | 14,841 |
| 3 | Akureyri | 20,467 | 17,974 |
| 4 | Selfoss | 11,066 | 6,881 |
| 5 | Akranes | 8,607 | 6,894 |
| 6 | Vestmannaeyjar | 4,518 | 4,232 |
| 7 | Hveragerði | 3,353 | 2,433 |
| 8 | Álftanes | 2,916 | 2,437 |
| 9 | Ísafjörður | 2,807 | 2,506 |
| 10 | Egilsstaðir | 2,719 | 2,293 |
| 11 | Sauðárkrókur | 2,672 | 2,532 |
| 12 | Húsavík | 2,403 | 2,161 |
| 13 | Þorlákshöfn | 2,316 | 1,468 |
| 14 | Borgarnes | 2,250 | 1,872 |
| 15 | Sandgerði | 2,188 | 1,505 |
| 16 | Vík í Mýrdal | 740 | 318 |
How many people live in Reykjavik
The municipality of Reykjavík, Reykjavíkurborg, had 140,4704 residents at the end of June 2026, more than three times as many as Kópavogur, the second-largest municipality, with 40,2404.
What percentage of Iceland's population live in Reykjavik
The municipality alone holds 35.4%4 of the country's population. Counting the whole capital region, including Kópavogur, Hafnarfjörður and the other surrounding municipalities, the share rises to 63.9%1.
How many people live in Vik Iceland
Vík í Mýrdal, the village on the south coast, had 74011 residents on 1 January 2026, up from 31811 in 2016, more than double. The wider municipality, Mýrdalshreppur, grew from 51311 to 1,00411 over the same years.
From a single village to the whole map: spread across about 103,000 km²12 of land, Iceland's population works out at 3.8512 people per square kilometre, or about 10 per square mile. Eurostat's regional data puts Iceland at 3.8, the lowest of the 35 countries it covers, well below the next lowest, Norway at 15.313.
Iceland foreign-born population percentage
On 1 January 2026, 77,2269 immigrants lived in Iceland, people born abroad whose parents and grandparents were also born abroad. That is 19.6%9 of the population, up from 9.1% in 2016. Counted by citizenship, foreign citizens made up 17.9%9 of residents in 2026, against 2.6%9 in 2000.
People from Poland are by far the largest group, with 23,3299 Polish citizens, followed by citizens of Lithuania (4,725) and Ukraine (4,636). Migration now drives most of Iceland's growth: net migration added 3,1679 people in 2025 and peaked at 8,6609 in 2022. The balance differs sharply by citizenship. In 2025 foreign citizens added 3,5129, while 3459 more Icelandic citizens left than moved back, as they did in 7 of the 11 years from 2015 to 2025.
Projection: linear trend of 2005–2026 yearly values, 95% prediction range. Our calculation, not a forecast.
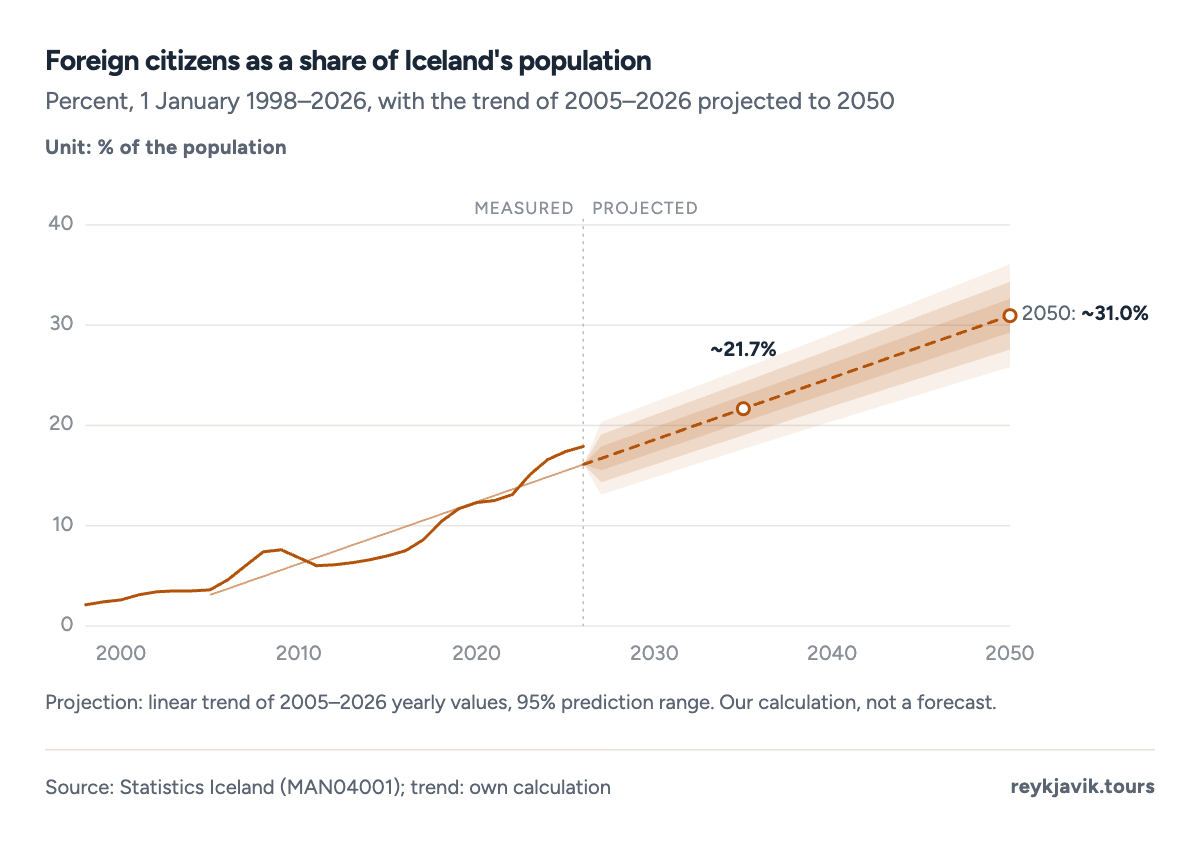
- Foreign citizens were 17.9% of residents in 2026.
- The share was 2.6% in 2000.
Projection: linear trend of 2005–2026 yearly values, 95% prediction range. Our calculation, not a forecast.
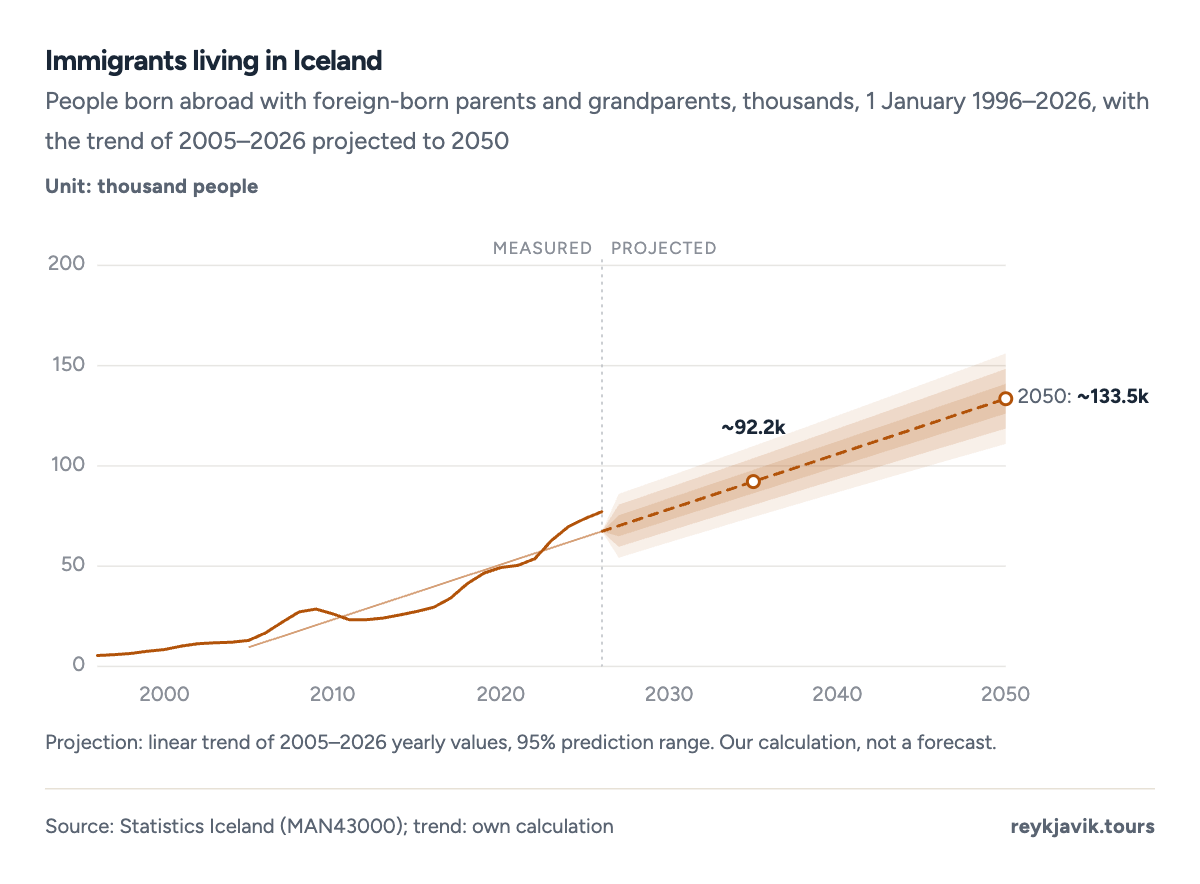
- 77,226 immigrants lived in Iceland in 2026.
- There were 5,357 in 1996.
- Foreign citizens
- Icelandic citizens
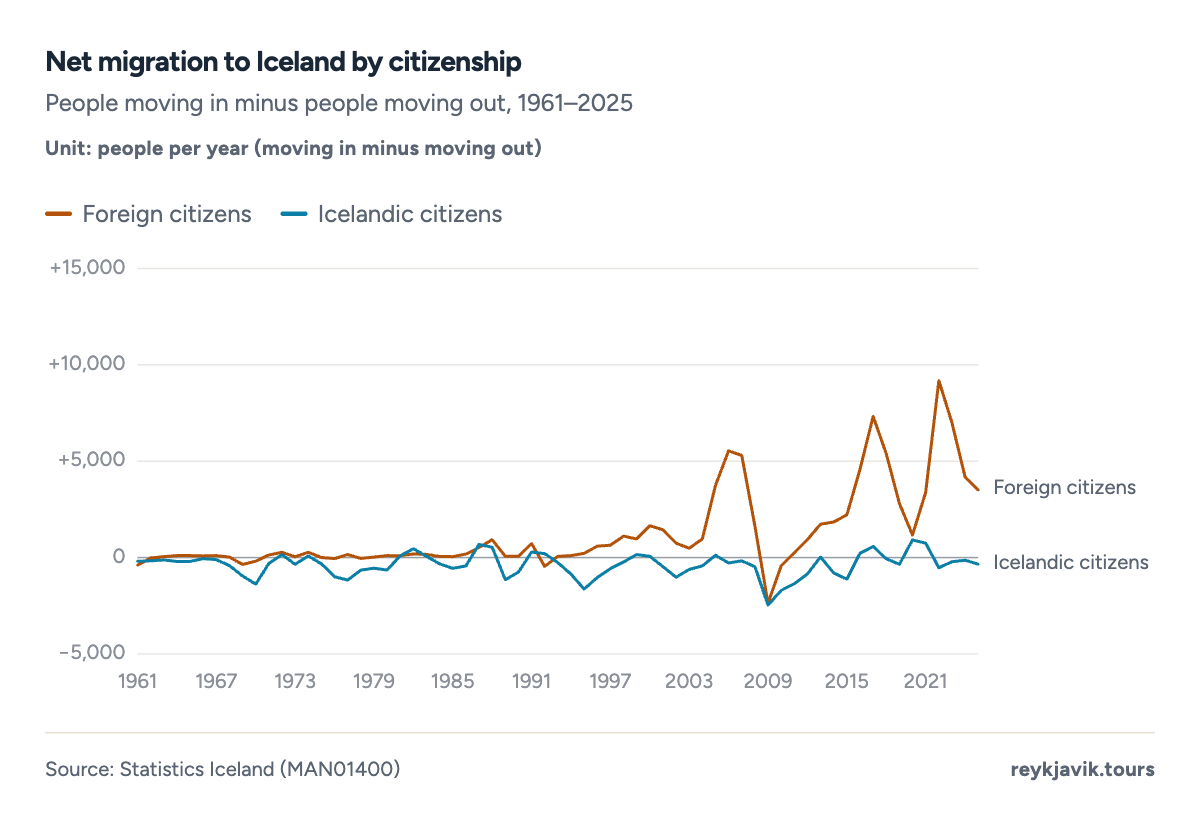
- Foreign citizens added 3,512 in 2025.
- Icelandic citizens' net migration was -345 in 2025.
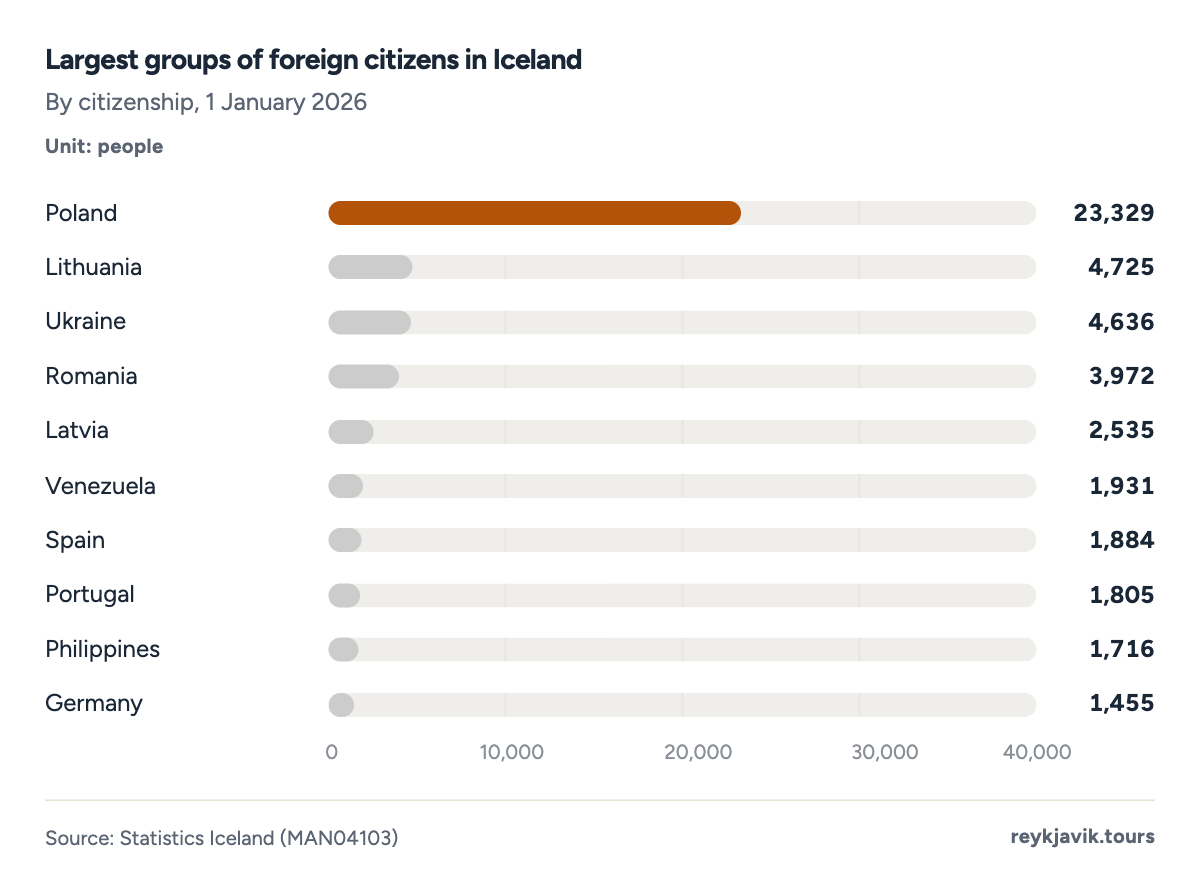
- 23,329 Polish citizens live in Iceland.
- Lithuania follows with 4,725.
| 1 | Poland | 23,329 | 33.1 | 11,451 |
| 2 | Lithuania | 4,725 | 6.7 | 1,682 |
| 3 | Ukraine | 4,636 | 6.6 | 150 |
| 4 | Romania | 3,972 | 5.6 | 399 |
| 5 | Latvia | 2,535 | 3.6 | 736 |
| 6 | Venezuela | 1,931 | 2.7 | 7 |
| 7 | Spain | 1,884 | 2.7 | 456 |
| 8 | Portugal | 1,805 | 2.6 | 605 |
| 9 | Philippines | 1,716 | 2.4 | 518 |
| 10 | Germany | 1,455 | 2.1 | 863 |
| 11 | Viet Nam | 1,188 | 1.7 | 241 |
| 12 | Czechia | 1,155 | 1.6 | 249 |
| 13 | United States | 1,113 | 1.6 | 505 |
| 14 | Italy | 1,076 | 1.5 | 226 |
| 15 | Croatia | 976 | 1.4 | 48 |
| 2008 | +1,144 | −477 | +1,621 |
| 2009 | −4,835 | −2,466 | −2,369 |
| 2010 | −2,134 | −1,703 | −431 |
| 2011 | −1,114 | −1,358 | +244 |
| 2012 | +88 | −844 | +932 |
| 2013 | +1,764 | +32 | +1,732 |
| 2014 | +1,047 | −799 | +1,846 |
| 2015 | +1,103 | −1,117 | +2,220 |
| 2016 | +4,794 | +222 | +4,572 |
| 2017 | +7,905 | +579 | +7,326 |
| 2018 | +5,331 | −65 | +5,396 |
| 2019 | +2,464 | −346 | +2,810 |
| 2020 | +2,079 | +912 | +1,167 |
| 2021 | +4,128 | +747 | +3,381 |
| 2022 | +8,660 | −526 | +9,186 |
| 2023 | +6,790 | −214 | +7,004 |
| 2024 | +4,044 | −139 | +4,183 |
| 2025 | +3,167 | −345 | +3,512 |
How many Americans live in Iceland
1,1139 US citizens lived in Iceland on 1 January 2026, more than twice the 5059 of 2016. That is about 0.28% of the population. The count covers citizenship only, so Americans who also hold Icelandic citizenship are counted as Icelanders.
Iceland among Europe's smallest countries
In Eurostat's table of population on 1 January 2025, which covers 41 European countries, Iceland is the 3rd smallest13 with 389,44413 people. Only Monaco, with 38,42313, and Liechtenstein, with 40,88613, are smaller. Andorra, San Marino and Vatican City, which all have fewer people than Iceland, have no figure in that table. Among the Nordic countries, Norway has about 14 times13 as many people as Iceland.
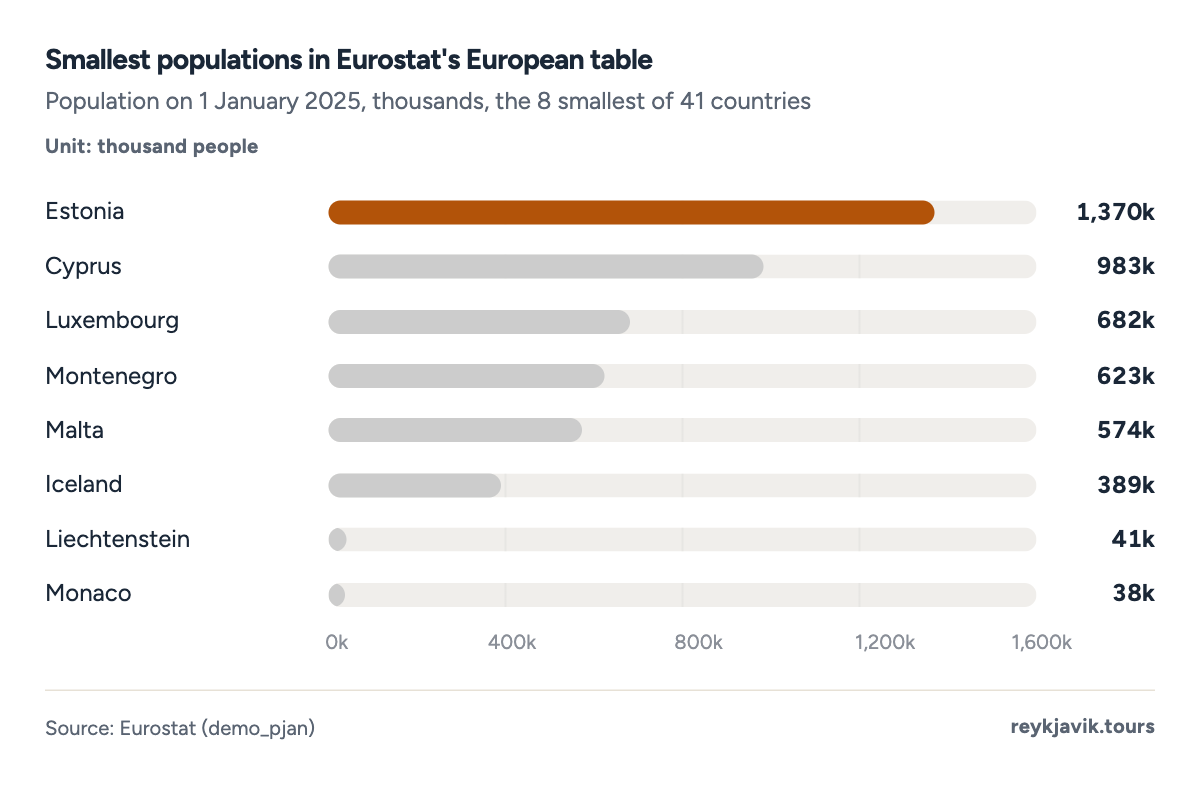
- Iceland has 389,444 people in Eurostat's table.
- Monaco has 38,423.
| 1 | Monaco | 38,423 |
| 2 | Liechtenstein | 40,886 |
| 3 | Iceland | 389,444 |
| 4 | Malta | 574,250 |
| 5 | Montenegro | 623,327 |
| 6 | Luxembourg | 681,973 |
| 7 | Cyprus | 982,966 |
| 8 | Estonia | 1,369,995 |
| 9 | North Macedonia | 1,822,612 |
| 10 | Latvia | 1,860,565 |
| 11 | Slovenia | 2,130,850 |
| 12 | Albania | 2,363,314 |
| 13 | Moldova | 2,415,549 |
| 14 | Lithuania | 2,890,664 |
| 15 | Armenia | 2,991,201 |
Behind the totals are individual lives, and one of the most searched questions about Iceland's population is about health.
How many people in Iceland have Down syndrome
About 26014 people with Down syndrome lived in Iceland according to a 2018 estimate by the State Diagnostic and Counselling Centre. A peer-reviewed study of Europe estimated 23415 people with Down syndrome in Iceland in 2015, compared with 2,88715 in Denmark and about 419,00015 across Europe.
Prenatal screening is offered to all pregnant women: an ultrasound at 11–14 weeks, optionally combined with a blood test for a risk assessment, and a scan at 20 weeks. The Directorate of Health's patient portal states that it is the expectant parents' choice whether to accept screening.16 The State Diagnostic and Counselling Centre estimated in 2018 that 75–85%14 of expectant parents choose it.
Official figures come from the Minister of Health's answers to parliament. From 2007 to 2012, between 3,16117 and 3,62317 women a year were screened at 12 weeks, and trisomy 21 was diagnosed at 12 weeks in 3817 pregnancies; the answer's table records 3717 terminations. For 2002–2006, an earlier answer recorded 3318 cases, 2718 of them diagnosed during pregnancy, and stated that all but two of the women diagnosed ended the pregnancy. The centre's 2018 overview puts the number of children born with Down syndrome at between 2 and 10 per birth year. At the start of the 2000s, incidence was estimated at about 1 in 850 births.19
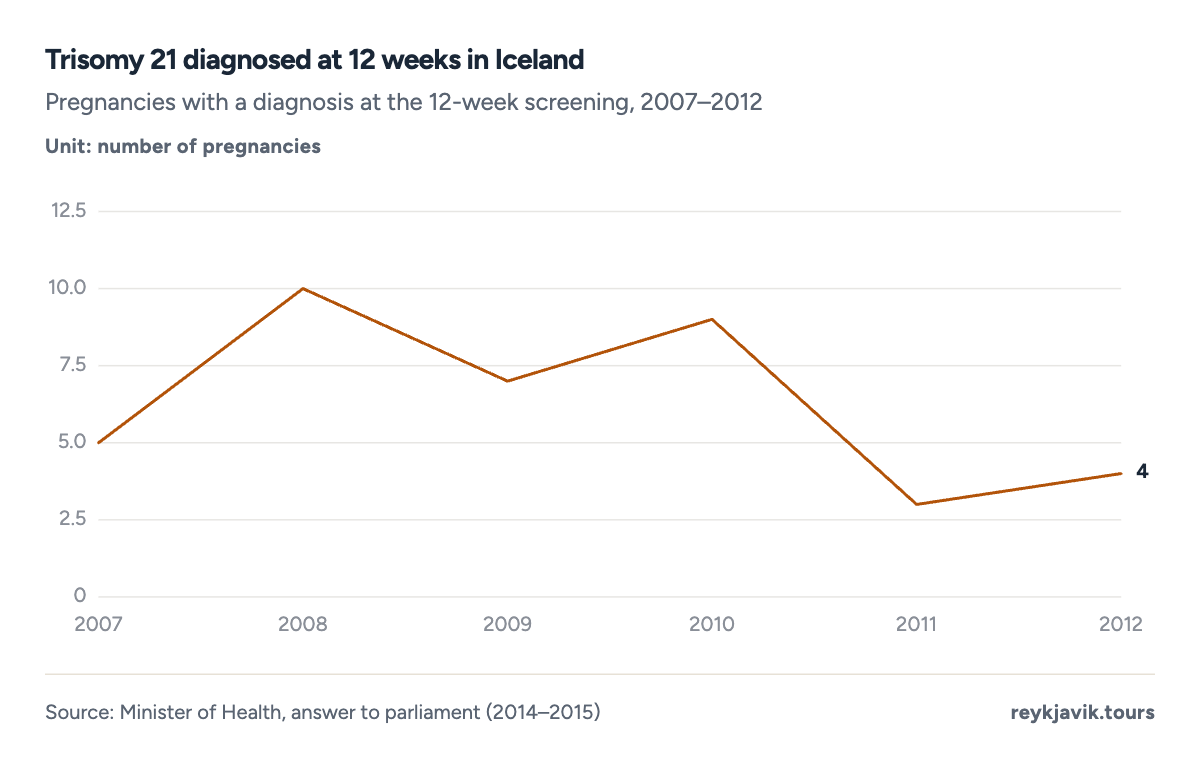
- The most diagnoses were 10 in 2008.
- The total for 2007–2012 was 38.
| 2007 | 3,161 | 5 | 5 |
| 2008 | 3,482 | 10 | 10 |
| 2009 | 3,623 | 7 | 7 |
| 2010 | 3,505 | 9 | 8 |
| 2011 | 3,297 | 3 | 3 |
| 2012 | 3,392 | 4 | 4 |
| 2007–2012 | 20,460 | 38 | 37 |
What the numbers mean
Iceland's population figures point in one direction: growth depends on people moving to the country. In 2025, births exceeded deaths by 1,729, while net migration added 3,167, and the fertility rate is at its lowest level on record. In 2025, net migration of foreign citizens alone, 3,512 people, was about twice the natural increase.
The age structure is shifting at the same time. The old-age dependency ratio has risen from 14.2 to 27.0 since the early 1950s, while the share of children has fallen. And growth is uneven across the map: the South and the Southern Peninsula have grown faster than the capital region over the last decade, and a village like Vík í Mýrdal has more than doubled in ten years.
Conclusions
- Iceland now grows through migration, not births. The fertility rate reached a record low of 1.56 in 2024, while immigrants make up 19.6% of the population and net migration in 2025 was almost twice the natural increase.
- The population is concentrating in the southwest. Almost two-thirds of people live in the capital region, yet the fastest growth of the last ten years came in the South and on the Southern Peninsula.
- Iceland is ageing slowly. The mean age has risen from 28.0 in 1841 to 39.2 today, and the number of people aged 65 and over per 100 of working age keeps climbing.
- Small numbers make every figure sensitive. In a population of under 400,000, a few hundred people change a percentage, as the counts for Vík í Mýrdal and for people with Down syndrome show.
Methodology
- Population 1703–2026
- Projection to 2074
- 62 municipalities
- Checked Sept 16, 2026
Definition. Population means people registered as living in Iceland (Statistics Iceland's population register). Immigrants are people born abroad whose parents and grandparents were also born abroad; foreign citizens are residents without Icelandic citizenship.
Data sources. Population, age, births, deaths, fertility, life expectancy, places, citizenship and migration from Statistics Iceland's PX tables and its news release of 31 July 2026;1 the official projection from Statistics Iceland;2 European comparisons from Eurostat;13 World Bank figures for comparison;5 land area from the University of Iceland's science web;12 Down syndrome figures from the Minister of Health's answers to parliament,17 the Directorate of Health's patient portal,16 the State Diagnostic and Counselling Centre14 and a peer-reviewed European study.15
Calculations. Median age is our calculation from single-year ages on 1 January 2026 (Statistics Iceland publishes the mean age). Regions group the 62 municipalities by Statistics Iceland's municipality numbering. Density divides the population by 103,000 km². Trend projections are least-squares lines with a 95% prediction range, fitted from 2000 (population), 1990 (fertility) and 2005 (foreign citizens and immigrants).
Limitations. Charts of population and immigrants show thousands. Statistics Iceland changed its population method in 2024 and revised 2011–2024; this page uses the current tables. World Bank figures use a different basis. Official Down syndrome birth counts by year after 2012 were not found; screening figures cover diagnoses at the 12-week screening only.
Sources
- Statistics Iceland (Hagstofa Íslands). “The population grew by 1,450 in the second quarter of 2026.” Statistics Iceland, 31 July 2026. statice.is. Accessed 16 Sept. 2026. Back to text
- Statistics Iceland. “Population projection by main indicators 2026–2075 (MAN09012).” Statistics Iceland. px.hagstofa.is. Accessed 16 Sept. 2026. Back to text
- Statistics Iceland. “Population – key figures 1703–2026 (MAN00000).” Statistics Iceland. px.hagstofa.is. Accessed 16 Sept. 2026. Back to text
- Statistics Iceland. “Population by municipality, sex, citizenship and quarters 2011–2026 (MAN10001).” Statistics Iceland. px.hagstofa.is. Accessed 16 Sept. 2026. Back to text
- World Bank. “World Development Indicators: Population, total (SP.POP.TOTL) and growth (SP.POP.GROW), Iceland.” World Bank, 13 July 2026. data.worldbank.org. Accessed 16 Sept. 2026. Back to text
- Statistics Iceland. “Population by sex and age 1841–2026 (MAN00101) and mean age (MAN00102).” Statistics Iceland. px.hagstofa.is. Accessed 16 Sept. 2026. Back to text
- Statistics Iceland. “Population by age groups and dependency ratios (MAN00110).” Statistics Iceland. px.hagstofa.is. Accessed 16 Sept. 2026. Back to text
- Statistics Iceland. “Births by months 1853–2025 (MAN05302) and fertility rates (MAN05202).” Statistics Iceland. px.hagstofa.is. Accessed 16 Sept. 2026. Back to text
- Statistics Iceland. “Foreign citizens (MAN04001), citizenship (MAN04103), origin (MAN43000) and external migration (MAN01400).” Statistics Iceland. px.hagstofa.is. Accessed 16 Sept. 2026. Back to text
- Statistics Iceland. “Life expectancy 1971–2025 (MAN05401).” Statistics Iceland. px.hagstofa.is. Accessed 16 Sept. 2026. Back to text
- Statistics Iceland. “Population by municipality (MAN02005) and by localities (MAN030102), 1 January 2026.” Statistics Iceland. px.hagstofa.is. Accessed 16 Sept. 2026. Back to text
- Vísindavefur Háskóla Íslands. “Hvað er Ísland stórt? (answer 14349, citing Landmælingar Íslands).” University of Iceland. visindavefur.is. Accessed 16 Sept. 2026. Back to text
- Eurostat. “Population on 1 January (demo_pjan) and population density (demo_r_d3dens).” European Commission. ec.europa.eu. Accessed 16 Sept. 2026. Back to text
- Ráðgjafar- og greiningarstöð (State Diagnostic and Counselling Centre). “Downs-heilkenni á Íslandi.” Ráðgjafar- og greiningarstöð, 21 Mar. 2018. rgr.is. Accessed 16 Sept. 2026. Back to text
- de Graaf, G., Buckley, F., Skotko, B. G.. “Estimation of the number of people with Down syndrome in Europe.” European Journal of Human Genetics, 2020. pmc.ncbi.nlm.nih.gov. Accessed 16 Sept. 2026. Back to text
- Heilsuvera (Directorate of Health and Primary Health Care of the Capital Region). “Fósturskimanir (prenatal screening).” Heilsuvera. heilsuvera.is. Accessed 16 Sept. 2026. Back to text
- Minister of Health (Heilbrigðisráðherra). “Svar við fyrirspurn um fósturgreiningar (answer on prenatal diagnoses), þingskjal 430.” Alþingi, 144th session, 2014–2015. althingi.is. Accessed 16 Sept. 2026. Back to text
- Minister of Health (Heilbrigðisráðherra). “Svar við fyrirspurn um fósturskimun og fóstureyðingar, þingskjal 587.” Alþingi, 135th session, 2007–2008. althingi.is. Accessed 16 Sept. 2026. Back to text
- Sigurðardóttir, Solveig. “Downs-heilkenni á Íslandi (Down syndrome in Iceland).” Læknablaðið 87 (supplement 42), 2001. laeknabladid.is. Accessed 16 Sept. 2026. Back to text
About the author
Laufey turns public statistics on tourism and travel into research people can check and cite.
Every figure on this page links to its source. How we research
Related research
More data on Iceland's weather and travel from Reykjavik Tours.
- SocietyWhat Is the Biggest City in Iceland? (2026 Data)140,470 residents of Reykjavík, Iceland's biggest cityRead the research →
- SocietyIceland Ethnic Composition Percentage (2026 Data)70.9% of Iceland's residents have no foreign backgroundRead the research →
- SocietyIceland Average Height for Men and Women (2026 Data)5 ft 11 in average height of young Icelandic menRead the research →
- TravelHow Many Days in Iceland? (2026 Data)7.1 nights average stay of foreign visitorsRead the research →
- WeatherIceland Temperature by Month (2026 Data)39 °F average temperature in IcelandRead the research →
- WeatherIceland Weather by Month (2026 Data)4.5 in rain in September, Iceland's wettest monthRead the research →