Iceland Average Height for Men and Women (2026 Data)
How tall Icelandic men and women are, how a century of birth years changed that, where Iceland ranks among 200 countries, and the weight, obesity and other everyday averages searched alongside it.
- Published
- Updated
- 14 sources
- 181 statistics
- 11 min read

- M.Sc. in Atmospheric Sciences, University of Iceland (Háskóli Íslands), with a minor thesis on North Atlantic storm-track variability
- Former research assistant at the Icelandic Meteorological Office (Veðurstofa Íslands), working on subarctic climate modeling and volcanic-ash dispersion forecasting
- B.A. in Sociology, also from the University of Iceland, with fieldwork on rural depopulation and tourism's impact on small fishing communities (Westfjords focus)
- Grew up in Akureyri, spent seven years living in Reykjavík and two in a small village in the Westfjords - brings first-hand experience of Iceland's regional weather extremes and community life
- Fluent in Icelandic and English; has translated Icelandic Met Office public advisories for international outlets
- Published field notes and data-driven pieces on glacier retreat (Vatnajökull), aurora forecasting, and the socioeconomic effects of overtourism in the Golden Circle

- M.A. in Journalism, University of Iceland, with additional coursework in Environmental Communication at the University of Bergen (Norway), giving a comparative Nordic lens
- 12+ years in Icelandic media, including editorial roles at RÚV (Iceland's national broadcaster) covering weather-related public safety reporting (storms, volcanic eruptions, road closures)
- Former fact-checking lead for a travel-and-culture desk, specializing in verifying tourism statistics, safety advisories, and climate data against primary sources (Vedur.is, Statistics Iceland)
- Has overseen editorial standards for bilingual (Icelandic/English) publications, ensuring both cultural nuance and accuracy for international readers
- Advocate for citing primary sources (Icelandic Met Office, Icelandic Tourist Board / Ferðamálastofa) rather than secondhand reporting
Key findings
- 5 ft 11.1 inThe Iceland average height is 5 ft 11.1 in for young men and 5 ft 5.3 in for women.
- 9thIcelandic men are the 9th tallest of 200 countries, and Icelandic women rank 12th.
- 3.9 inchesIcelandic men born in 1996 are 3.9 inches (10.0 cm) taller than men born in 1896.
- 5 ft 11.4 inIcelandic men were tallest in the 1974 birth cohort, at 5 ft 11.4 in (181.4 cm).
- 24%About 24% of Icelandic men and 22% of women were living with obesity in 2024.
- 7 ft 8 inThe tallest Icelander on record, Jóhann Svarfdælingur, measured 7 ft 8 in (2.34 m).
- 68Golf Iceland's tee-time portal lists 68 golf courses, 18 of them with 18 holes.
- 170Iceland has about 170 swimming centres, 145 of them heated with geothermal water.
A young Icelandic man stands about 5 ft 11.1 in1 tall, taller than the men of Norway, Sweden and Finland, and less than an inch shorter than the Dutch. That height took a century to build: Icelandic men born in 1896 averaged 5 ft 7.1 in1, and the gain stopped with the generation born in the 1970s. Weight moved the other way, and later. The share of Icelandic men living with obesity rose from 6.4%2 in 1980 to 24.0%2 in 2024.
This report uses the peer-reviewed estimates of the NCD Risk Factor Collaboration for height, BMI and obesity, WHO's Global Health Observatory, and Iceland's Directorate of Health. It covers height by birth year, rank among 200 countries, how children grow, weight and obesity, and the offbeat Icelandic counts people search for next: the tallest Icelander, golf courses, swimming pools and books.
Average male height in Iceland
The best comparable measure of adult height is the mean height at age 18 by year of birth, estimated for 200 countries by the NCD Risk Factor Collaboration (NCD-RisC) from population-based measurements. For Icelandic men born in 1996, the most recent birth year in the study, it is 180.5 cm1. The 95% uncertainty range for that birth year runs from 176.71 to 184.3 cm1, wider than for earlier years because fewer measurements of the youngest cohort were available.
Iceland average height in feet and inches
In US units, 180.5 cm is 71.1 inches, or 5 ft 11.1 in3. Icelandic women born in the same year average 65.3 inches, or 5 ft 5.3 in3, so the gap between the sexes is about 5.7 inches3 (14.5 cm).
Height climbed for most of the 20th century. Men born in 1896 averaged 170.5 cm1 (5 ft 7.1 in), men born in 1936 178.5 cm1 and men born in 1956 180.6 cm1. The peak came with the 1974 birth cohort, at 181.4 cm,1 and men born later are slightly shorter: the 1996 cohort is 0.9 cm3 below the peak, well inside the uncertainty range. If the straight-line trend of the 1976–1996 birth years continued, men born in 2050 would average about 70.1 inches3, but a plateau is the more likely reading of the data.
Projection: linear trend of 1976–1996 yearly values, 95% prediction range. Our calculation, not a forecast.
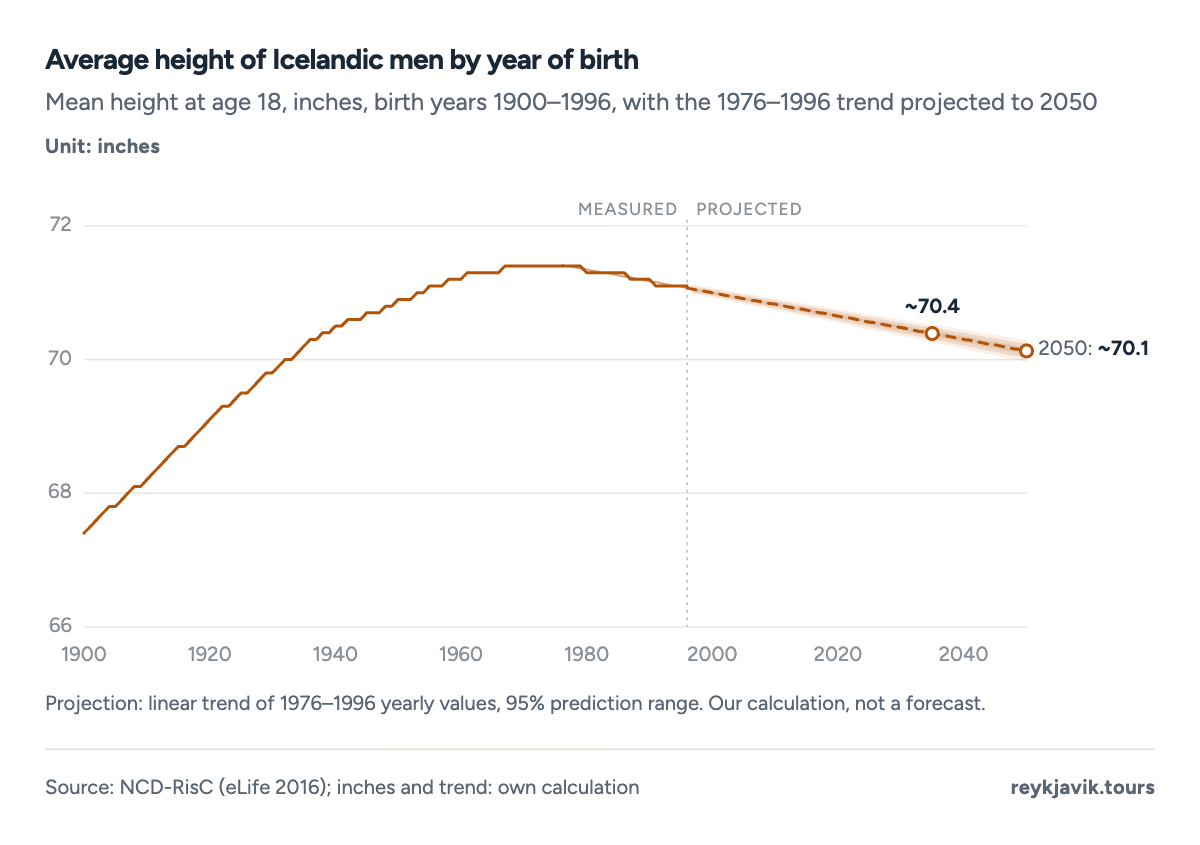
- Men born in 1996 average 71.1 in.
- Men born in 1900 averaged 67.4 in.
- The peak was 71.4 in for the 1974 cohort.
| 1996 | 5 ft 11.1 in | 180.5 | 5 ft 5.3 in | 165.9 |
| 1986 | 5 ft 11.3 in | 181.0 | 5 ft 5.7 in | 166.8 |
| 1976 | 5 ft 11.4 in | 181.3 | 5 ft 6 in | 167.6 |
| 1966 | 5 ft 11.3 in | 181.2 | 5 ft 6.1 in | 167.8 |
| 1956 | 5 ft 11.1 in | 180.6 | 5 ft 5.9 in | 167.3 |
| 1946 | 5 ft 10.7 in | 179.6 | 5 ft 5.7 in | 166.8 |
| 1936 | 5 ft 10.3 in | 178.5 | 5 ft 5.3 in | 165.8 |
| 1926 | 5 ft 9.5 in | 176.6 | 5 ft 4.6 in | 164.2 |
| 1916 | 5 ft 8.7 in | 174.6 | 5 ft 3.9 in | 162.2 |
| 1906 | 5 ft 7.9 in | 172.5 | 5 ft 3.1 in | 160.4 |
| 1896 | 5 ft 7.1 in | 170.5 | 5 ft 2.4 in | 158.6 |
Average female height in Iceland
Icelandic women born in 1996 average 166.0 cm1, or 5 ft 5.3 in. Their century of growth was smaller than the men's: women born in 1896 averaged 158.6 cm1 (5 ft 2.4 in), so the gain was 7.4 cm3, about 2.9 inches, against 10.0 cm3 for men.
Women also stopped growing earlier. Their peak came with the 19671 birth cohort, at 167.9 cm1, and women born in 1996 are 1.9 cm3 shorter than that. A straight line through the 1976–1996 birth years points to about 63.6 inches3 for women born in 2050, again with a wide range.
Projection: linear trend of 1976–1996 yearly values, 95% prediction range. Our calculation, not a forecast.
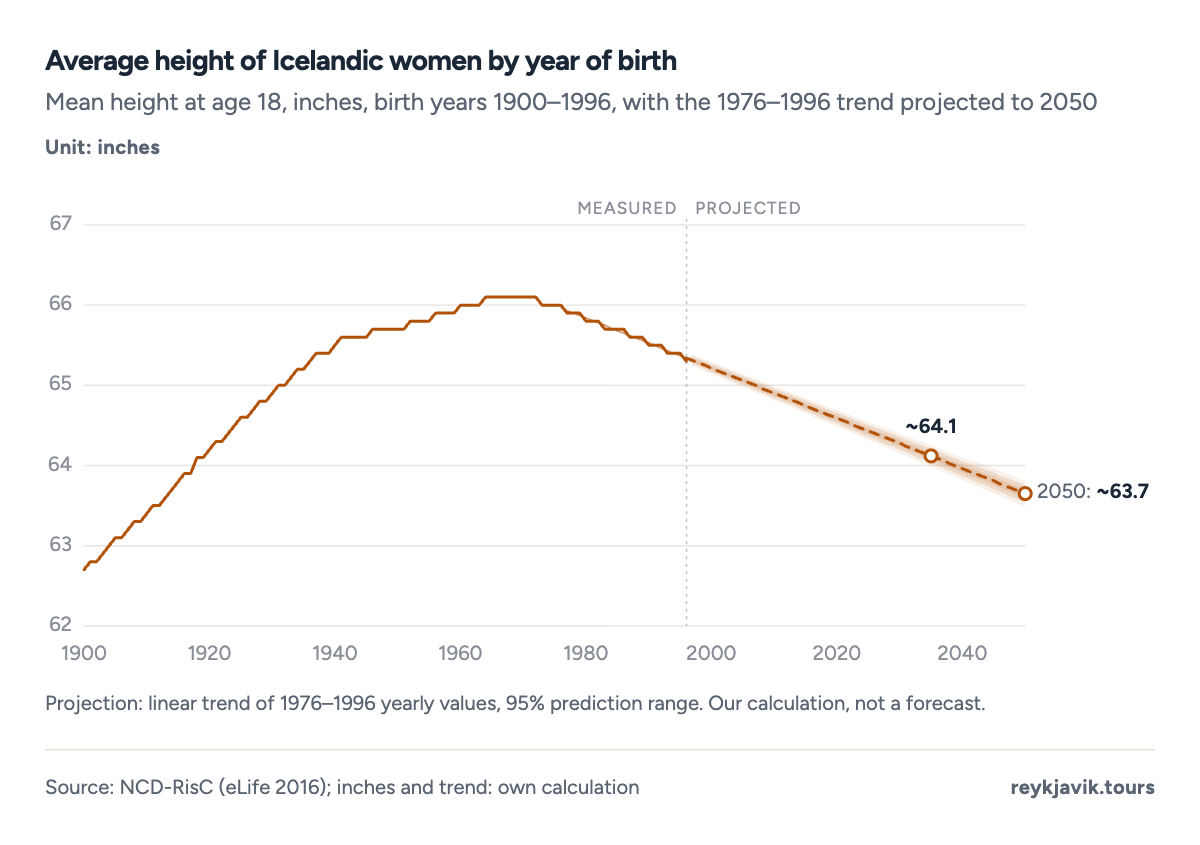
- Women born in 1996 average 65.3 in.
- The peak was 66.1 in for the 1967 cohort.
How tall Icelanders are compared with other countries
Among the 200 countries in the NCD-RisC study, Icelandic men born in 1996 rank 9th3. All eight countries with taller men are in Europe: the Netherlands leads at 182.5 cm1 (5 ft 11.9 in), followed by Belgium, Estonia, Latvia and Denmark. Icelandic women rank 12th3, behind Latvia at 169.8 cm1 (5 ft 6.9 in), the Netherlands and Estonia. The shortest averages in the study are 159.8 cm1 for men in Timor-Leste and 149.4 cm1 for women in Guatemala. The simple average of all 200 countries is 171.3 cm3 for men and 159.5 cm3 for women, so Icelandic men are about 9.2 cm3 above it and Icelandic women about 6.5 cm3.
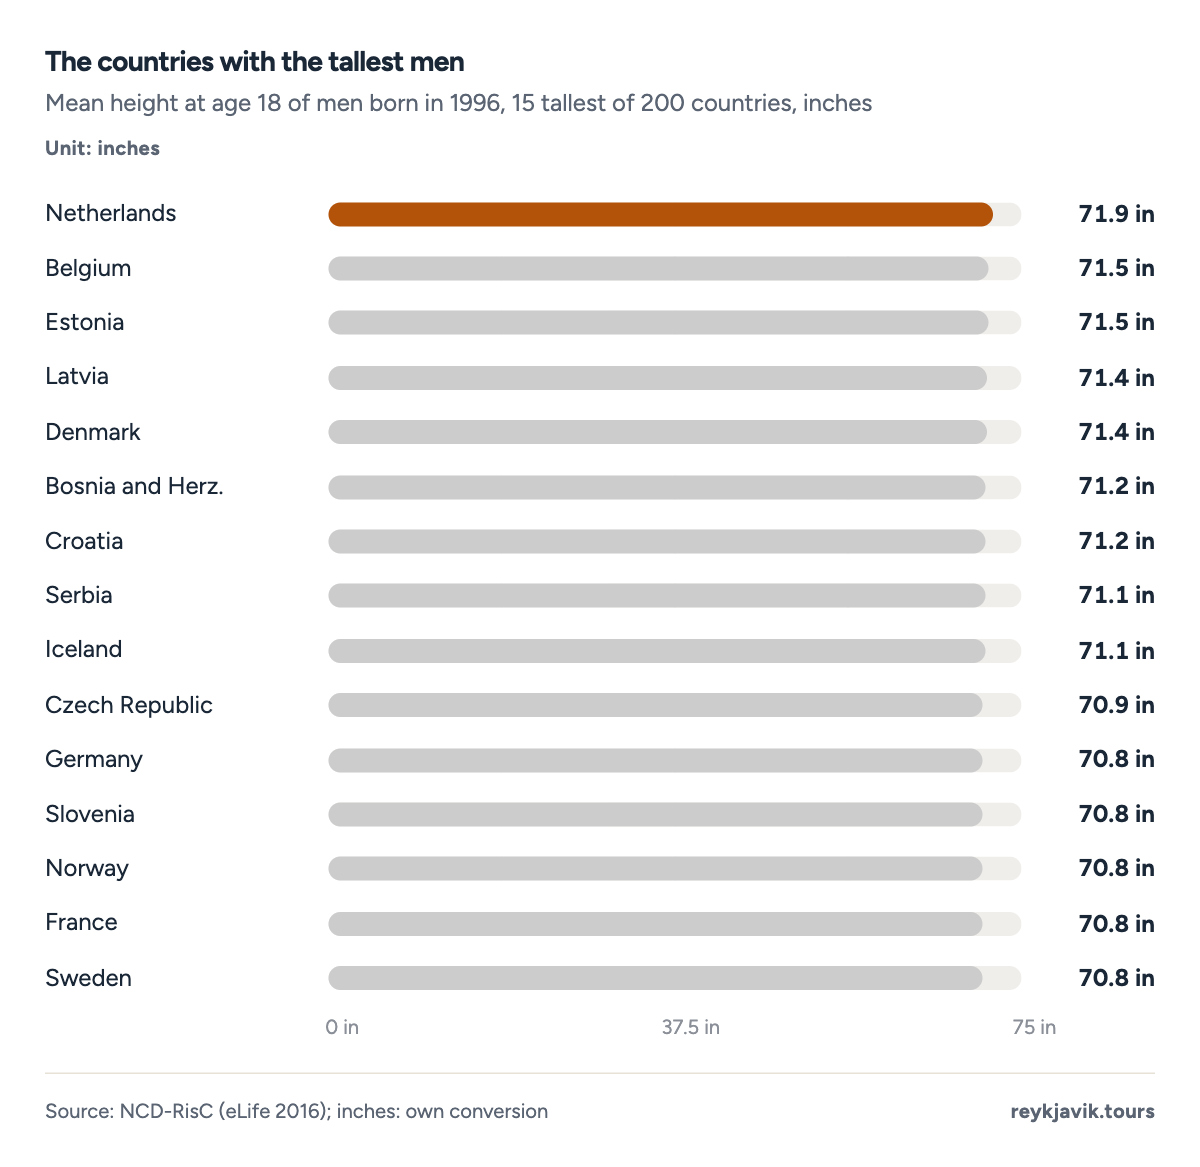
- Dutch men average 71.9 in.
- Icelandic men average 71.1 in, 9th of 200.
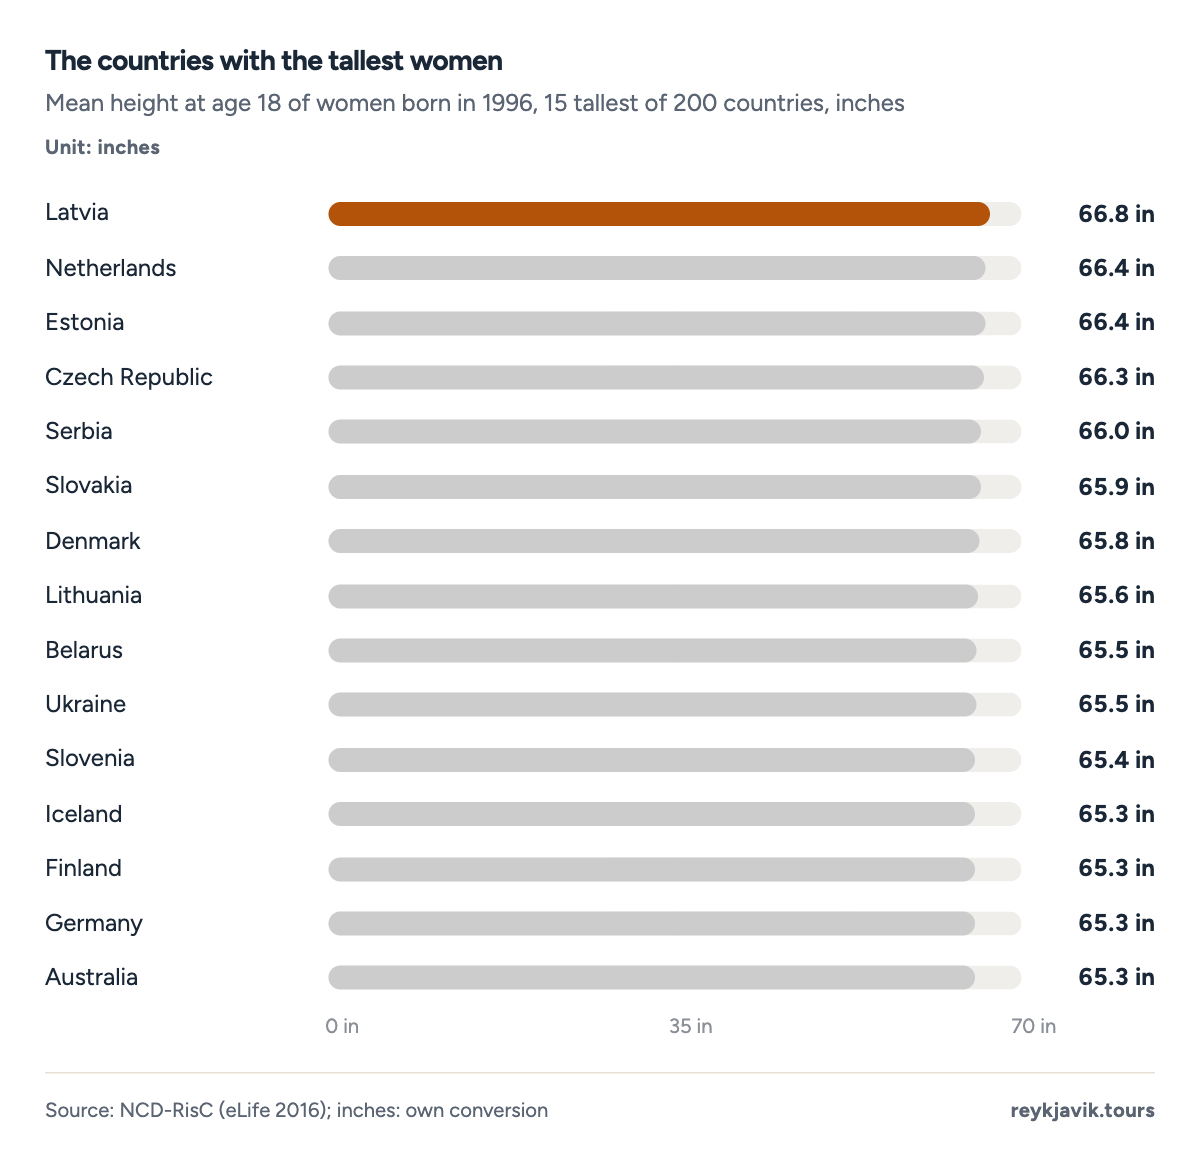
- Latvian women average 66.8 in.
- Icelandic women average 65.3 in, 12th of 200.
| 1 | Netherlands | 5 ft 11.9 in | 71.9 | 182.5 |
| 2 | Belgium | 5 ft 11.5 in | 71.5 | 181.7 |
| 3 | Estonia | 5 ft 11.5 in | 71.5 | 181.6 |
| 4 | Latvia | 5 ft 11.4 in | 71.4 | 181.4 |
| 5 | Denmark | 5 ft 11.4 in | 71.4 | 181.4 |
| 6 | Bosnia and Herz. | 5 ft 11.2 in | 71.2 | 180.9 |
| 7 | Croatia | 5 ft 11.2 in | 71.2 | 180.8 |
| 8 | Serbia | 5 ft 11.1 in | 71.1 | 180.6 |
| 9 | Iceland | 5 ft 11.1 in | 71.1 | 180.5 |
| 10 | Czech Republic | 5 ft 10.9 in | 70.9 | 180.1 |
| 11 | Germany | 5 ft 10.8 in | 70.8 | 179.9 |
| 12 | Slovenia | 5 ft 10.8 in | 70.8 | 179.8 |
| 13 | Norway | 5 ft 10.8 in | 70.8 | 179.7 |
| 14 | France | 5 ft 10.8 in | 70.8 | 179.7 |
| 15 | Sweden | 5 ft 10.8 in | 70.8 | 179.7 |
| 16 | Finland | 5 ft 10.7 in | 70.7 | 179.6 |
| 17 | Slovakia | 5 ft 10.7 in | 70.7 | 179.5 |
| 18 | Australia | 5 ft 10.6 in | 70.6 | 179.2 |
| 19 | Lithuania | 5 ft 10.5 in | 70.5 | 179.0 |
| 20 | Ireland | 5 ft 10.4 in | 70.4 | 178.9 |
| 21 | Ukraine | 5 ft 10.3 in | 70.3 | 178.5 |
| 22 | Belarus | 5 ft 10.3 in | 70.3 | 178.4 |
| 23 | Switzerland | 5 ft 10.2 in | 70.2 | 178.4 |
| 24 | North Macedonia | 5 ft 10.2 in | 70.2 | 178.3 |
| 25 | Montenegro | 5 ft 10.2 in | 70.2 | 178.3 |
| 1 | Latvia | 5 ft 6.8 in | 66.8 | 169.8 |
| 2 | Netherlands | 5 ft 6.4 in | 66.4 | 168.7 |
| 3 | Estonia | 5 ft 6.4 in | 66.4 | 168.7 |
| 4 | Czech Republic | 5 ft 6.3 in | 66.3 | 168.5 |
| 5 | Serbia | 5 ft 6 in | 66.0 | 167.7 |
| 6 | Slovakia | 5 ft 5.9 in | 65.9 | 167.5 |
| 7 | Denmark | 5 ft 5.8 in | 65.8 | 167.2 |
| 8 | Lithuania | 5 ft 5.6 in | 65.6 | 166.6 |
| 9 | Belarus | 5 ft 5.5 in | 65.5 | 166.3 |
| 10 | Ukraine | 5 ft 5.5 in | 65.5 | 166.3 |
| 11 | Slovenia | 5 ft 5.4 in | 65.4 | 166.1 |
| 12 | Iceland | 5 ft 5.3 in | 65.3 | 165.9 |
| 13 | Finland | 5 ft 5.3 in | 65.3 | 165.9 |
| 14 | Germany | 5 ft 5.3 in | 65.3 | 165.9 |
| 15 | Australia | 5 ft 5.3 in | 65.3 | 165.9 |
| 16 | Bosnia and Herz. | 5 ft 5.3 in | 65.3 | 165.8 |
| 17 | Sweden | 5 ft 5.2 in | 65.2 | 165.7 |
| 18 | Croatia | 5 ft 5.2 in | 65.2 | 165.6 |
| 19 | Norway | 5 ft 5.2 in | 65.2 | 165.6 |
| 20 | Tonga | 5 ft 5.2 in | 65.2 | 165.5 |
| 21 | Belgium | 5 ft 5.2 in | 65.2 | 165.5 |
| 22 | Barbados | 5 ft 5.1 in | 65.1 | 165.3 |
| 23 | Russian Federation | 5 ft 5.1 in | 65.1 | 165.3 |
| 24 | Ireland | 5 ft 5 in | 65.0 | 165.1 |
| 25 | New Zealand | 5 ft 4.9 in | 64.9 | 164.9 |
Iceland vs the Nordic countries and the US
Within the Nordic countries, only Danish men are taller than Icelandic men, at 181.4 cm1. Norwegian and Swedish men average 179.7 cm1 each and Finnish men 179.6 cm1. American men born in 1996 average 177.1 cm1 (5 ft 9.7 in), about 1.3 inches3 shorter than Icelanders, and British men 177.5 cm1. For women, Denmark again leads the Nordics at 167.2 cm1, while Icelandic and Finnish women are level at about 165.9 cm1, and American women average 163.5 cm1.
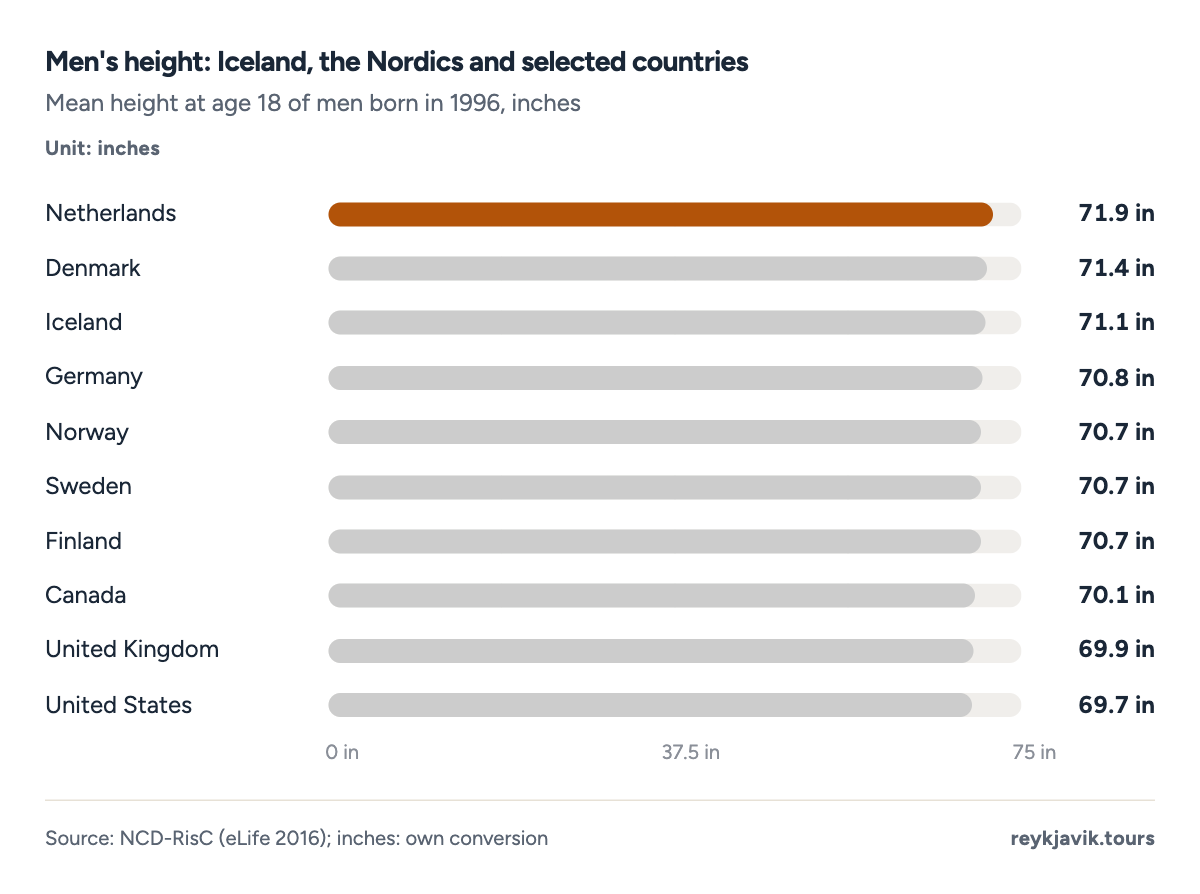
- Danish men average 71.4 in.
- American men average 69.7 in.
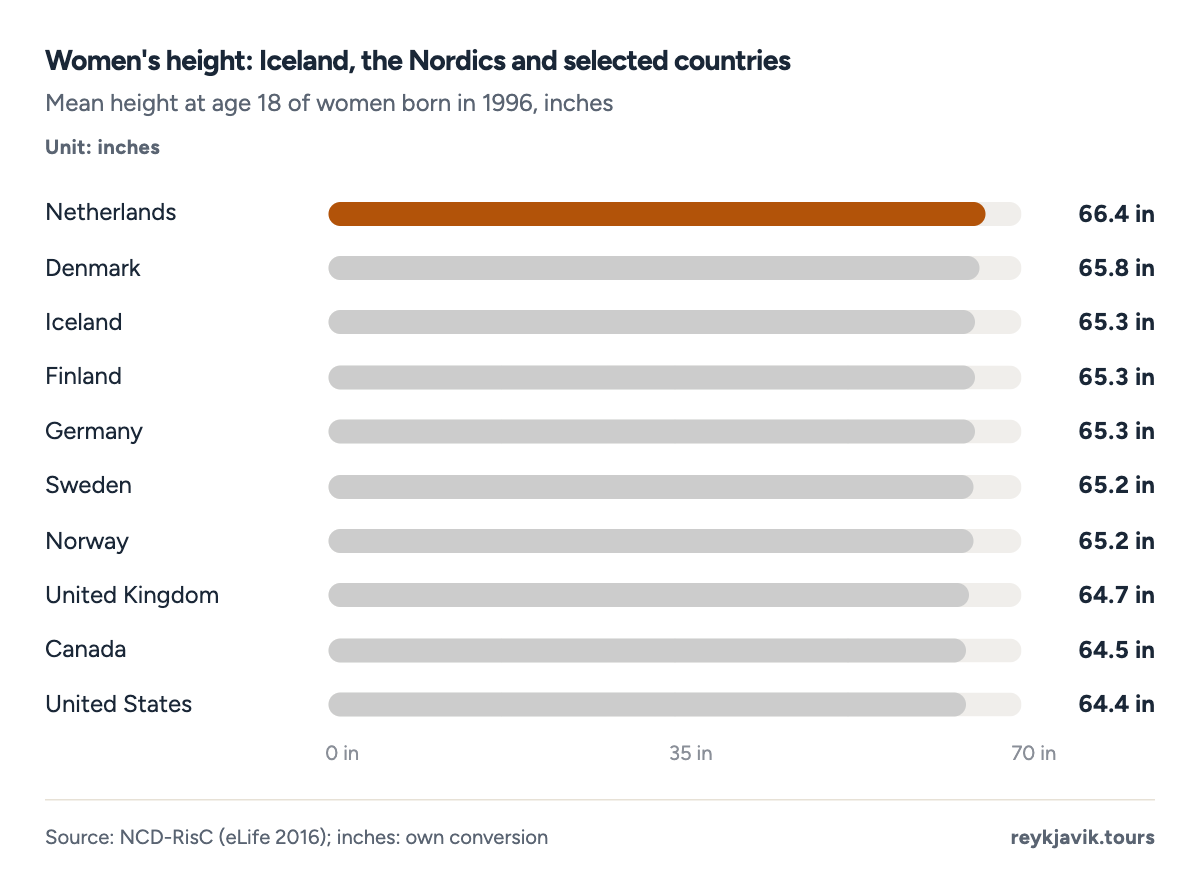
- Dutch women average 66.4 in.
- American women average 64.4 in.
| Netherlands | 5 ft 11.9 in | 182.5 | 5 ft 6.4 in | 168.7 |
| Denmark | 5 ft 11.4 in | 181.4 | 5 ft 5.8 in | 167.2 |
| Iceland | 5 ft 11.1 in | 180.5 | 5 ft 5.3 in | 165.9 |
| Germany | 5 ft 10.8 in | 179.9 | 5 ft 5.3 in | 165.9 |
| Norway | 5 ft 10.8 in | 179.7 | 5 ft 5.2 in | 165.6 |
| Sweden | 5 ft 10.8 in | 179.7 | 5 ft 5.2 in | 165.7 |
| Finland | 5 ft 10.7 in | 179.6 | 5 ft 5.3 in | 165.9 |
| Canada | 5 ft 10.1 in | 178.1 | 5 ft 4.5 in | 163.9 |
| United Kingdom | 5 ft 9.9 in | 177.5 | 5 ft 4.7 in | 164.4 |
| United States | 5 ft 9.7 in | 177.1 | 5 ft 4.4 in | 163.5 |
A head start rather than a growth spurt
Iceland's gain over the century was modest by European standards because Icelanders started tall. Icelandic women born in 1896 were already taller than women in Denmark, Finland, Germany, the Netherlands, the UK and Canada, and level with American women, at 158.6 cm1, while Finnish women of that year averaged 153.9 cm1. Finnish women then gained 12.0 cm3 and caught up. Dutch men gained 13.1 cm3 and Dutch women 13.9 cm3. By the gain from 1896 to 1996, Icelandic men rank 96th3 of 200 countries and Icelandic women 117th3.
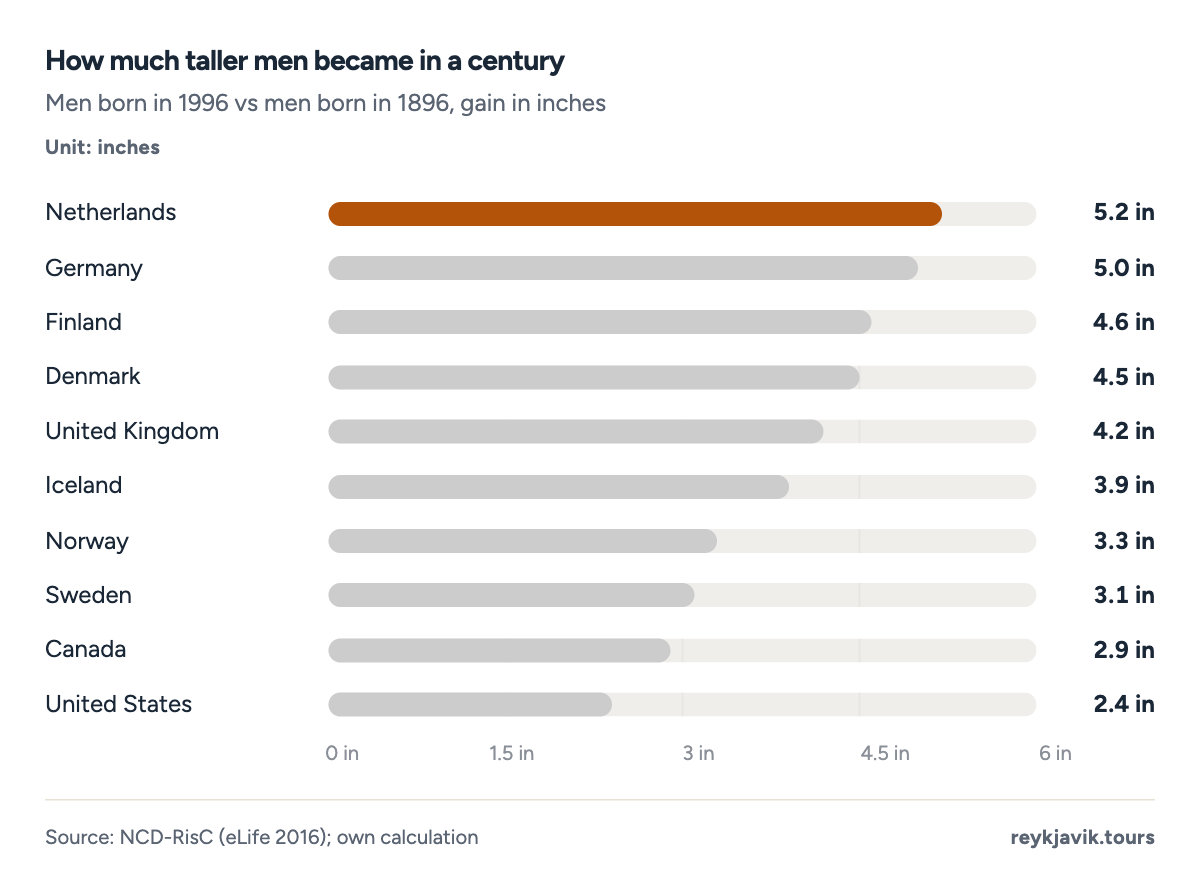
- Dutch men gained 5.2 in.
- Icelandic men gained 3.9 in.
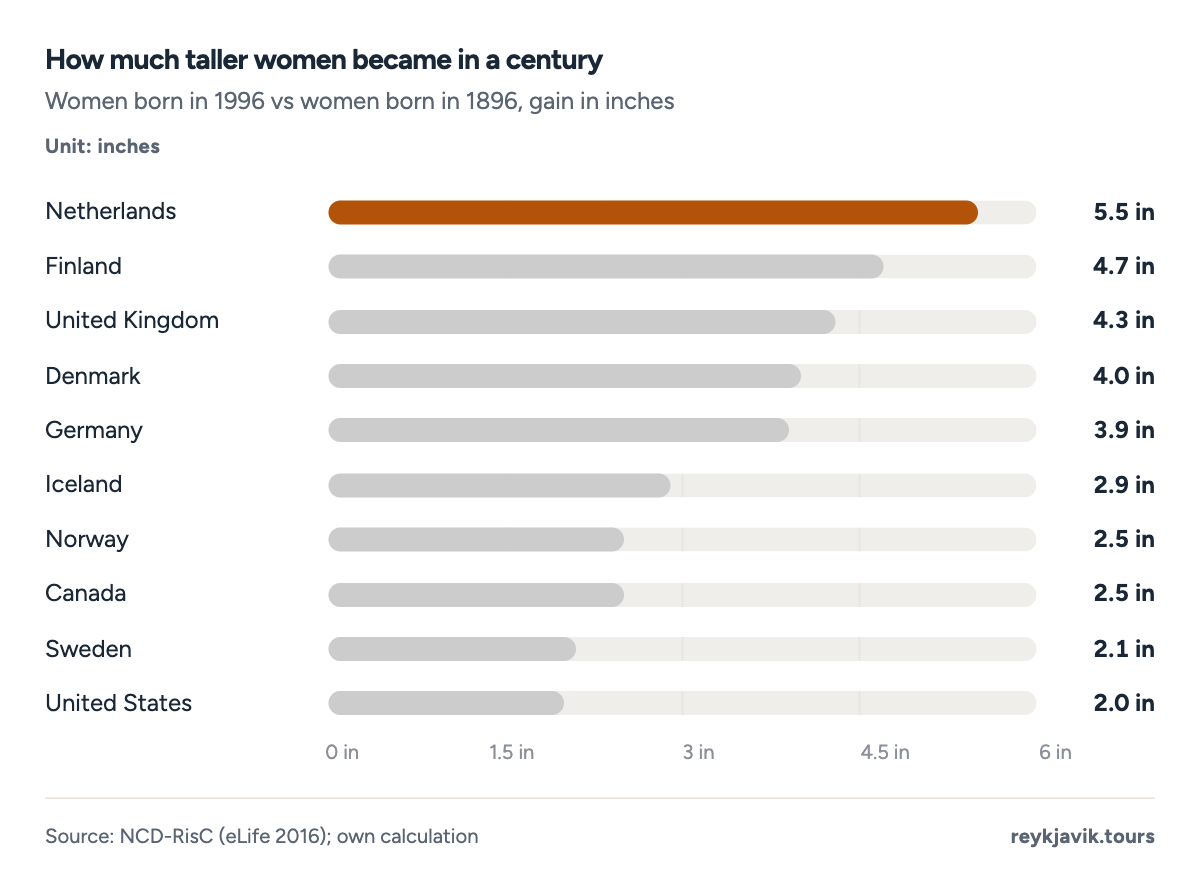
- Dutch women gained 5.5 in.
- Icelandic women gained 2.9 in.
How tall Icelandic children and teenagers are
A second NCD-RisC study follows school-aged children from 1985 to 2019. In 2019, Icelandic 5-year-olds averaged 118.5 cm4 for boys and 116.5 cm4 for girls, about 3 ft 10 in. Girls overtake boys briefly around puberty: at 11 and 12 they are slightly taller, with 12-year-old girls at 157.2 cm4 against 156.8 cm4 for boys. By 15 boys are well ahead, 174.8 cm4 against 165.6 cm4. Girls add only about 3.3 cm3 between 15 and 19, boys about 7.3 cm3.
- Boys
- Girls
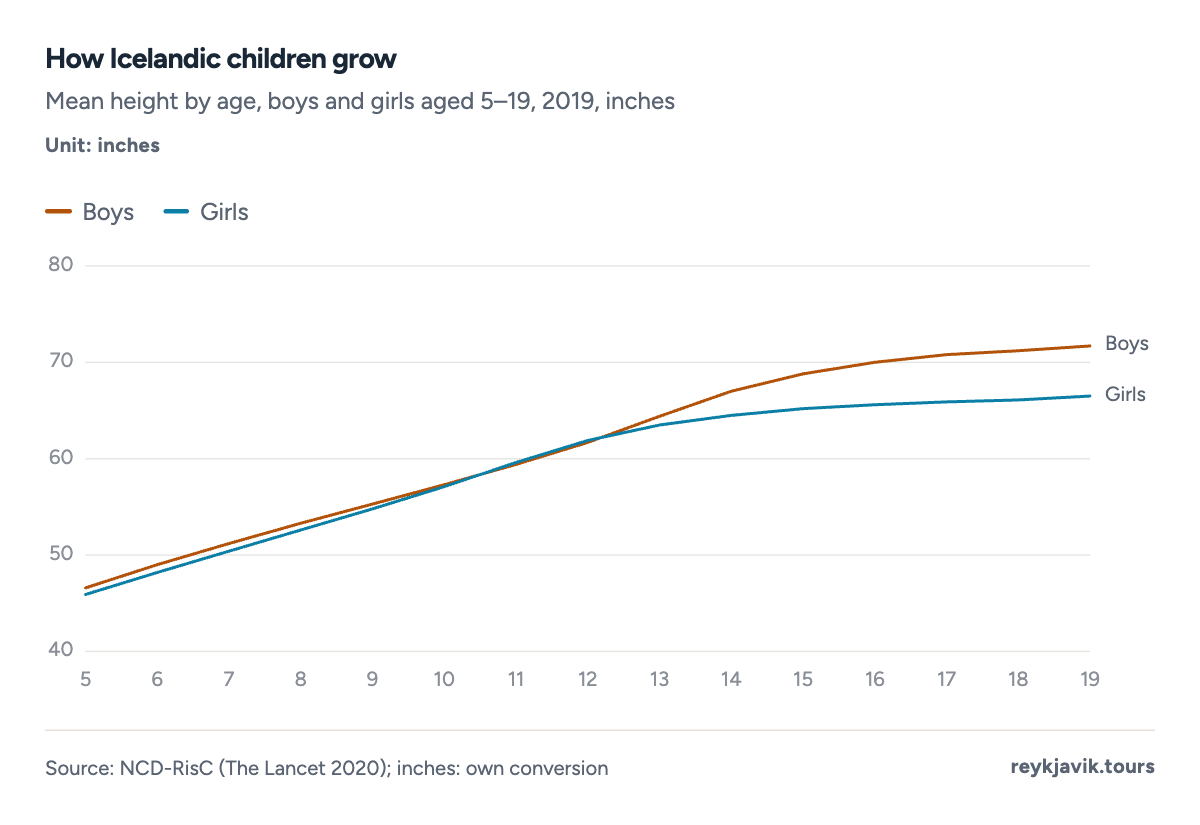
- At 19, boys average 71.7 in.
- At 19, girls average 66.5 in.
- At 12, girls are taller: 61.9 in.
| 5 | 3 ft 10.6 in | 118.5 | 3 ft 9.9 in | 116.5 |
| 6 | 4 ft 1 in | 124.5 | 4 ft 0.2 in | 122.5 |
| 7 | 4 ft 3.2 in | 130.1 | 4 ft 2.4 in | 128.1 |
| 8 | 4 ft 5.3 in | 135.4 | 4 ft 4.6 in | 133.5 |
| 9 | 4 ft 7.3 in | 140.5 | 4 ft 6.8 in | 139.1 |
| 10 | 4 ft 9.3 in | 145.6 | 4 ft 9.1 in | 145.1 |
| 11 | 4 ft 11.4 in | 150.8 | 4 ft 11.6 in | 151.4 |
| 12 | 5 ft 1.7 in | 156.8 | 5 ft 1.9 in | 157.2 |
| 13 | 5 ft 4.4 in | 163.7 | 5 ft 3.5 in | 161.3 |
| 14 | 5 ft 7 in | 170.1 | 5 ft 4.5 in | 163.9 |
| 15 | 5 ft 8.8 in | 174.8 | 5 ft 5.2 in | 165.6 |
| 16 | 5 ft 10 in | 177.8 | 5 ft 5.6 in | 166.6 |
| 17 | 5 ft 10.8 in | 179.7 | 5 ft 5.9 in | 167.3 |
| 18 | 5 ft 11.2 in | 181.0 | 5 ft 6.1 in | 168.0 |
| 19 | 5 ft 11.7 in | 182.1 | 5 ft 6.5 in | 168.9 |
The same study suggests the youngest adults are about as tall as the peak generations. Icelandic 19-year-olds measured in 2019, born around 2000, averaged 182.1 cm4 (5 ft 11.7 in) for men and 168.9 cm4 (5 ft 6.5 in) for women. In 1985 the figures were 180.5 cm4 and 168.1 cm4. The two studies use different models, so these numbers should not be compared directly with the birth-year series above.
- Men
- Women
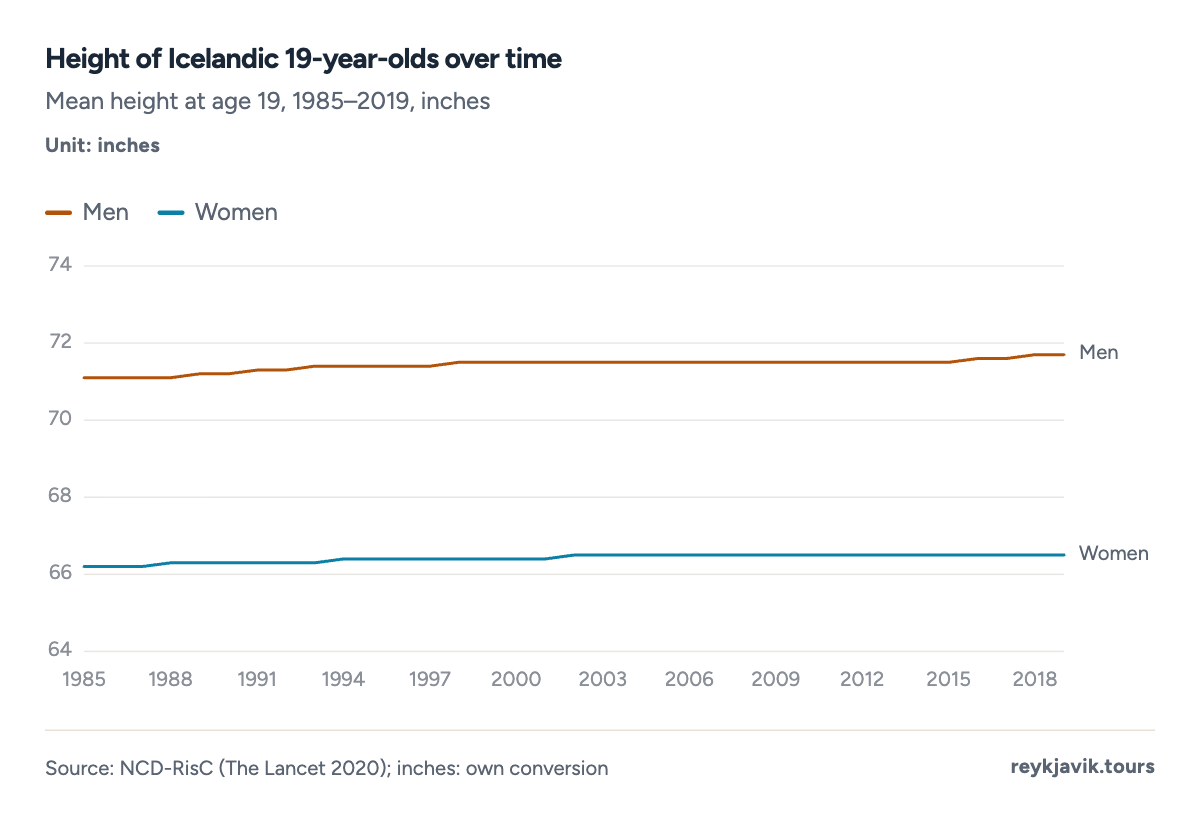
- 19-year-old men averaged 71.7 in in 2019.
- 19-year-old women averaged 66.5 in.
Average weight in Iceland
No Icelandic agency publishes a national average body weight, but WHO's Global Health Observatory reports mean body mass index (BMI), weight in kilograms divided by height in metres squared, from NCD-RisC estimates. In 2016, the latest year in that series, adult Icelandic men averaged a BMI of 27.05 and women 25.55, up from 24.25 and 23.55 in 1975. A BMI of 25 or more counts as overweight.
Applied to the average heights above, those BMI values correspond to about 194 pounds3 (88.0 kg) for a man of 5 ft 11.1 in and 155 pounds3 (70.2 kg) for a woman of 5 ft 5.3 in. This is an illustration, not a measured average: the BMI covers all adults, while the heights belong to young adults.
Icelandic men's mean BMI is higher than in Denmark, 26.25, Sweden and Finland, and lower than in Norway, 27.35, and the United States, 28.85.
- Men
- Women
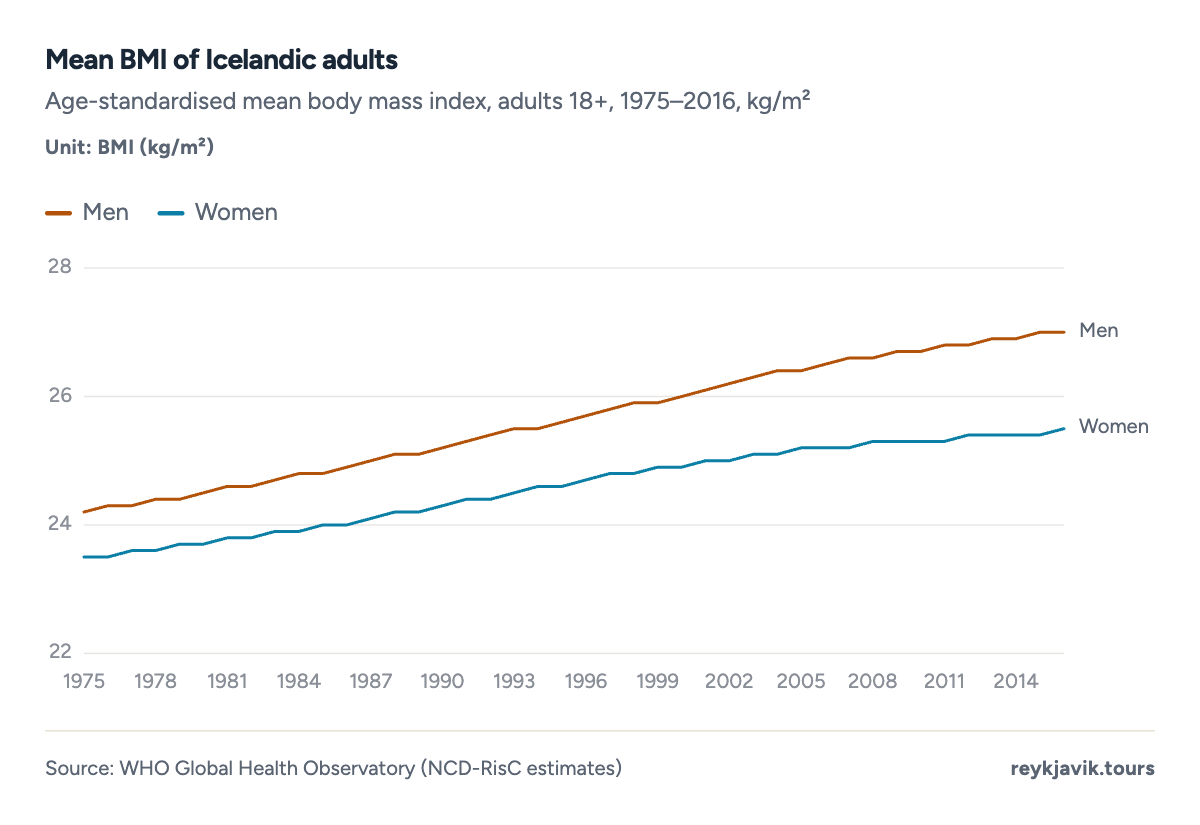
- Men's mean BMI reached 27.0 in 2016.
- Women's mean BMI reached 25.5.
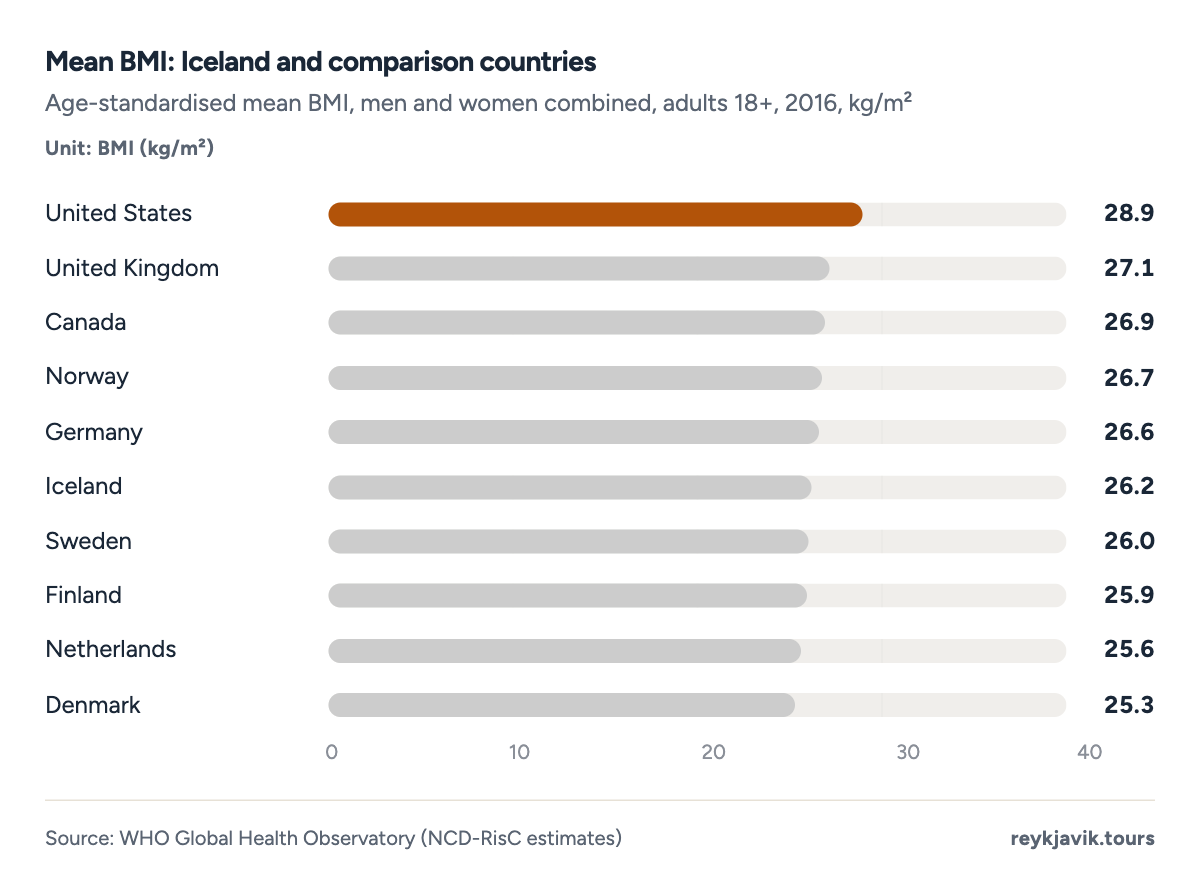
- Iceland's adult mean BMI is 26.2.
- The US mean is 28.9.
| Men | 27.0 | 5 ft 11.1 in | 194 | 88.0 |
| Women | 25.5 | 5 ft 5.3 in | 155 | 70.2 |
| 1 | United States | 28.8 | 28.9 | 28.9 |
| 2 | United Kingdom | 27.3 | 27.0 | 27.1 |
| 3 | Canada | 27.3 | 26.6 | 26.9 |
| 4 | Norway | 27.3 | 26.1 | 26.7 |
| 5 | Germany | 27.3 | 25.8 | 26.6 |
| 6 | Iceland | 27.0 | 25.5 | 26.2 |
| 7 | Sweden | 26.7 | 25.4 | 26.0 |
| 8 | Finland | 26.4 | 25.5 | 25.9 |
| 9 | Netherlands | 26.0 | 25.1 | 25.6 |
| 10 | Denmark | 26.2 | 24.4 | 25.3 |
Obesity in Iceland
Obesity, a BMI of 30 or more, has more than tripled among Icelandic men since 1980 and nearly tripled among women. NCD-RisC's newest estimates, age-standardised so that years and countries can be compared, put obesity among Icelandic men at 24.0%2 in 2024 and among women at 21.5%2. In 1980 the shares were 6.4%2 and 7.9%2. Men overtook women around the turn of the century: in 2000 both stood at about 14.8%2. The rise has slowed: men's obesity grew by 2.9 percentage points3 between 2000 and 2005, but by 1.4 points3 between 2015 and 2020. If the straight-line trend of 2000–2024 continued, obesity would reach about 33.3%3 of men and 28.3%3 of women by 2050.
Projection: linear trend of 2000–2024 yearly values, 95% prediction range. Our calculation, not a forecast.
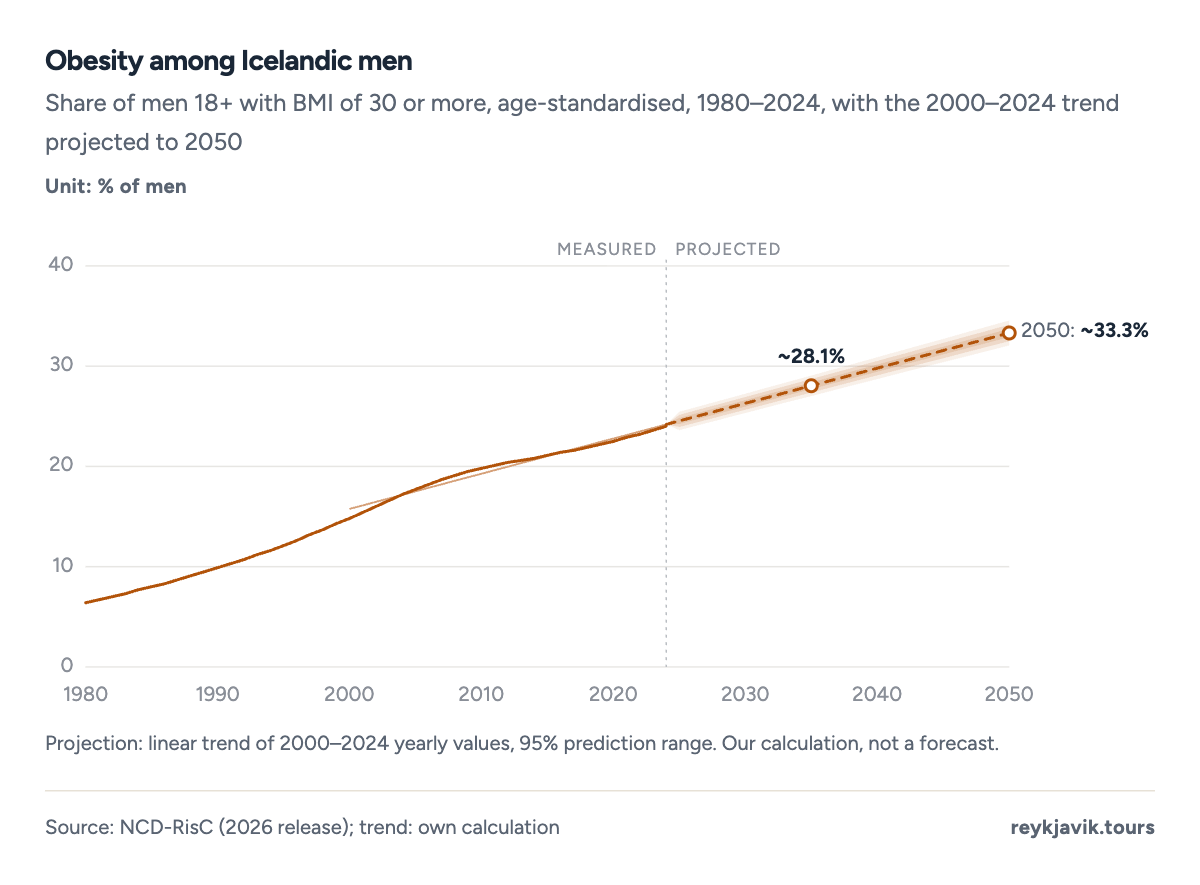
- 24.0% of men had obesity in 2024.
- In 1980 the share was 6.4%.
Projection: linear trend of 2000–2024 yearly values, 95% prediction range. Our calculation, not a forecast.
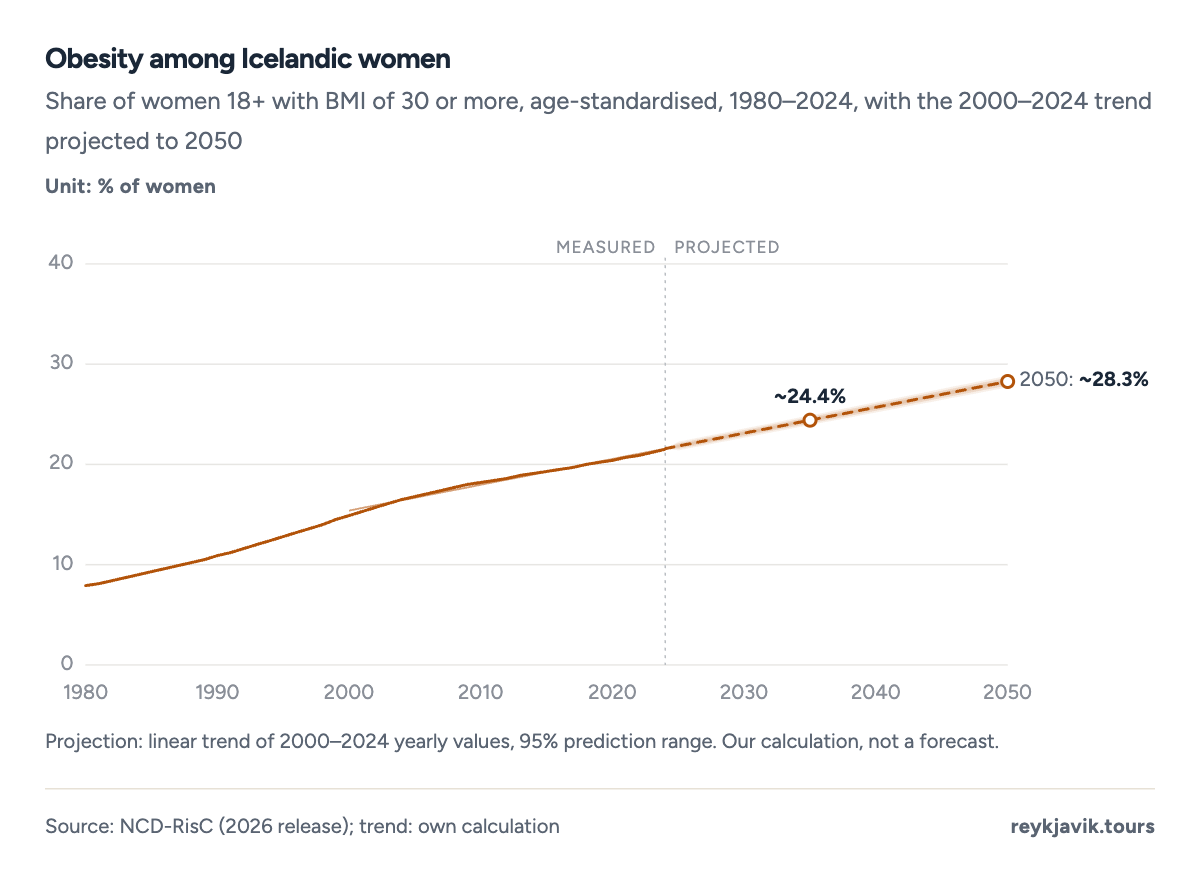
- 21.5% of women had obesity in 2024.
- In 1980 the share was 7.9%.
| 2024 | 24.0 | 16.6–32.1 | 21.5 | 14.6–29.1 |
| 2023 | 23.6 | 16.8–31.0 | 21.2 | 14.8–28.2 |
| 2022 | 23.2 | 17.0–30.0 | 20.9 | 15.0–27.5 |
| 2021 | 22.9 | 17.1–29.2 | 20.7 | 15.1–26.8 |
| 2020 | 22.5 | 17.2–28.3 | 20.4 | 15.2–26.2 |
| 2019 | 22.2 | 17.3–27.6 | 20.2 | 15.3–25.5 |
| 2018 | 21.9 | 17.4–26.9 | 20.0 | 15.5–24.9 |
| 2017 | 21.6 | 17.4–26.2 | 19.7 | 15.6–24.3 |
| 2016 | 21.4 | 17.4–25.5 | 19.5 | 15.6–23.8 |
| 2015 | 21.1 | 17.4–24.9 | 19.3 | 15.6–23.2 |
| 2014 | 20.8 | 17.4–24.4 | 19.1 | 15.6–22.8 |
| 2013 | 20.6 | 17.3–23.9 | 18.9 | 15.7–22.4 |
| 2012 | 20.4 | 17.3–23.5 | 18.6 | 15.6–22.0 |
| 2011 | 20.1 | 17.3–23.1 | 18.4 | 15.5–21.5 |
| 2010 | 19.8 | 17.1–22.7 | 18.2 | 15.4–21.1 |
| 2009 | 19.5 | 16.9–22.3 | 18.0 | 15.3–20.8 |
| 2008 | 19.1 | 16.6–21.8 | 17.7 | 15.1–20.5 |
| 2007 | 18.7 | 16.2–21.4 | 17.4 | 14.9–20.1 |
| 2006 | 18.2 | 15.8–20.9 | 17.1 | 14.7–19.8 |
| 2005 | 17.7 | 15.3–20.3 | 16.8 | 14.4–19.4 |
| 2004 | 17.2 | 14.8–19.7 | 16.5 | 14.1–19.0 |
| 2003 | 16.6 | 14.2–19.1 | 16.1 | 13.8–18.6 |
| 2002 | 16.0 | 13.7–18.5 | 15.7 | 13.5–18.1 |
| 2001 | 15.4 | 13.2–17.9 | 15.3 | 13.1–17.7 |
| 2000 | 14.8 | 12.6–17.3 | 14.9 | 12.7–17.2 |
| 1999 | 14.3 | 12.0–16.7 | 14.5 | 12.4–16.8 |
| 1998 | 13.7 | 11.6–16.1 | 14.0 | 12.0–16.3 |
| 1997 | 13.2 | 11.0–15.5 | 13.6 | 11.6–15.8 |
| 1996 | 12.6 | 10.6–14.9 | 13.2 | 11.3–15.3 |
| 1995 | 12.1 | 10.2–14.3 | 12.8 | 10.9–14.9 |
| 1994 | 11.6 | 9.7–13.8 | 12.4 | 10.6–14.4 |
| 1993 | 11.2 | 9.3–13.3 | 12.0 | 10.2–14.0 |
| 1992 | 10.7 | 9.0–12.7 | 11.6 | 9.8–13.6 |
| 1991 | 10.3 | 8.6–12.2 | 11.2 | 9.5–13.2 |
| 1990 | 9.9 | 8.2–11.7 | 10.9 | 9.2–12.8 |
| 1989 | 9.5 | 7.8–11.3 | 10.5 | 8.8–12.4 |
| 1988 | 9.1 | 7.5–10.8 | 10.2 | 8.5–12.1 |
| 1987 | 8.7 | 7.1–10.4 | 9.9 | 8.2–11.8 |
| 1986 | 8.3 | 6.8–10.1 | 9.6 | 7.9–11.4 |
| 1985 | 8.0 | 6.5–9.7 | 9.3 | 7.6–11.2 |
| 1984 | 7.7 | 6.1–9.4 | 9.0 | 7.2–11.0 |
| 1983 | 7.3 | 5.8–9.1 | 8.7 | 6.8–10.8 |
| 1982 | 7.0 | 5.4–8.9 | 8.4 | 6.5–10.6 |
| 1981 | 6.7 | 5.1–8.7 | 8.1 | 6.1–10.5 |
| 1980 | 6.4 | 4.8–8.5 | 7.9 | 5.8–10.4 |
BMI categories
Most Icelandic men are now above the healthy BMI range. In 2024, 43.7%2 of men had a BMI of 25 to under 30 and 24.0%2 were at 30 or above, which leaves 31.4%2 between 18.5 and 25 and 1.0%2 underweight. Among women, 46.2%2 were in the 18.5–25 range, 29.9%2 at 25–30 and 2.5%2 underweight. The highest band, a BMI of 40 or more, covered 2.6%2 of men and 2.4%2 of women, against 0.2%2 and 0.3%2 in 1980.
- BMI 25 to under 3043.743.7%
- BMI under 2532.332.3%
- BMI 30 or more24.024%
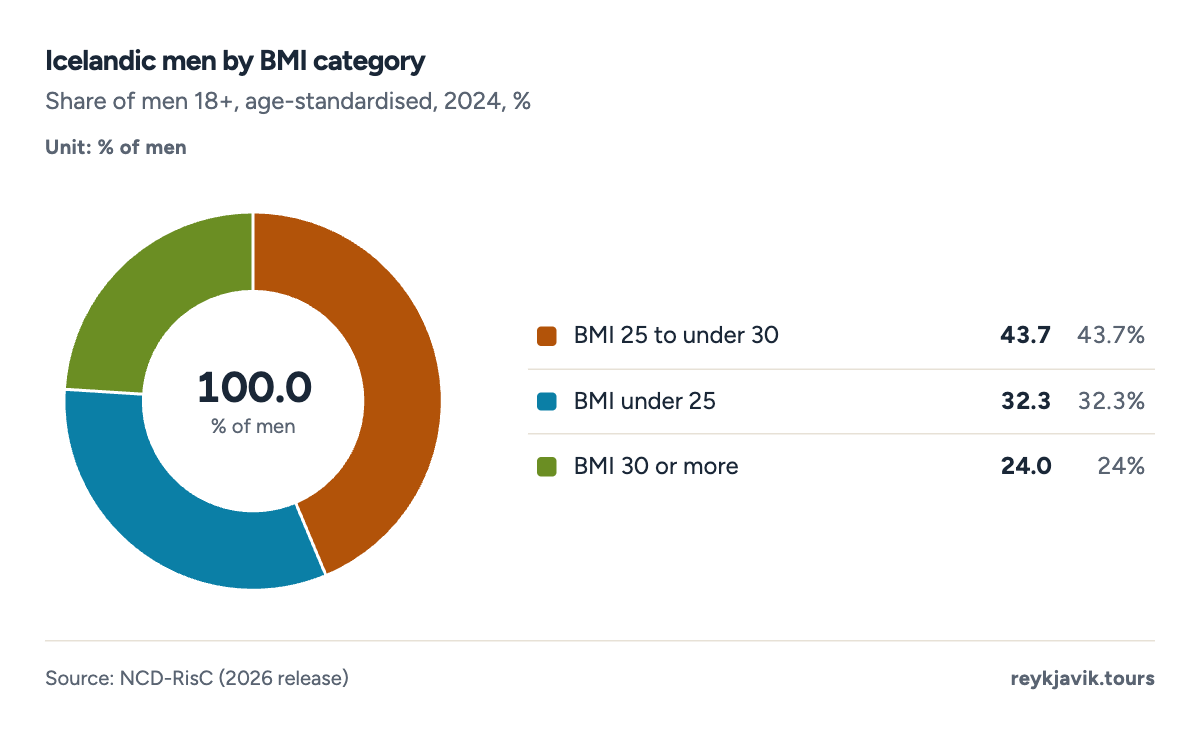
- 43.7% of men have a BMI of 25–30.
- 24.0% have a BMI of 30 or more.
- BMI under 2548.648.6%
- BMI 25 to under 3029.929.9%
- BMI 30 or more21.521.5%
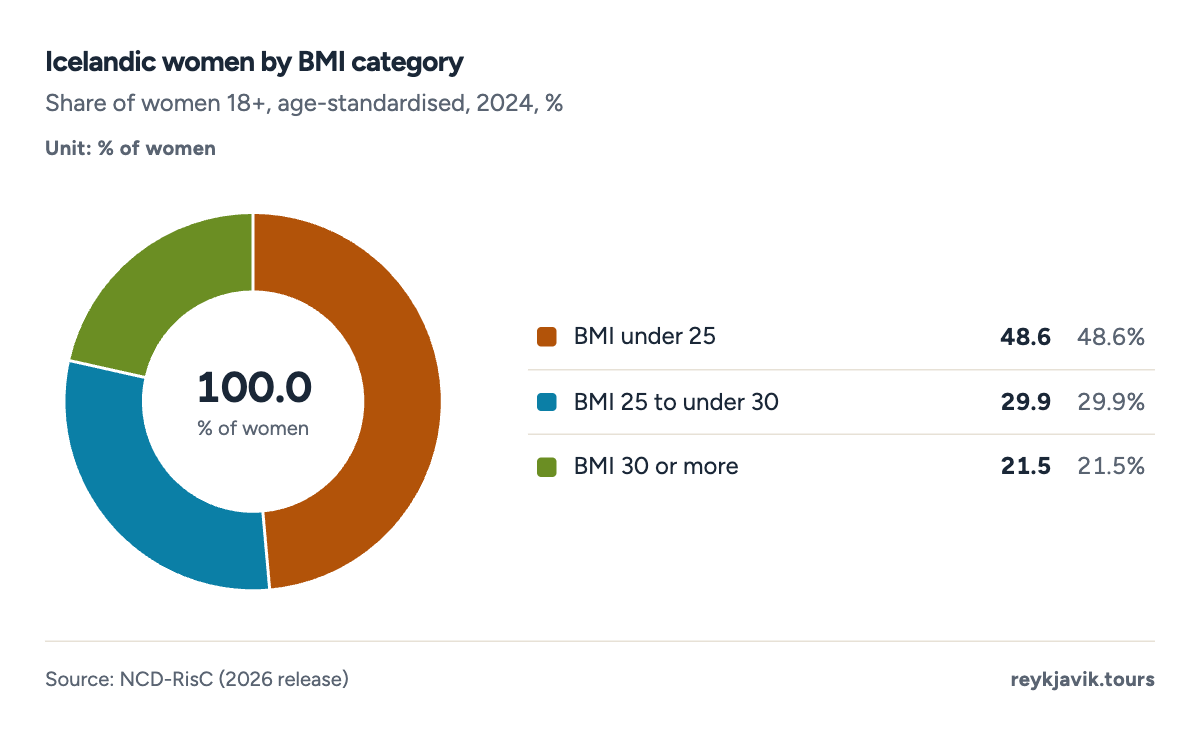
- 48.6% of women have a BMI under 25.
- 21.5% have a BMI of 30 or more.
| Under 18.5 | 1.7 | 1.0 | 4.2 | 2.5 |
| 18.5 to under 25 | 57.4 | 31.4 | 65.3 | 46.2 |
| 25 to under 30 | 34.5 | 43.7 | 22.6 | 29.9 |
| 30 to under 35 | 5.4 | 16.7 | 5.9 | 13.7 |
| 35 to under 40 | 0.8 | 4.7 | 1.7 | 5.4 |
| 40 or more | 0.2 | 2.6 | 0.3 | 2.4 |
Iceland vs other countries
Obesity in Iceland is middling for Europe and far below the United States. Among 45 European countries in the NCD-RisC estimates, Icelandic men rank 18th3 highest and Icelandic women 22nd3. Men's obesity is close to Finland's 24.2%2 and above Norway's 21.5%2, Sweden's 19.0%2 and Denmark's 15.8%2. In the United States the shares are 40.3%2 for men and 43.1%2 for women.
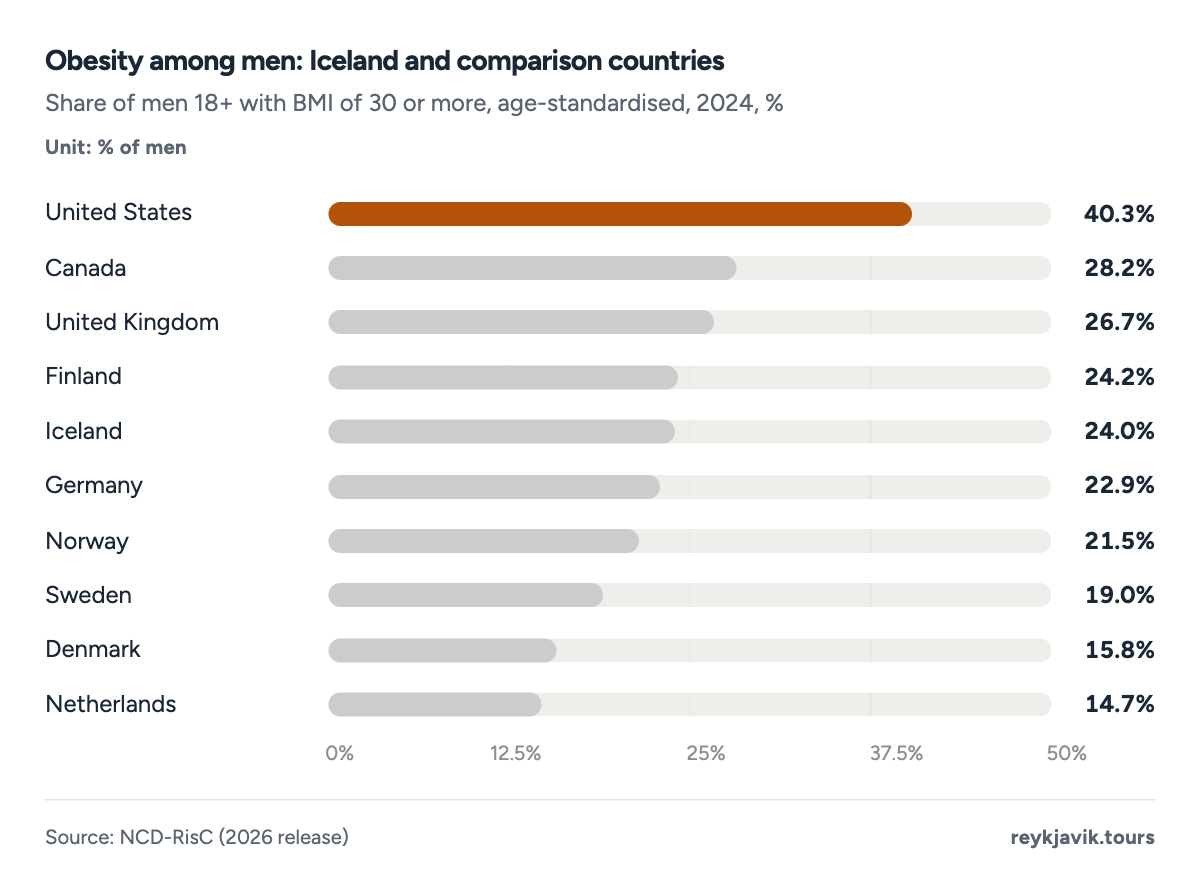
- Icelandic men: 24.0%.
- Danish men: 15.8%.
| 1 | United States | 40.3 | 43.1 |
| 2 | Canada | 28.2 | 24.9 |
| 3 | United Kingdom | 26.7 | 29.6 |
| 4 | Finland | 24.2 | 25.3 |
| 5 | Iceland | 24.0 | 21.5 |
| 6 | Germany | 22.9 | 19.6 |
| 7 | Norway | 21.5 | 19.6 |
| 8 | Sweden | 19.0 | 16.8 |
| 9 | Denmark | 15.8 | 13.4 |
| 10 | Netherlands | 14.7 | 15.5 |
What Iceland's own health survey shows
Iceland's Directorate of Health measures the same trend in its national survey Heilsa og líðan (Health and wellbeing). Using weighted survey answers, it reports that 19%6 of adult men had a BMI of 30 or more in 2007, rising to 27%6 in 2022, and that the share among women rose from 21%6 to 29%6. For all adults, that is about 28%6 in 2022. The survey figures are higher than the modelled estimates above; they come from weighted survey answers rather than age-standardised model estimates, so the two series should not be mixed. The same survey found that 57%6 of women and 45%6 of men were trying to lose weight or had tried in the past 12 months.
Measured against its neighbours on self-reported data, Iceland stands out. In a 2019 OECD report cited by the Directorate, 65%6 of Icelandic adults reported a height and weight in the overweight or obesity range, against 48%6 in Norway and 49%6 in Denmark and Sweden. Finland's figure of 67%6 came from measurements, which usually give higher shares, so it is not directly comparable.
| Men | 19 | 27 |
| Women | 21 | 29 |
| All adults | - | 28 |
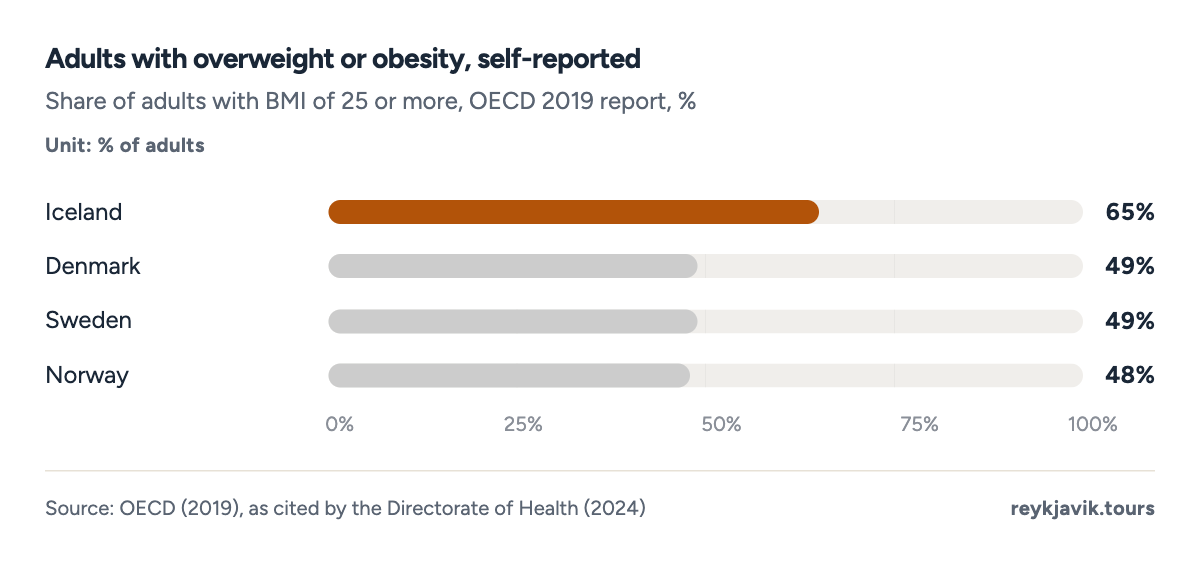
- 65% of Icelandic adults reported overweight or obesity.
- Norway reported 48%.
Children
Iceland's school health service checks the growth of pupils in grades 1, 4, 7 and 9 every year, about 17,2006 children a year over the past decade. Over that decade the share of children in the healthy weight range fell from 78%6 to 74%6, the share with overweight or obesity rose from 21%6 to 25%6, and obesity alone rose from 5%6 to 7%6. Obesity is more common outside the capital: by spring 2023 it had risen from 6.5%6 to just under 10%6 of children in the rest of the country, and from 4.0%6 to 6.0%6 in the capital region. Among first-graders, 5.8%6 had obesity in 2022, lower than in Finland and Sweden but higher than Denmark's 3.5%6.
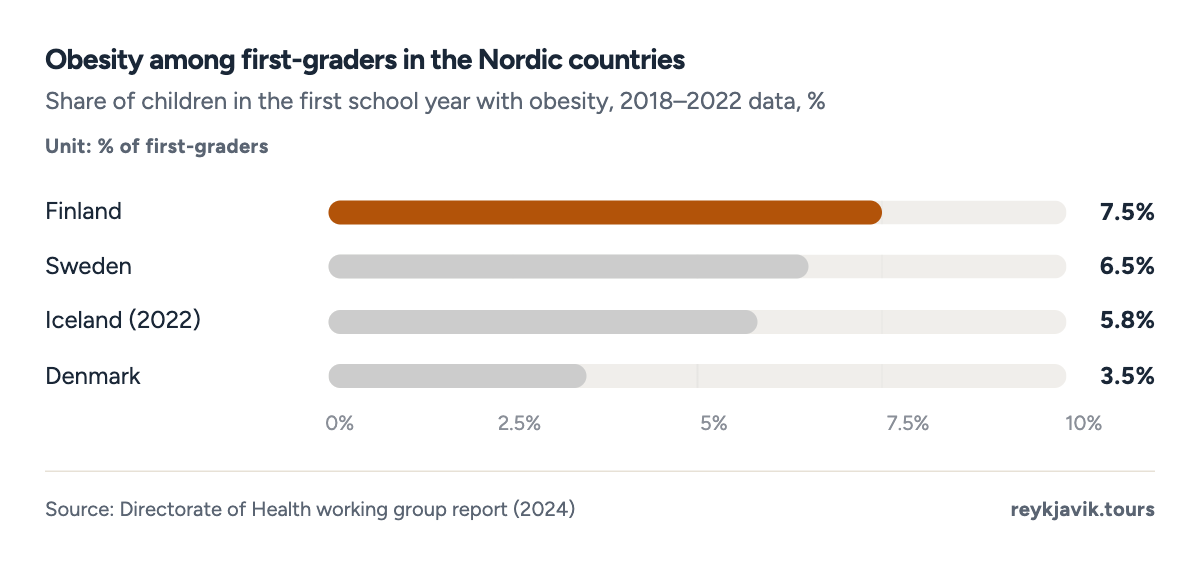
- Icelandic first-graders: 5.8%.
- Finnish first-graders: 7.5%.
Height and weight are not the only Icelandic averages people look up.
Other Icelandic records and counts
The tallest Icelander
The tallest Icelander on record was Jóhann Kristinn Pétursson, known as Jóhann Svarfdælingur or Jóhann the giant, who lived from 19137 to 19847. According to the University of Iceland's Vísindavefurinn, he measured 2.34 m7, which is 7 ft 8 in, or 92 inches3. That is about 21.1 inches3 taller than the average young Icelandic man.
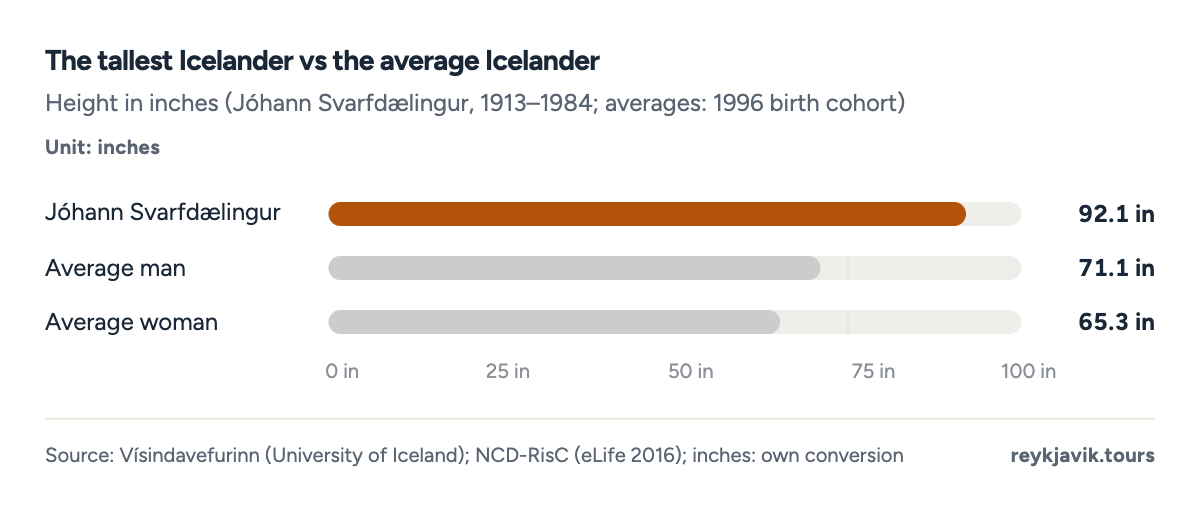
- Jóhann measured 92.1 in.
- The average young man is 71.1 in.
How many golf courses in Iceland?
Golf Iceland's tee-time portal, Rástímar.is, lists 688 golf courses once split nines and weekend layouts are counted as one course. 188 have 18 holes, 498 have 9 holes and 18 has 14, and 58 are marked as practice courses. The capital region has 178 of them and South Iceland 158, while the Northwest has 38.
The courses are busy. Golf Iceland reports about 33,6009 golfers registered in 639 clubs in 2026, 14.4%9 more than a year earlier, and expects about 40,0009 by 2030. Registered golfers numbered just 13210 in 1934, 3,40010 in 1990 and 15,80010 in 2010. Golf Iceland ranks Iceland first in Europe, with 6.2%9 of Icelanders in golf clubs; that share appears to predate the newest count, since 33,600 members would equal about 8.5%3 of the 394,32411 people living in Iceland on 1 January 2026. Children and teenagers make up 15%9 of registered golfers, and about 33%10 were women in 2022. Beyond club members, Golf Iceland estimates that about 60,00012 Icelanders play golf.
- 9 holes4972.1%
- 18 holes1826.5%
- 14 holes11.5%
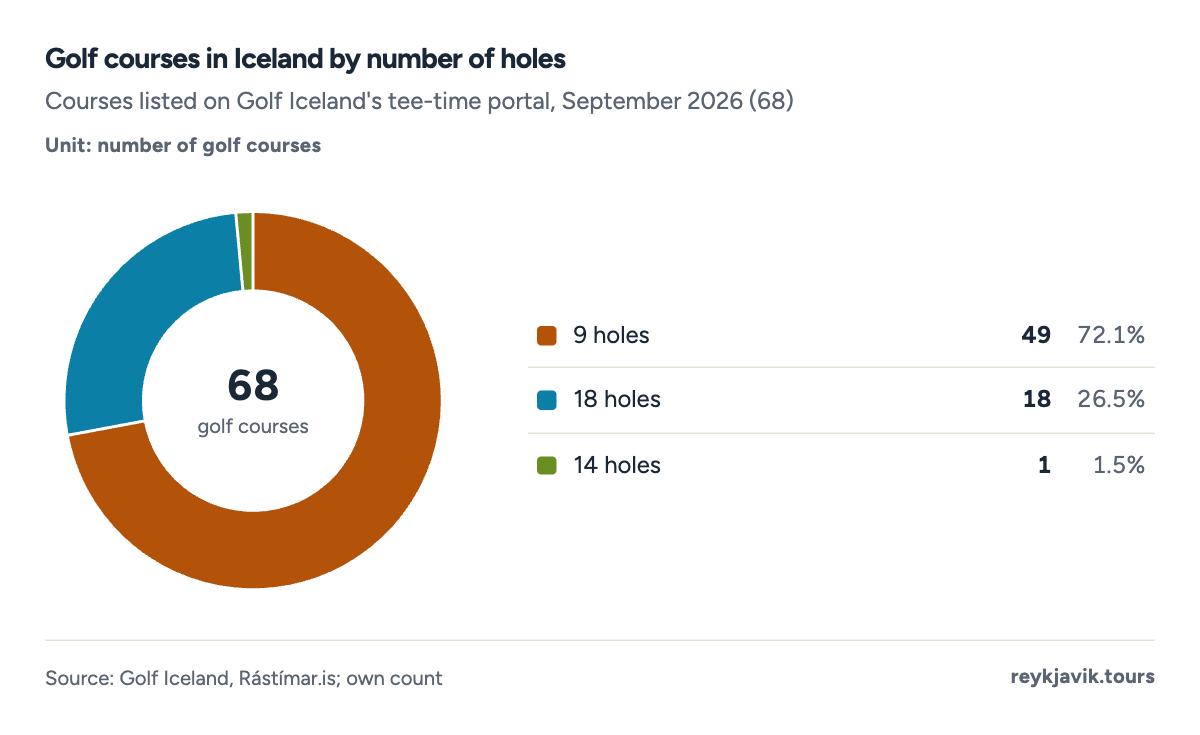
- 49 courses have 9 holes.
- 18 courses have 18 holes.
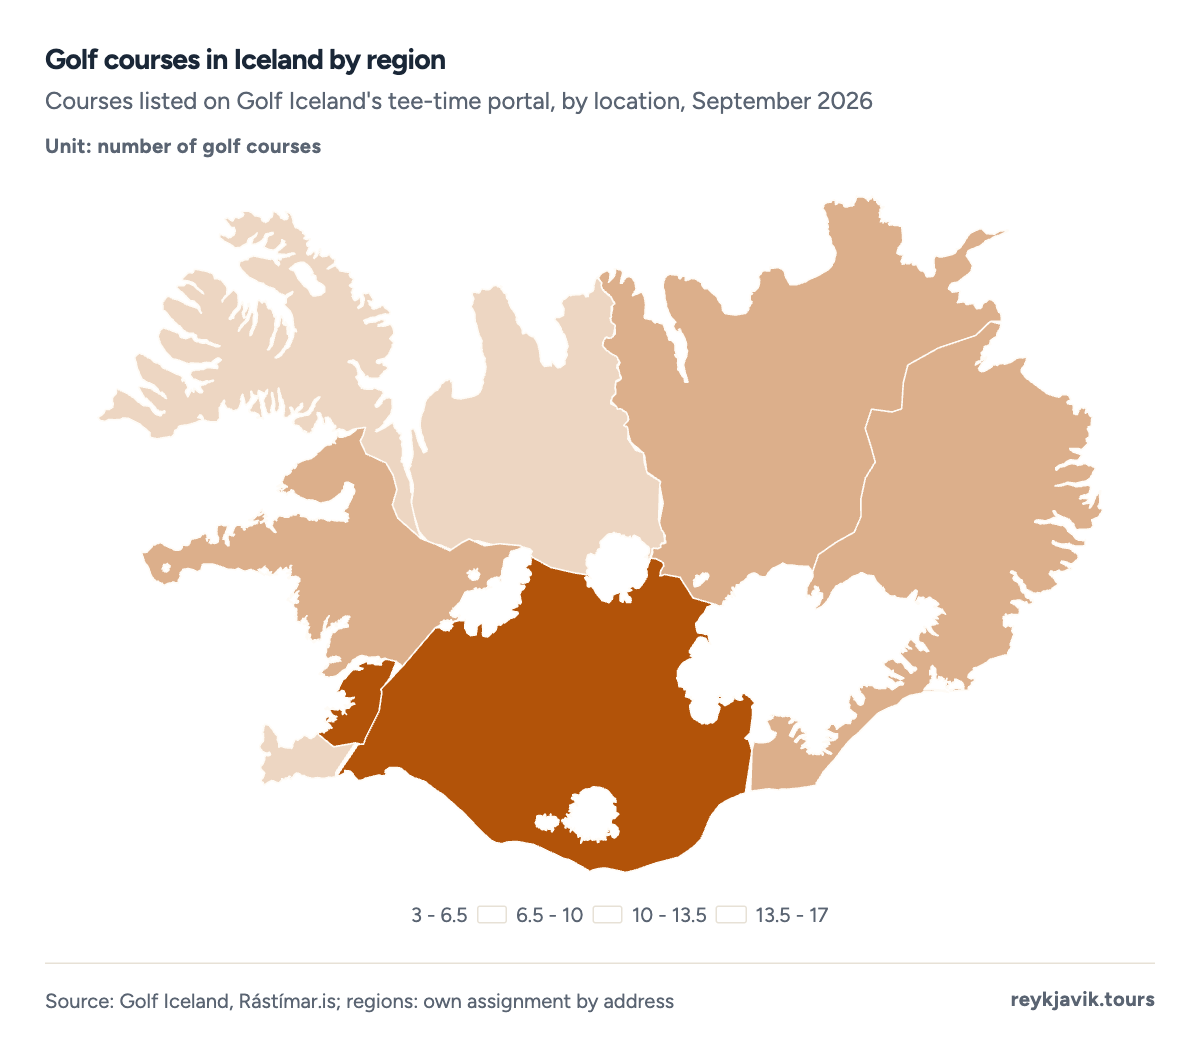
- The capital region has 17 courses.
- The Northwest has 3.
| Brautarholt | Capital region | 18 | Course |
| Grafarholt | Capital region | 18 | Course |
| Hlíðavöllur | Capital region | 18 | Course |
| Hvaleyrarvöllur | Capital region | 18 | Course |
| Leirdalsvöllur | Capital region | 18 | Course |
| Urriðavöllur | Capital region | 18 | Course |
| Bakkakot | Capital region | 9 | Course |
| Korpa - Landið | Capital region | 9 | Course |
| Korpa - Sjórinn | Capital region | 9 | Course |
| Korpa - Áin | Capital region | 9 | Course |
| Ljúflingur | Capital region | 9 | Practice course |
| Mýrin | Capital region | 9 | Course |
| Nesvöllur | Capital region | 9 | Course |
| Setbergsvöllur | Capital region | 9 | Course |
| Sveinskotsvöllur | Capital region | 9 | Practice course |
| Thorsvöllur | Capital region | 9 | Practice course |
| Álftanesvöllur | Capital region | 9 | Practice course |
| Kiðjabergsvöllur | South | 18 | Course |
| Selsvöllur | South | 18 | Course |
| Strandarvöllur | South | 18 | Course |
| Vestmannaeyjavöllur | South | 18 | Course |
| Öndverðarnessvöllur | South | 18 | Course |
| Þorláksvöllur | South | 18 | Course |
| Svarfhólsvöllur | South | 14 | Course |
| Golf í Hraunborgum | South | 9 | Practice course |
| Golfklúbburinn Dalbúi | South | 9 | Course |
| Golfklúbburinn Vík | South | 9 | Course |
| Golfvöllurinn á Fossum | South | 9 | Course |
| Gufudalsvöllur | South | 9 | Course |
| Haukadalsvöllur | South | 9 | Course |
| Úthlíðarvöllur | South | 9 | Course |
| Þverárvöllur | South | 9 | Course |
| Jaðarsvöllur | Northeast | 18 | Course |
| Arnarholtsvöllur | Northeast | 9 | Course |
| Katlavöllur | Northeast | 9 | Course |
| Krossdalsvöllur | Northeast | 9 | Course |
| Lundsvöllur | Northeast | 9 | Course |
| Sigló Golf | Northeast | 9 | Course |
| Skeggjabrekkuvöllur | Northeast | 9 | Course |
| Ásbyrgisvöllur | Northeast | 9 | Course |
| Garðavöllur | West | 18 | Course |
| Hamarsvöllur | West | 18 | Course |
| Garðavöllur undir jökli | West | 9 | Course |
| Golfvöllurinn Glanni | West | 9 | Course |
| Grundarfjarðarvöllur | West | 9 | Course |
| Húsafellsvöllur | West | 9 | Course |
| Rifsvöllur | West | 9 | Course |
| Víkurvöllur | West | 9 | Course |
| Byggðarholtsvöllur | East | 9 | Course |
| Ekkjufellsvöllur | East | 9 | Course |
| Grænanesvöllur | East | 9 | Course |
| Hagavöllur | East | 9 | Course |
| Kollur | East | 9 | Course |
| Silfurnesvöllur | East | 9 | Course |
| Skálavöllur | East | 9 | Course |
| Litlueyrarvöllur | Westfjords | 9 | Course |
| Meðaldalsvöllur | Westfjords | 9 | Course |
| Skeljavíkurvöllur | Westfjords | 9 | Course |
| Syðridalsvöllur | Westfjords | 9 | Course |
| Tungudalsvöllur | Westfjords | 9 | Course |
| Vesturbotnsvöllur | Westfjords | 9 | Course |
| Hólmsvöllur í Leiru | Suðurnes | 18 | Course |
| Húsatóftavöllur | Suðurnes | 18 | Course |
| Kirkjubólsvöllur | Suðurnes | 18 | Course |
| Kálfatjarnarvöllur | Suðurnes | 9 | Course |
| Hlíðarendavöllur | Northwest | 9 | Course |
| Háagerðisvöllur | Northwest | 9 | Course |
| Vatnahverfisvöllur | Northwest | 9 | Course |
| 2026 | 33,600 |
| 2025 (July) | 29,000 |
| 2022 | 23,300 |
| 2010 | 15,800 |
| 2000 | 8,500 |
| 1990 | 3,400 |
| 1934 | 132 |
How many swimming pools in Iceland?
Iceland has about 17013 recreational swimming centres, according to the country update presented by Iceland GeoSurvey and the GRÓ Geothermal Training Programme at the 2025 European Geothermal Congress. 14513 of them use geothermal heat to keep the water at 28–30 °C13 (82–86 °F), and the geothermally heated pools cover about 35,000 m²13, roughly 377,000 square feet. With 394,324 residents, that is about 4.33 swimming centres per 10,000 people, or one for every 2,3203. Heating them took an estimated 3,01913 terajoules of geothermal energy in 2023, and a mid-sized 25-metre outdoor pool uses as much hot water as 80–10013 single-family homes. The greater Reykjavík area alone has 1513 public outdoor pools.
- Geothermal heat14585.3%
- Other heating2514.7%
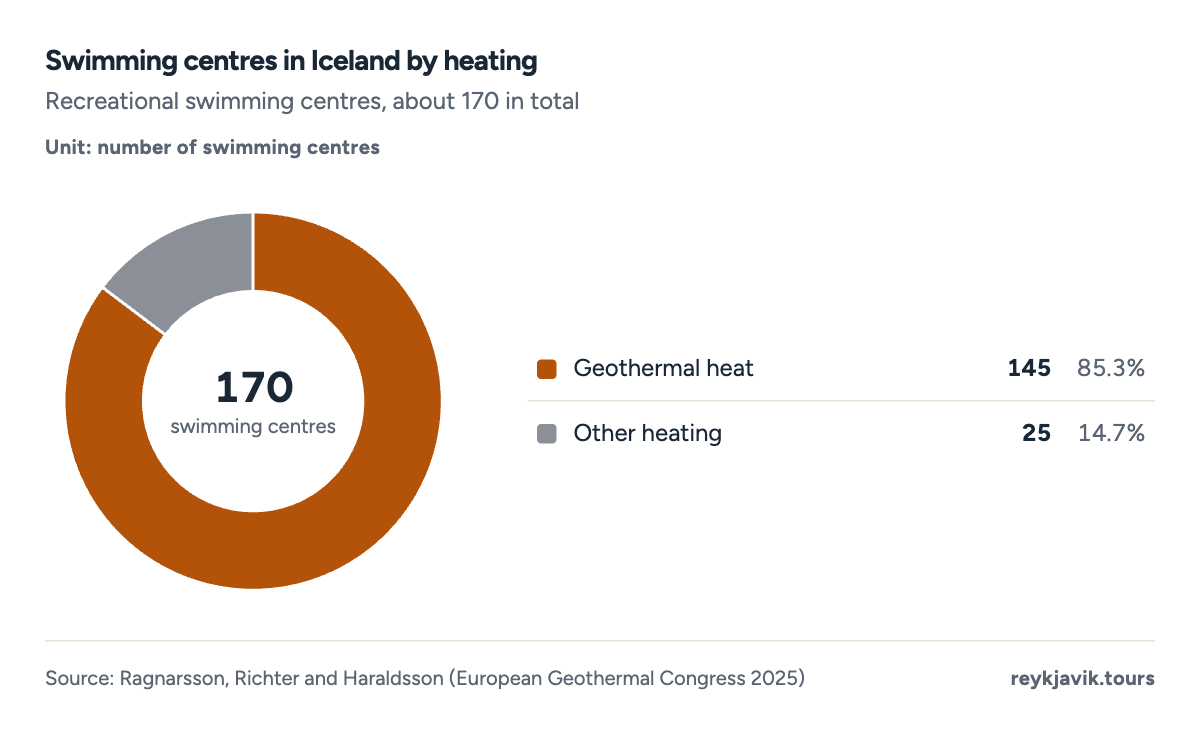
- 145 centres use geothermal heat.
- About 25 use other heating.
| Recreational swimming centres | about 170 |
| Geothermally heated | 145 |
| Water temperature | 82–86 °F (28–30 °C) |
| Geothermal pool surface | about 377,000 sq ft (35,000 m²) |
| Geothermal energy for pools, 2023 | 3,019 terajoules |
| Swimming centres per 10,000 people (own calc.) | 4.3 |
| Public outdoor pools, greater Reykjavík | 15 |
Iceland books published per capita
Statistics Iceland's latest report on book publishing counts 1,48814 printed book titles published in 2015, or 4.514 per 1,000 inhabitants. Around 1999–2000 the rate was about 614 per 1,000, and from 1999 to 2015 an average of 1,59714 books were published a year. Seven in ten books were written in Icelandic, and six in ten translations were from English.14 In 2015, 76%14 of titles were general works, 21%14 were books for children and young people and 3%14 were textbooks. The counts cover printed books and audiobooks only; digital publishing is not included.
- General works7676%
- Children's and youth books2121%
- Textbooks33%
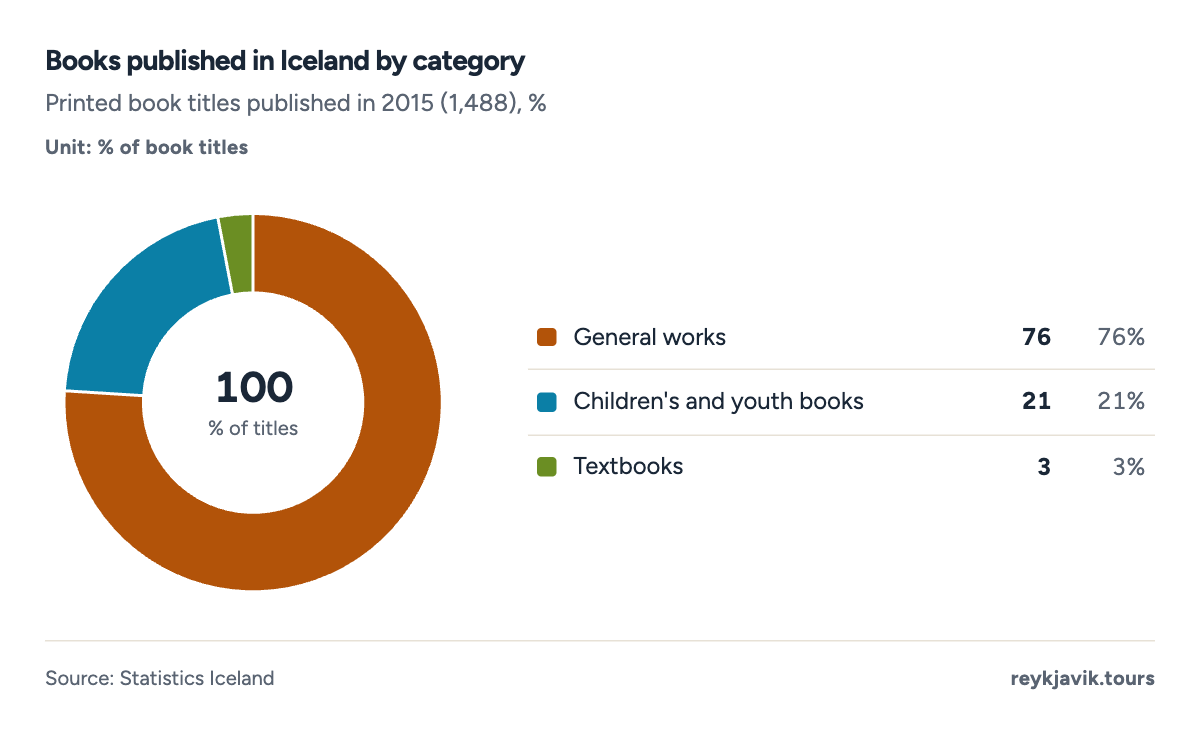
- 76% of titles were general works.
- 21% were children's and youth books.
| Titles published, 2015 | 1,488 |
| Titles per 1,000 inhabitants, 2015 | 4.5 |
| Titles per 1,000 inhabitants, 1999–2000 | about 6 |
| Average titles a year, 1999–2015 | 1,597 |
| Books written in Icelandic | 7 in 10 |
| Translations from English | 6 in 10 |
What the numbers mean
For a visitor, the practical picture is simple: in a crowd in Reykjavík, the average man is about 5 ft 11.1 in3 and the average woman about 5 ft 5.3 in3, a little taller than in the United States and close to the rest of Scandinavia. Iceland's height story is one of an early start and an early finish: its people were already among the taller Europeans before 1900, grew by about 3.9 inches3 for men, and then levelled off with the generations born in the 1960s and 1970s.
The weight story is still moving. Obesity among men rose from about one in sixteen in 1980 to about one in four in 2024,2 and among schoolchildren from 5%6 to 7%6 in a decade. The Directorate of Health's working group framed its 2024 recommendations around prevention and avoiding weight stigma, and noted that weight-related discussion should be handled with care.6 The same island that measures its children's growth every year also supports about 17013 swimming centres and 688 golf courses, facts that say as much about everyday life in Iceland as any single average.
Conclusions
- Icelanders are among the tallest people in the world. Men born in 1996 average 5 ft 11.1 in1 and rank 9th3 of 200 countries; women average 5 ft 5.3 in1 and rank 12th3.
- Growth in height has stopped. Men peaked with the 19741 birth cohort and women with the 19671 cohort, and later generations are within a centimetre or two of those peaks.
- Iceland gained less height than most of Europe because it started tall: 10.0 cm3 for men over the century, against 13.1 cm3 in the Netherlands.
- Body weight is rising faster than height ever did: obesity among men went from 6.4%2 in 1980 to 24.0%2 in 2024, although the increase has slowed since 2010.
- On per-person counts, Iceland stands out in leisure: about one swimming centre for every 2,3203 people and 33,6009 registered golfers on 688 courses.
Methodology
- Height: birth years 1896–1996
- Obesity 1980–2024
- 200 countries
- Checked Sept 16, 2026
Definition. Adult height is the mean height at age 18 of people born in a given year, estimated by NCD-RisC from measured (not self-reported) data. BMI is weight in kilograms divided by height in metres squared; obesity is a BMI of 30 or more. Heights are shown in feet and inches or inches first, with centimetres.
Data sources. Adult height from NCD-RisC (eLife 2016),1 children's height from NCD-RisC (The Lancet 2020),4 BMI categories and obesity from the NCD-RisC 2026 data release,2 mean BMI from WHO's Global Health Observatory,5 national survey and school data from the Directorate of Health,6 golf from Golf Iceland,9 swimming centres from Iceland GeoSurvey and GRÓ,13 and books from Statistics Iceland.14
Calculations. Centimetres are converted at 2.54 cm per inch and kilograms at 2.20462 lb per kg. Ranks sort the 200 countries in the height data; European ranks for obesity use 45 European countries. Illustrative weight = mean BMI (2016, all adults) × average height² (1996 birth cohort). Golf courses are counted from Golf Iceland's tee-time portal, with split nines and weekend layouts counted once and regions assigned from the address. Trends are straight least-squares lines drawn forward to 2050 with a 95% prediction range.
Limitations. The newest adult birth cohort in the height study is 1996, and its estimate has a wider uncertainty range. National survey figures are self-reported and not age-standardised, so they differ from the modelled estimates. The illustrative weight mixes an all-adult BMI with young-adult heights. The golf share of 6.2% and the 2026 member count may refer to different years. Book figures end in 2015. No sourced national figures were found for fjords, Thor place names or passport ownership, so they are not covered. Projections are straight-line extrapolations, not forecasts.
Sources
- NCD Risk Factor Collaboration (NCD-RisC). “A century of trends in adult human height (eLife 5:e13410); country data by birth year 1896–1996.” eLife Sciences, 26 July 2016. elifesciences.org. Accessed 16 Sept. 2026. Back to text
- NCD Risk Factor Collaboration (NCD-RisC). “Adult body-mass index: age-standardised prevalence of underweight, BMI categories and obesity by country, 1980–2024 (Nature 2026 data release).” NCD-RisC, 2026. ncdrisc.org. Accessed 16 Sept. 2026. Back to text
- Reykjavik Tours research. “Height, weight and per-person calculations from NCD-RisC, WHO, Golf Iceland and Statistics Iceland data.” Reykjavik Tours. reykjavik.tours. Accessed 16 Sept. 2026. Back to text
- NCD Risk Factor Collaboration (NCD-RisC). “Height and body-mass index trajectories of school-aged children and adolescents from 1985 to 2019 in 200 countries and territories (The Lancet 396: 1511–1524); Iceland data.” The Lancet, 2020. ncdrisc.org. Accessed 16 Sept. 2026. Back to text
- World Health Organization. “Mean BMI (kg/m²), age-standardized estimate, adults 18+ (indicator NCD_BMI_MEAN).” WHO Global Health Observatory. who.int. Accessed 16 Sept. 2026. Back to text
- Directorate of Health (Embætti landlæknis) working group. “Stefnumarkandi áherslur í forvörnum, heilsueflingu og meðferð – tillögur að aðgerðum varðandi offitu, holdafar, heilsu og líðan.” Ministry of Health (Heilbrigðisráðuneytið), Feb. 2024. stjornarradid.is. Accessed 16 Sept. 2026. Back to text
- Sveinbjörnsdóttir, Emilía Dagný. “Hvað var Jóhann risi stór í millimetrum? (How tall was Jóhann the giant in millimetres?).” Vísindavefurinn, University of Iceland, 7 Mar. 2008. visindavefur.is. Accessed 16 Sept. 2026. Back to text
- Golfsamband Íslands (Golf Iceland). “Rástímar.is: Golfvellir á Íslandi (golf courses in Iceland); own count.” Golfsamband Íslands. rastimar.golf.is. Accessed 16 Sept. 2026. Back to text
- Golfsamband Íslands (Golf Iceland). “Tölulegar upplýsingar (statistics).” Golfsamband Íslands. golf.is. Accessed 16 Sept. 2026. Back to text
- Golfsamband Íslands (Golf Iceland). “Fjöldi kylfinga á Íslandi hefur aldrei verið meiri.” Golfsamband Íslands, 11 Aug. 2022. golf.is. Accessed 16 Sept. 2026. Back to text
- Statistics Iceland (Hagstofa Íslands). “Population – key figures 1703–2026 (MAN00000).” Statistics Iceland. px.hagstofa.is. Accessed 16 Sept. 2026. Back to text
- Golfsamband Íslands (Golf Iceland). “Fjölgun meðlima í 85% allra golfklúbba á landinu.” Golfsamband Íslands, 13 July 2025. golf.is. Accessed 16 Sept. 2026. Back to text
- Ragnarsson, Árni; Richter, Bjarni and Haraldsson, Ingimar G.. “Geothermal Energy Use, Country Update for Iceland (European Geothermal Congress 2025).” GRÓ Geothermal Training Programme and Iceland GeoSurvey (ÍSOR), 2025. europeangeothermalcongress.eu. Accessed 16 Sept. 2026. Back to text
- Statistics Iceland (Hagstofa Íslands). “Book publishing 1999–2015.” Statistics Iceland, 27 Sept. 2017. statice.is. Accessed 16 Sept. 2026. Back to text
About the author
Laufey turns public statistics on tourism and travel into research people can check and cite.
Every figure on this page links to its source. How we research
Related research
More data on Iceland's weather and travel from Reykjavik Tours.
- SocietyHow Many People Live in Iceland? (2026 Data)396,500 people living in IcelandRead the research →
- SocietyWhat Is the Biggest City in Iceland? (2026 Data)140,470 residents of Reykjavík, Iceland's biggest cityRead the research →
- SocietyIceland Ethnic Composition Percentage (2026 Data)70.9% of Iceland's residents have no foreign backgroundRead the research →