Iceland Ethnic Composition Percentage (2026 Data)
Who lives in Iceland by origin, birthplace and citizenship: how homogeneous the country is, its largest immigrant groups, and the official answers to the white and Black percentage questions.
- Published
- Updated
- 15 sources
- 98 statistics
- 12 min read

- M.Sc. in Atmospheric Sciences, University of Iceland (Háskóli Íslands), with a minor thesis on North Atlantic storm-track variability
- Former research assistant at the Icelandic Meteorological Office (Veðurstofa Íslands), working on subarctic climate modeling and volcanic-ash dispersion forecasting
- B.A. in Sociology, also from the University of Iceland, with fieldwork on rural depopulation and tourism's impact on small fishing communities (Westfjords focus)
- Grew up in Akureyri, spent seven years living in Reykjavík and two in a small village in the Westfjords - brings first-hand experience of Iceland's regional weather extremes and community life
- Fluent in Icelandic and English; has translated Icelandic Met Office public advisories for international outlets
- Published field notes and data-driven pieces on glacier retreat (Vatnajökull), aurora forecasting, and the socioeconomic effects of overtourism in the Golden Circle

- M.A. in Journalism, University of Iceland, with additional coursework in Environmental Communication at the University of Bergen (Norway), giving a comparative Nordic lens
- 12+ years in Icelandic media, including editorial roles at RÚV (Iceland's national broadcaster) covering weather-related public safety reporting (storms, volcanic eruptions, road closures)
- Former fact-checking lead for a travel-and-culture desk, specializing in verifying tourism statistics, safety advisories, and climate data against primary sources (Vedur.is, Statistics Iceland)
- Has overseen editorial standards for bilingual (Icelandic/English) publications, ensuring both cultural nuance and accuracy for international readers
- Advocate for citing primary sources (Icelandic Met Office, Icelandic Tourist Board / Ferðamálastofa) rather than secondhand reporting
Key findings
- 70.9%Some 70.9% of Iceland's residents had no foreign background on 1 January 2026.
- 19.6%Immigrants make up 19.6% of Iceland's population, up from 2.0% in 1996.
- 22.7%In total 22.7% of Iceland's residents were born abroad - 8th highest of 31 European countries.
- 23,329Around 23,329 Polish citizens live in Iceland, the largest foreign group by far.
- 17.9%Foreign citizens are 17.9% of Iceland's residents, up from 1.9% in 1950.
- 0.6%About 0.6% of residents were born in Sub-Saharan Africa or the Caribbean; Iceland collects no race data.
- 86%Fully 86% of Icelanders hear English every day, a University of Iceland study found.
- 67%About 67% of residents belong to Christian congregations, and 7.7% to none.
In 19961, 93.7%1 of Iceland's residents had no foreign background - as close to a single-origin nation as Europe had. Three decades later that share is 70.9%1, 19.6%1 of the population are immigrants, and the change happened faster in the last ten years than in the previous sixty. The island did not move; who moves to it did.
This report brings together Statistics Iceland's origin, birthplace, citizenship, religion and language registers, with Eurostat comparisons, to answer the Iceland ethnic composition percentage question with the deepest data published anywhere. It also answers the race questions searchers ask - white percentage, Black population - honestly: Iceland collects no race data, so the page shows the official proxies (origin, country of birth, citizenship) and labels every estimate that is not official. Along the way: one small municipality that is 64% immigrant, residents born in 1862 different countries and territories, and a church register that says less about belief than about paperwork.
Iceland's ethnic composition in 2026
Statistics Iceland does not ask anyone their ethnicity. What it publishes instead is origin: a descent-based register that splits every resident into five groups. For the Iceland ethnic groups percentage breakdown, on 1 January 2026 the population of 394,3241 divided as follows: 279,6391 people (70.9%) had no foreign background, 77,2261 (19.6%) were immigrants, 8,3511 (2.1%) were second-generation immigrants born in Iceland to two immigrant parents, 16,8051 (4.3%) were born in Iceland with one parent born abroad, and 12,3031 (3.1%) were born abroad themselves but have an Icelandic-born parent.
The definitions matter. An immigrant, in the official sense, is a person born abroad whose parents and grandparents were also born abroad - so a child born in Reykjavík to Polish parents counts as a second-generation immigrant, not an immigrant, while an Icelander born in Denmark to Icelandic parents counts in none of the foreign groups at all. Counting everyone with an immigrant background together - immigrants plus the second generation - gives 85,5771 people, or 21.7%1 of the population.
- No foreign background279,63970.9%
- Immigrants77,22619.6%
- Born in Iceland, one parent born abroad16,8054.3%
- Other origin groups20,6545.2%
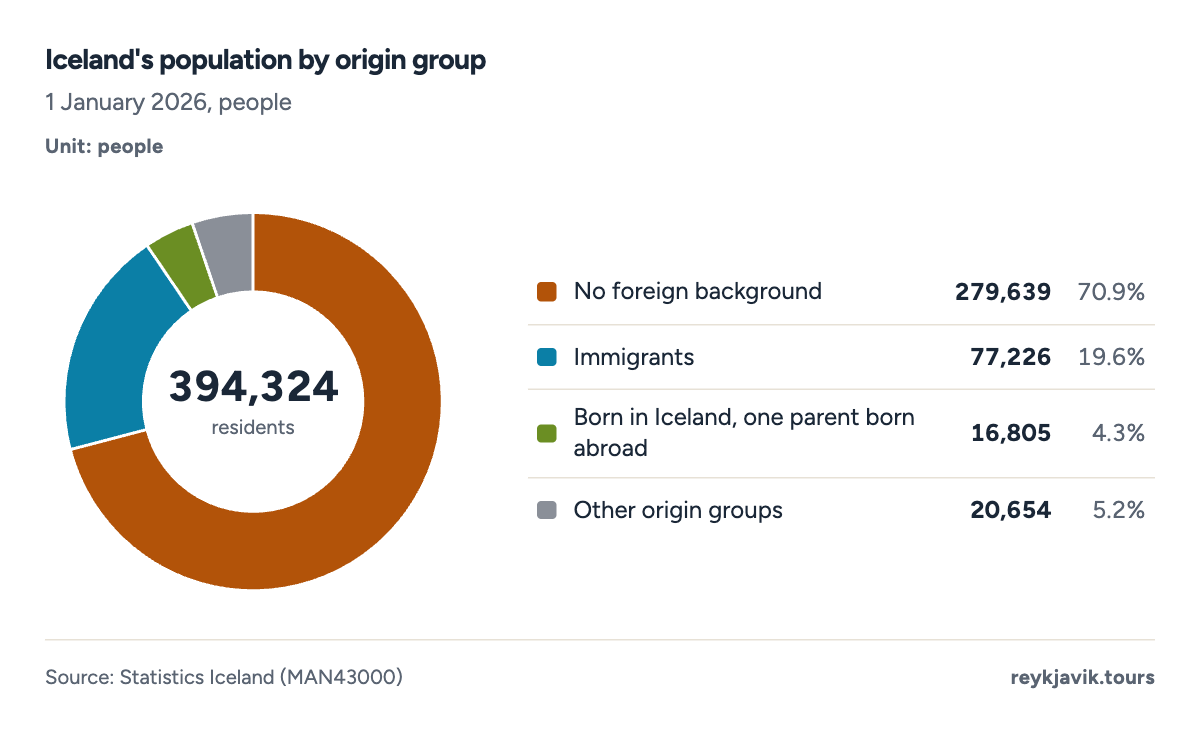
- 70.9% of residents have no foreign background.
- Immigrants are 19.6% of the population.
| No foreign background | 279,639 | 70.9% | 83.0% |
| Immigrants | 77,226 | 19.6% | 9.1% |
| Second-generation immigrants | 8,351 | 2.1% | 1.2% |
| Born in Iceland, one parent born abroad | 16,805 | 4.3% | 3.7% |
| Born abroad, Icelandic parent(s) | 12,303 | 3.1% | 3.1% |
| Total population | 394,324 | 100% | 100% |
From 93.7% to 70.9%: three decades of change
The origin series starts in 1996, when immigrants were just 5,3571 people, 2.0%1 of the population, and second-generation immigrants were a rounding error of 3451. By 2006 the immigrant share had reached 5.6%1, by 2016 9.1%1, and by 2026 19.6%1. The no-foreign-background share fell from 93.7% to 70.9% over the same thirty years. In absolute numbers the population without foreign background has barely moved - 251,0571 then, 279,6391 now - so almost all of Iceland's growth since 1996 came from people with foreign background and their children.
Natives and the foreign-born share
The Iceland native population percentage - people born in Iceland - stood at 77.30%2 on 1 January 2026, meaning 22.70%2 of residents, 89,5292 people, were born abroad. Measured the other way - the Iceland ethnic homogeneity percentage - only 4.6% of residents were born abroad in 1998, when only 4.6% of residents were born abroad, and the Iceland foreign born percentage 2023 was 19.9%2. The straight-line projection on the chart extends the 2005–2026 trend to 2050, where it lands near 30% - our calculation, not a forecast.
- No foreign background
- Immigrants
- Second generation
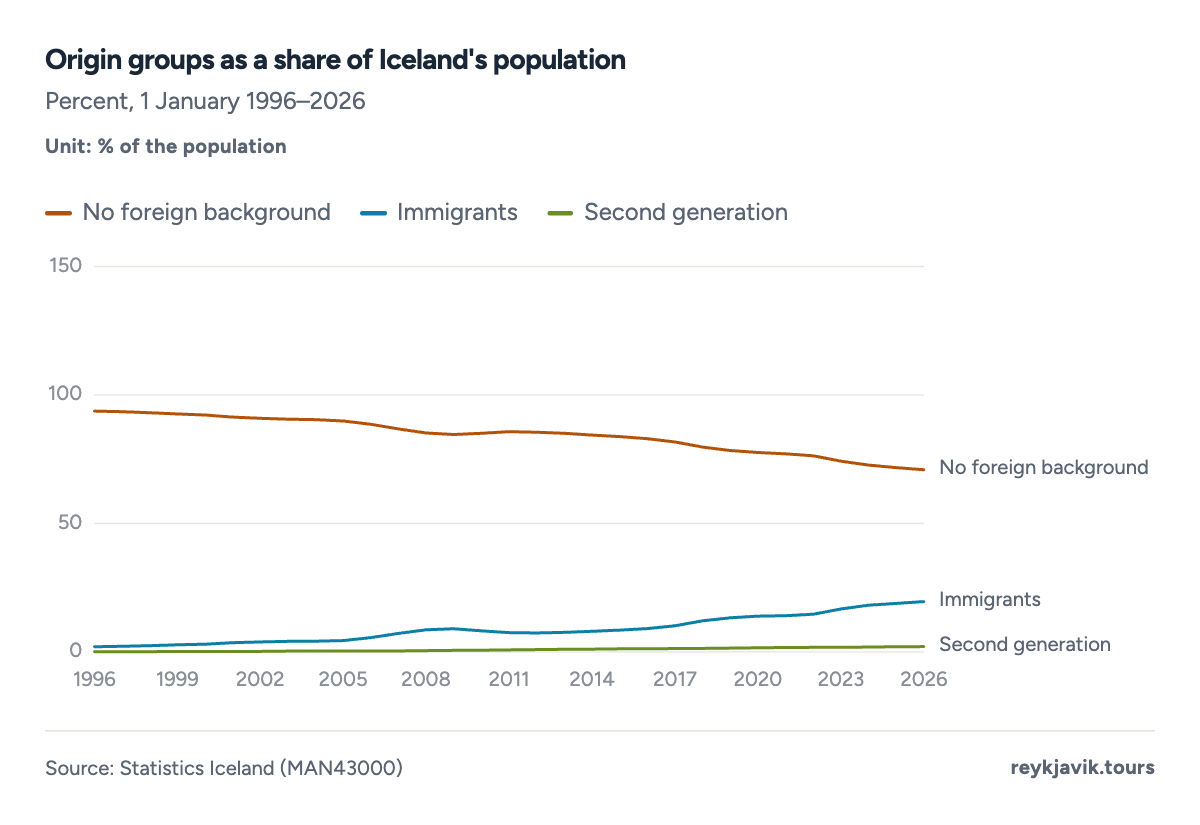
- The no-foreign-background share fell from 93.7% to 70.9%.
- Immigrants rose from 2.0% to 19.6%.
Projection: linear trend of 2005–2026 yearly values, 95% prediction range. Our calculation, not a forecast.
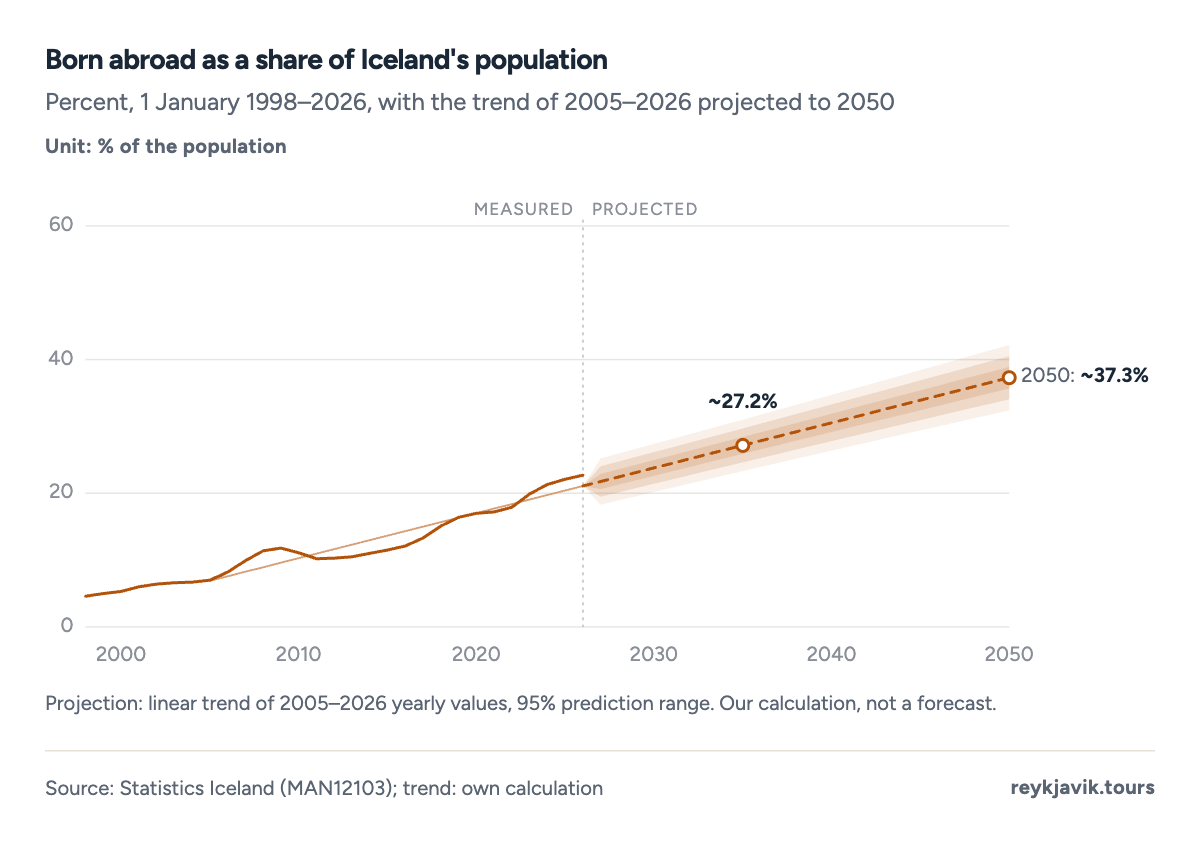
- 22.7% of residents were born abroad in 2026.
- In 1998 the share was 4.6%.
| 1996 | 93.7 | 2.0 | 0.1 | 2.1 | 267,809 |
| 2001 | 91.4 | 3.6 | 0.2 | 3.7 | 283,361 |
| 2006 | 88.6 | 5.6 | 0.4 | 5.9 | 299,891 |
| 2011 | 85.7 | 7.5 | 0.8 | 8.3 | 311,841 |
| 2016 | 83.0 | 9.1 | 1.2 | 10.3 | 326,036 |
| 2021 | 77.1 | 14.1 | 1.7 | 15.7 | 358,298 |
| 2026 | 70.9 | 19.6 | 2.1 | 21.7 | 394,324 |
Race in Iceland's statistics: what is counted
No Icelandic register, census or survey run by Statistics Iceland records race or self-identified ethnicity. The categories this page reports - origin, country of birth, citizenship, and (for organizations people join) religion - are the official building blocks. The CIA World Factbook, which compiles an "ethnic groups" field for every country, handles Iceland the same way: it lists Icelandic 81.3%3, Polish 5.6%, Danish 1% and other 12.1%, with the note that the data represent population by country of birth (2021 estimate). Earlier editions described the population as a homogeneous mixture of Norse and Celtic descendants. The settlement-era ancestry is real - the first settlers came from Norway and from Norse colonies in Scotland and Ireland around 874–930 - but today the usable numbers are the register ones on this page.
What percentage of Iceland is white
There is no official white percentage, because nobody is counted as white. The closest official proxy stacks the groups that are unambiguously European by descent or birth: the 70.9%1 with no foreign background, plus the 3.1% born abroad with an Icelandic parent. Among immigrants themselves, 55,9412 of the 77,2262 - 72.4% - were born in Europe, chiefly Poland, Ukraine and the Baltic states. Adding Europeans who are second-generation immigrants or born in Iceland to foreign parents is not possible without assumptions, so any single "white" figure would be an estimate; roughly 85–88% is the range such stacking supports, and it is ours, not an official statistic.
How many Black people live in Iceland
The Black population of Iceland is not counted. The nearest official proxy is birthplace: 2,2332 residents born in Sub-Saharan Africa and 1942 born in the Caribbean were immigrants in 2026, 2,4272 people together, or about 0.6%2 of the population - three and a half times the 685 of 2016. The true number of Black residents is somewhat higher than this proxy, because it misses Black people born in Iceland, in Europe or in the Americas, and it includes white Africans; no official figure resolves that, so the proxy is what this page reports.
The largest immigrant groups
Poland towers over the list. Of the 77,2262 immigrants in Iceland in 2026, 23,0552 were born in Poland - nearly one in three - followed by Ukraine with 4,7192, Lithuania with 3,8012, Romania with 3,3702 and the Philippines with 2,8892. The 2016 list had the same leader but a different tail: Germany, Thailand and Viet Nam ranked higher then, while Ukraine went from 2562 people in 2016 to 4,7192 in 2026 and Venezuela appeared with 1,9612. By citizenship the ranking shifts only slightly, because most immigrants keep their first citizenship.
How many Poles in Iceland?
23,0552 residents were born in Poland and 23,3294 hold Polish citizenship - about 5.9%4 of Iceland's population, more than the next four foreign citizenships combined.
How many Indians are in Iceland?
6232 immigrants were born in India (789 counting those with an Icelandic-born parent), and 5614 residents hold Indian citizenship.
How many Mexicans live in Iceland?
2042 residents were born in Mexico and 1334 hold Mexican citizenship - a small group, but eight times its 1998 size.
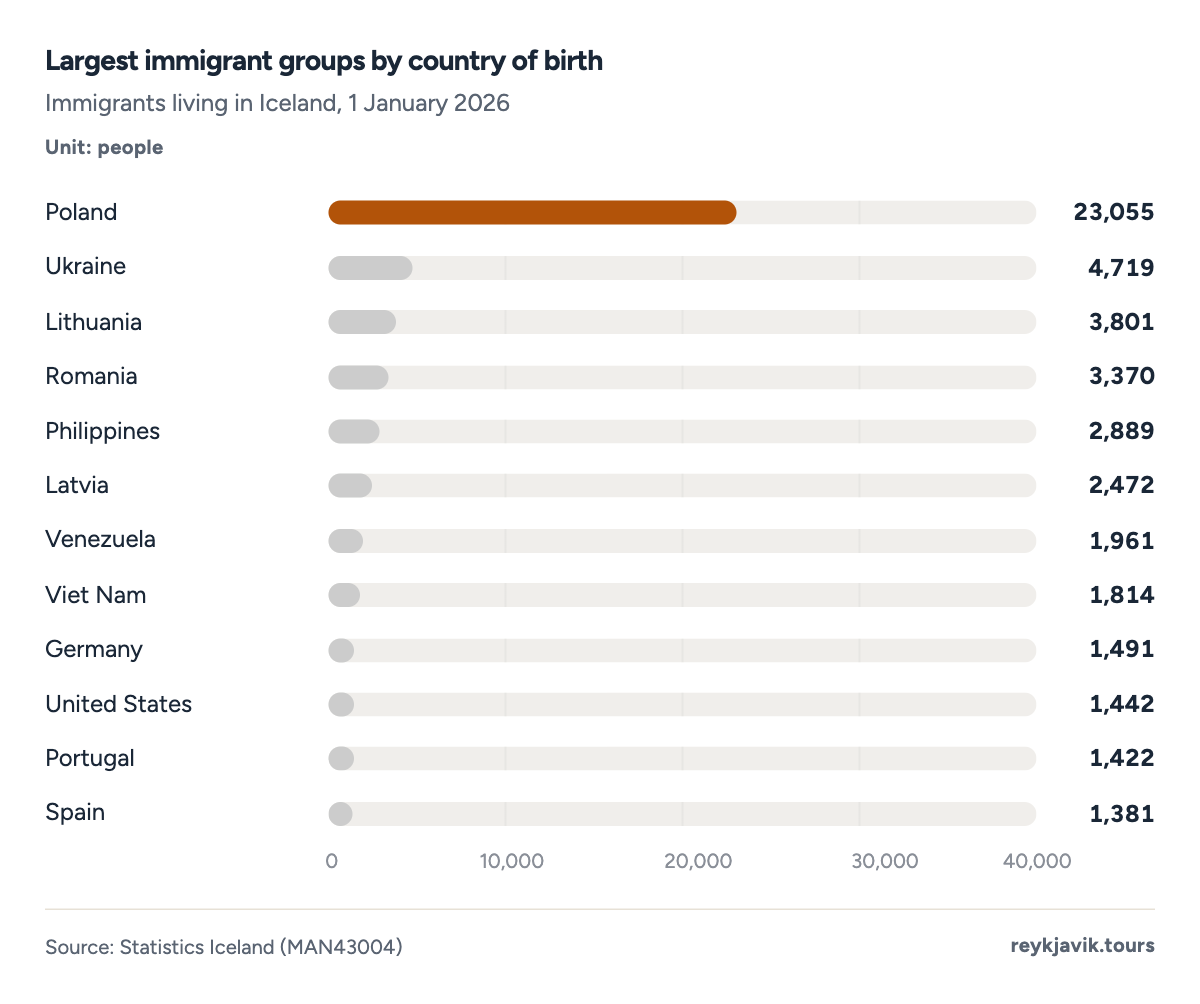
- 23,055 immigrants were born in Poland.
- Ukraine is second with 4,719.
| 1 | Poland | 23,055 | 29.9 | 11,377 |
| 2 | Ukraine | 4,719 | 6.1 | 256 |
| 3 | Lithuania | 3,801 | 4.9 | 1,491 |
| 4 | Romania | 3,370 | 4.4 | 474 |
| 5 | Philippines | 2,889 | 3.7 | 1,492 |
| 6 | Latvia | 2,472 | 3.2 | 731 |
| 7 | Venezuela | 1,961 | 2.5 | 37 |
| 8 | Viet Nam | 1,814 | 2.3 | 604 |
| 9 | Germany | 1,491 | 1.9 | 995 |
| 10 | United States | 1,442 | 1.9 | 664 |
| 11 | Portugal | 1,422 | 1.8 | 573 |
| 12 | Spain | 1,381 | 1.8 | 428 |
Foreign citizens and new Icelanders
Counted by passport rather than birthplace, 70,5554 residents of Iceland held foreign citizenship on 1 January 2026 - 17.9%4 of the population. The long series shows how recent the change is: 1.9%4 in 1950, 1.9% still in 1996, 7.5%4 in 2016, then a decade that added more than ten percentage points. Iceland's own count says 17.9% for 2026; Eurostat's harmonised series shows the same trajectory but currently ends at 2022.
The other side of the ledger is naturalization. 1,0855 people acquired Icelandic citizenship in 2025 - the highest number in the series that starts in 1991 - and 17,8095 have done so since 1991. In 2025 the largest groups of new Icelanders came from Poland (199), the Philippines (79) and Syria (64).
Projection: linear trend of 2005–2026 yearly values, 95% prediction range. Our calculation, not a forecast.
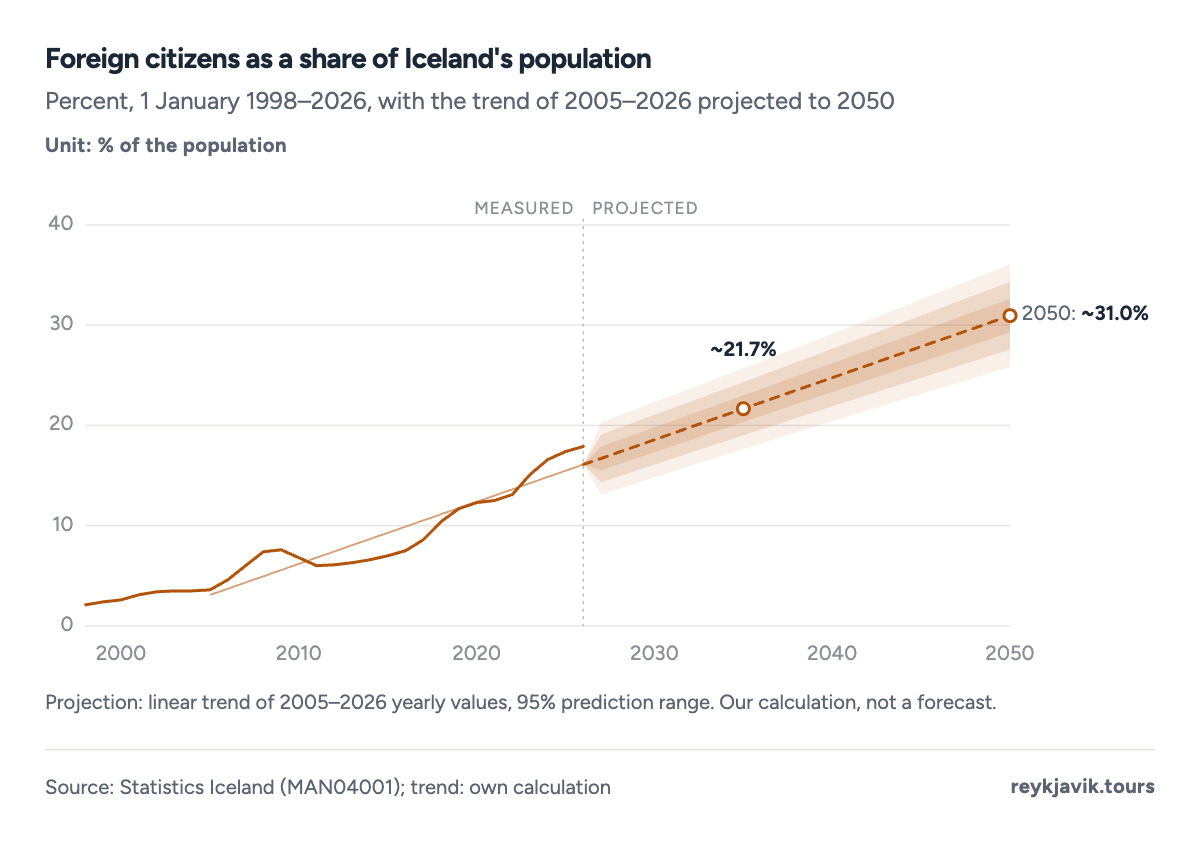
- Foreign citizens were 17.9% of residents in 2026.
- The share was 2.1% as recently as 1998.
Projection: linear trend of 2005–2025 yearly values, 95% prediction range. Our calculation, not a forecast.
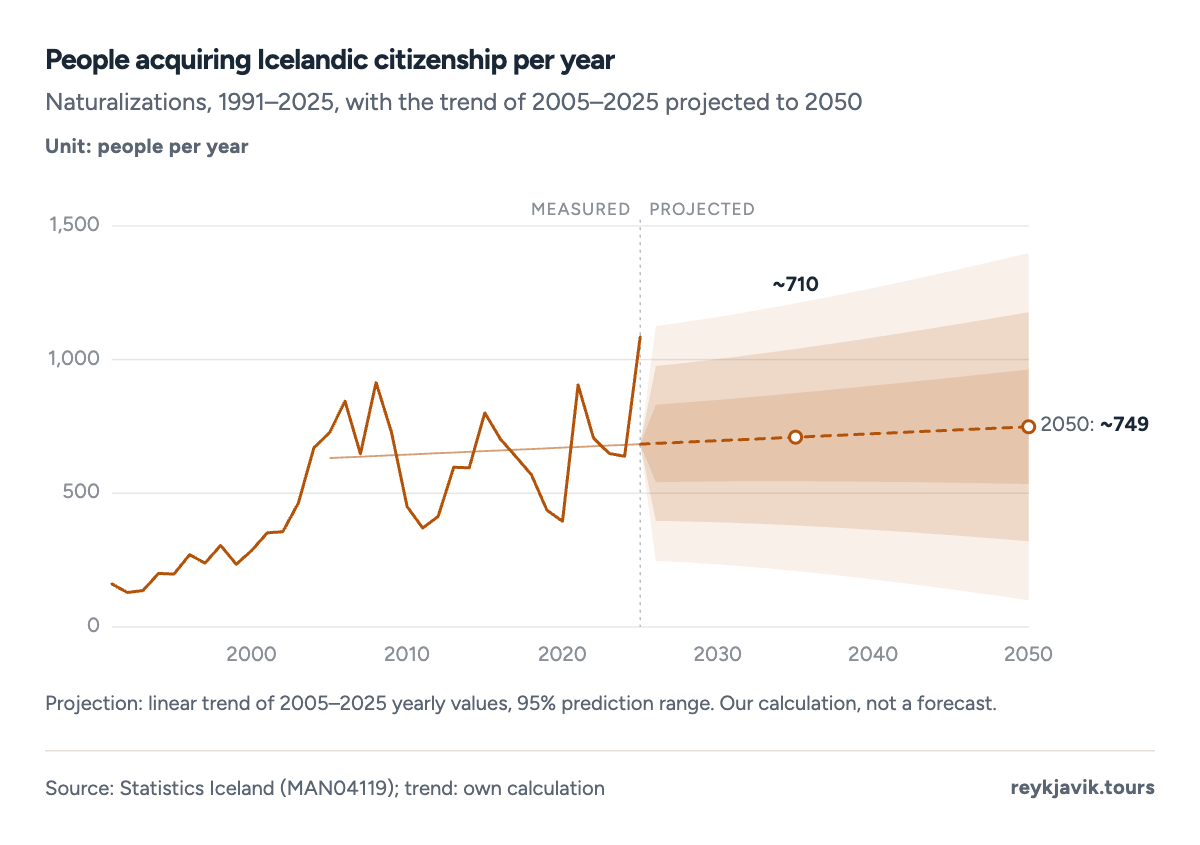
- 1,085 people became Icelandic citizens in 2025.
- The 1991–2025 total is 17,809.
| 1 | Poland | 23,329 | 33.1 | 11,451 |
| 2 | Lithuania | 4,725 | 6.7 | 1,682 |
| 3 | Ukraine | 4,636 | 6.6 | 150 |
| 4 | Romania | 3,972 | 5.6 | 399 |
| 5 | Latvia | 2,535 | 3.6 | 736 |
| 6 | Venezuela | 1,931 | 2.7 | 7 |
| 7 | Spain | 1,884 | 2.7 | 456 |
| 8 | Portugal | 1,805 | 2.6 | 605 |
| 9 | Philippines | 1,716 | 2.4 | 518 |
| 10 | Germany | 1,455 | 2.1 | 863 |
| 11 | Viet Nam | 1,188 | 1.7 | 241 |
| 12 | Czechia | 1,155 | 1.6 | 249 |
| 1 | Poland | 199 |
| 2 | Philippines | 79 |
| 3 | Syria | 64 |
| 4 | Viet Nam | 49 |
| 5 | Iraq | 38 |
| 6 | Ukraine | 34 |
| 7 | United States | 33 |
| 8 | Romania | 32 |
| 9 | Russia | 31 |
| 10 | Lithuania | 30 |
Where immigrants live
Immigrants are everywhere in the statistics, but not evenly on the map. The highest share is not in Reykjavík but in Mýrdalshreppur, the municipality of Vík on the south coast, where 64.0%6 of the 1,0046 residents are immigrants - seasonal and tourism workers in a village of a few hundred locals. Bláskógabyggð around Þingvellir follows at 37.0%6, then the Reykjanes towns near the Keflavík airport and fish processing plants at 35.5%6. In Reykjavík itself, 37,3486 immigrants make up 26.7%6 of the capital's population - double the 12.4% of 2016, but below towns like Akureyri's 11.7% is the lowest among the larger centres.
Inside Reykjavík: district by district
Within the capital the spread is wide. Breiðholt, the apartment-block district of the east, is 61.8%6 immigrant, Miðborg in the centre 38.6%6, while Grafarvogur in the northwest - more owner-occupied houses - is 16.0%6. People registered without a district are excluded from the comparison.
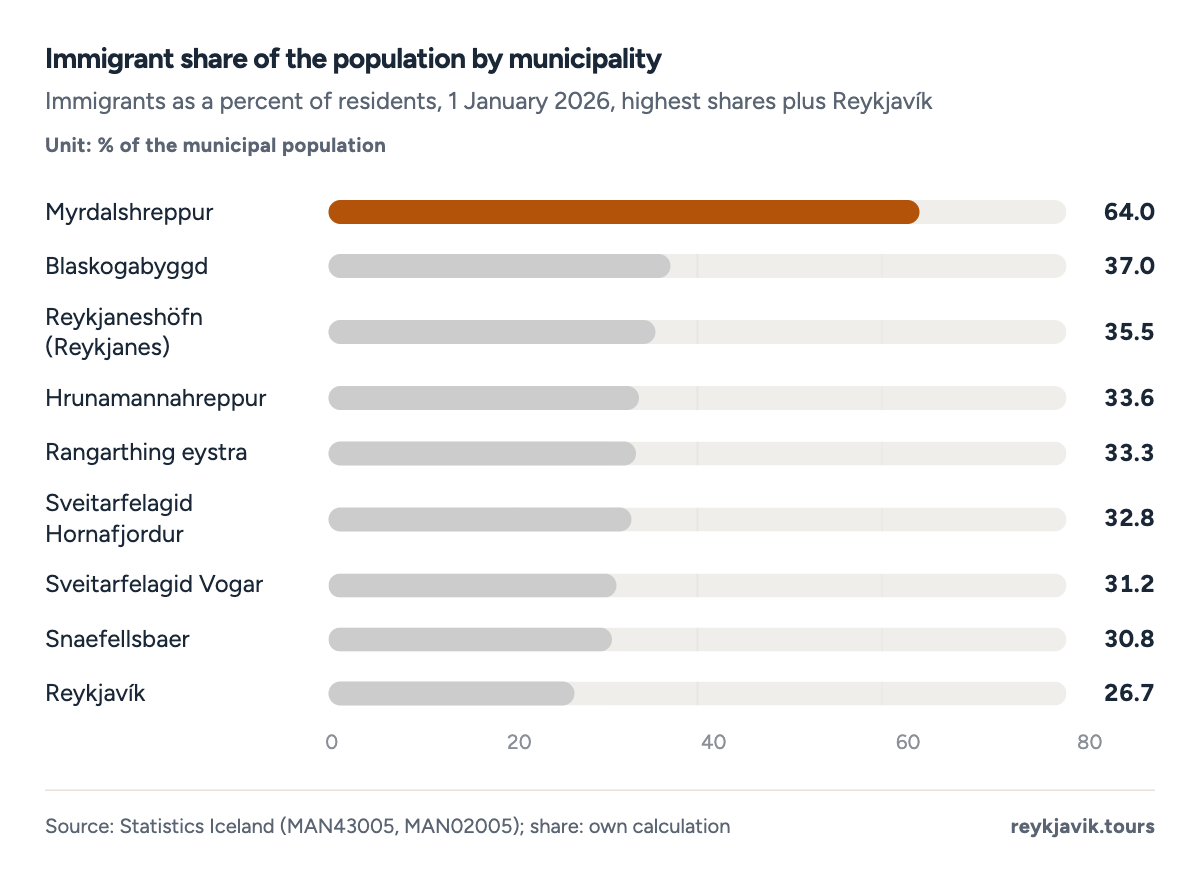
- Mýrdalshreppur (Vík) is 64.0% immigrant.
- Reykjavík's share is 26.7%.
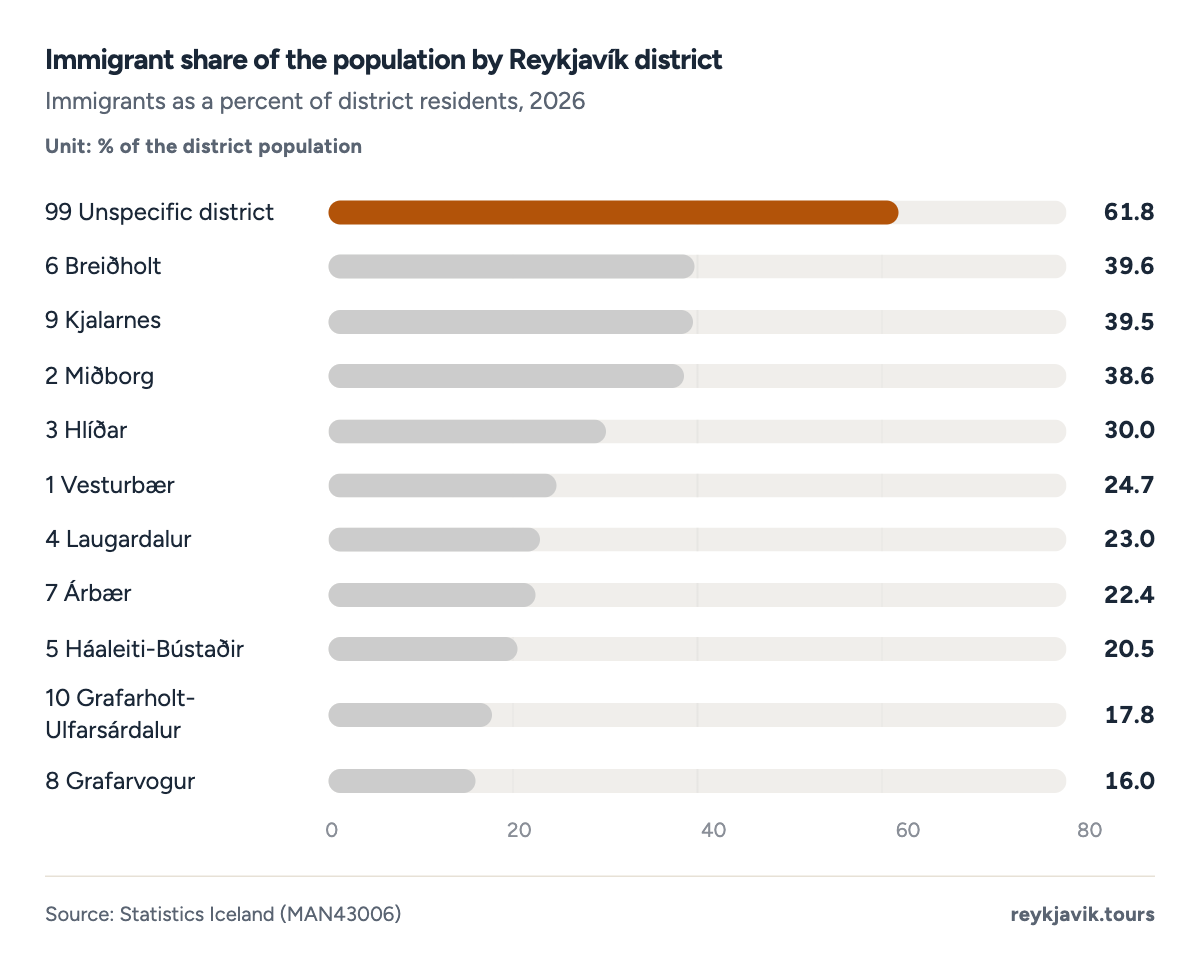
- Breiðholt is the district with the highest immigrant share.
- Grafarvogur has the lowest share shown.
| 1 | Myrdalshreppur | 1,004 | 643 | 64.0 | 19.9 |
| 2 | Blaskogabyggd | 1,453 | 537 | 37.0 | 16.5 |
| 3 | Reykjaneshöfn (Reykjanes) | 22,697 | 8,049 | 35.5 | 14.9 |
| 4 | Hrunamannahreppur | 912 | 306 | 33.6 | 17.3 |
| 5 | Rangarthing eystra | 2,142 | 713 | 33.3 | 16.1 |
| 6 | Sveitarfelagid Hornafjordur | 2,631 | 864 | 32.8 | 10.5 |
| 7 | Sveitarfelagid Vogar | 1,896 | 592 | 31.2 | 12.8 |
| 8 | Snaefellsbaer | 1,669 | 514 | 30.8 | 20.4 |
| 9 | Reykjavík | 139,804 | 37,348 | 26.7 | 12.4 |
| 10 | Kópavogur | 40,286 | 7,254 | 18.0 | 9.3 |
| 11 | Hafnarfjörður | 32,398 | 6,518 | 20.1 | 10.0 |
| 12 | Akureyri | 20,284 | 2,365 | 11.7 | 4.3 |
| 1 | 99 Unspecific district | 61.8 |
| 2 | 6 Breiðholt | 39.6 |
| 3 | 9 Kjalarnes | 39.5 |
| 4 | 2 Miðborg | 38.6 |
| 5 | 3 Hlíðar | 30.0 |
| 6 | 1 Vesturbær | 24.7 |
| 7 | 4 Laugardalur | 23.0 |
| 8 | 7 Árbær | 22.4 |
| 9 | 5 Háaleiti-Bústaðir | 20.5 |
| 10 | 10 Grafarholt-Ulfarsárdalur | 17.8 |
| 11 | 8 Grafarvogur | 16.0 |
From city districts to whole continents: Iceland's 77,2262 immigrants were born in 1862 different countries and territories. 55,9412 of them were born in Europe (72.4%), about 11,8162 in Asia, 5,6002 in the Americas and 2,8322 in all of Africa.
Immigrant age, sex and length of stay
The immigrant population is young and working-age. More than half, 52.8%1, are aged 15–39, against 36.1%1 of the total population; only 4.4%1 of immigrants are 65 or older, against 16.2%1 of everyone. Looked at the other way, immigrants make up 28.7%1 of all 15–39-year-olds in the country, but 6.6%1 of the under-15s and 5.3%1 of the over-65s. The median immigrant is aged 36, a year younger than the median resident (both our calculation from single-year ages). Men outnumber women among immigrants, 54.0%1 to 46.0% - in 1996 the split was the opposite, 37.8% men.
Length of stay shows a population putting down roots. 21,1346 immigrants, 27.4%6, have lived in Iceland for 11 years or more, and only 12.0%6 arrived within the last year - in 2016 nearly one in seven was under a year in the country.
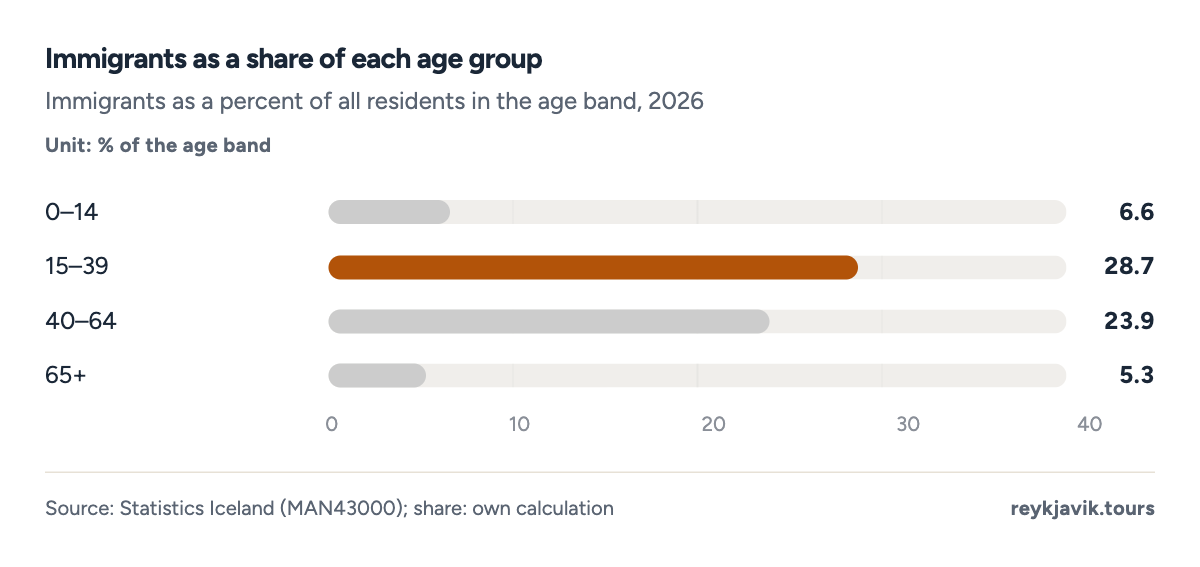
- Immigrants are 28.7% of all 15–39-year-olds.
- Only 5.3% of residents 65+ are immigrants.
- 0–2 years24,24531.4%
- 3–5 years15,02219.5%
- 6–10 years16,82521.8%
- 11+ years21,13427.4%
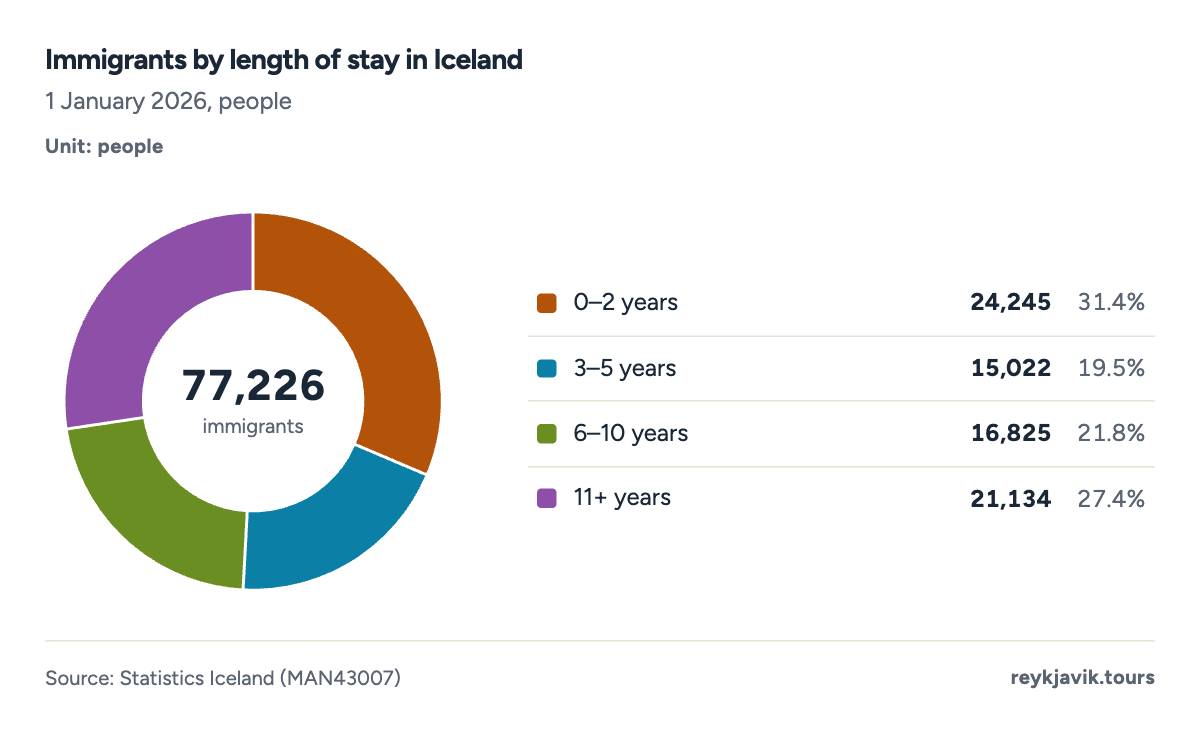
- 27.4% have lived in Iceland for 11+ years.
- 12.0% arrived within the last year.
| Under 1 year | 3,846 | 13.0 | 9,294 | 12.0 |
| 1–2 years | 4,166 | 14.1 | 14,951 | 19.4 |
| 3–5 years | 3,302 | 11.2 | 15,022 | 19.5 |
| 6–10 years | 9,482 | 32.1 | 16,825 | 21.8 |
| 11+ years | 8,750 | 29.6 | 21,134 | 27.4 |
Iceland among Europe's immigrant countries
For all the change, Iceland is not an outlier in Europe - it is upper-middle. On 1 January 2025, 21.83%7 of its residents were born abroad, the 8th highest foreign-born share of the 31 countries in Eurostat's table, far behind Luxembourg (51.5%) but ahead of Norway (18.7%7), Denmark (14.4%7) and Finland (10.0%7); Sweden sits just above at 20.8%. Among foreign citizens the Nordic race is tighter: Iceland passed Norway in the early 2020s and Statistics Iceland's own count puts it at 17.9% in 2026, against Norway's 11.5%, Sweden's 7.9% and Finland's 7.3% in 2025. Denmark's harmonised series ends in 2022, at 9.6%.
- Iceland
- Norway
- Sweden
- Finland
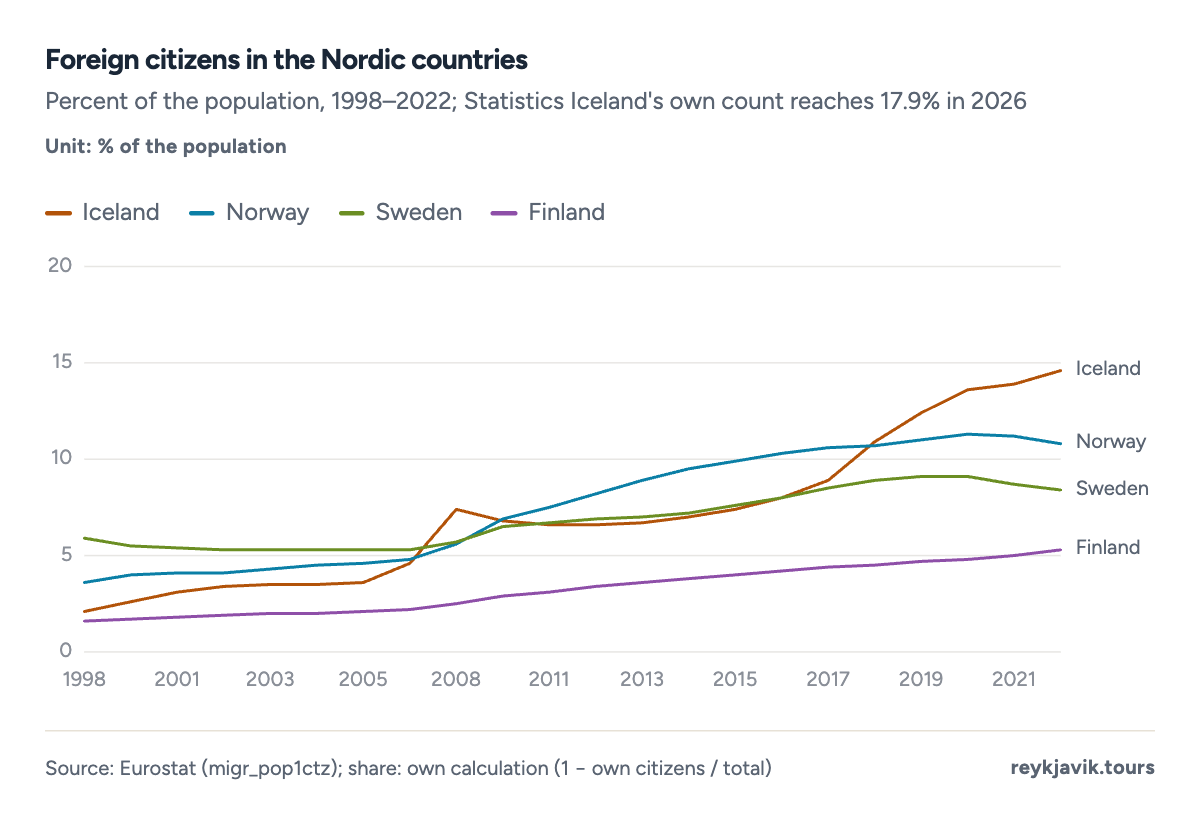
- Iceland's foreign-citizen share passed Norway's around 2021.
- Sweden and Finland stayed between 4% and 8%.
| 1 | Liechtenstein | 70.2 | 40,886 |
| 2 | Luxembourg | 51.53 | 681,973 |
| 3 | Malta | 32.0 | 574,250 |
| 4 | Switzerland | 31.71 | 9,051,029 |
| 5 | Cyprus | 27.55 | 982,966 |
| 6 | Ireland | 23.29 | 5,440,278 |
| 7 | Austria | 22.5 | 9,197,213 |
| 8 | Iceland | 21.83 | 389,444 |
| 9 | Sweden | 20.77 | 10,587,710 |
| 10 | Germany | 20.52 | 83,577,140 |
| 11 | Sweden | 20.77 | 10,587,710 |
| 12 | Norway | 18.69 | 5,594,340 |
| 13 | Denmark | 14.39 | 5,992,734 |
| 14 | Finland | 10.04 | 5,635,971 |
Registers record origin, citizenship and congregation; they say nothing about language, identity or daily life. The next sections cover the questions the registers cannot answer, with the nearest official or labelled numbers that exist.
How many people celebrate Christmas in Iceland?
No survey counts Christmas-celebrating households, so the register of religious and life-stance organizations is the official proxy. It shows 265,0448 people - 67%8 of the population - registered in Christian congregations, and Christmas is a public holiday whose Icelandic traditions (the 13 Yule Lads, Christmas Eve dinner, midnight mass) reach well beyond the registered. The National Church alone counts 222,0128 members, 56.3%8 of the population, down from 89.9% in 1998. 30,2578 residents (7.7%) belong to no organization at all, and 81,5938 - one in five - sit under "other and not specified", mostly foreign citizens the register does not place.
How many Jewish people live in Iceland?
The Jewish Community of Iceland had 768 registered members in 2026. Iceland's other non-Christian communities are also small but growing: the four Muslim associations together count 2,1398 members (0.5% of the population), and the two Pagan associations, practising the Old Norse Ásatrú, count 6,1908 (1.6%) - more than Muslims, and the largest non-Christian group after the ethical humanists (6,3878).
- National Church (Evangelical Lutheran)222,01256.3%
- Independent Christian congregations43,03210.9%
- No religious organization30,2577.7%
- Other religions and unspecified99,02325.1%
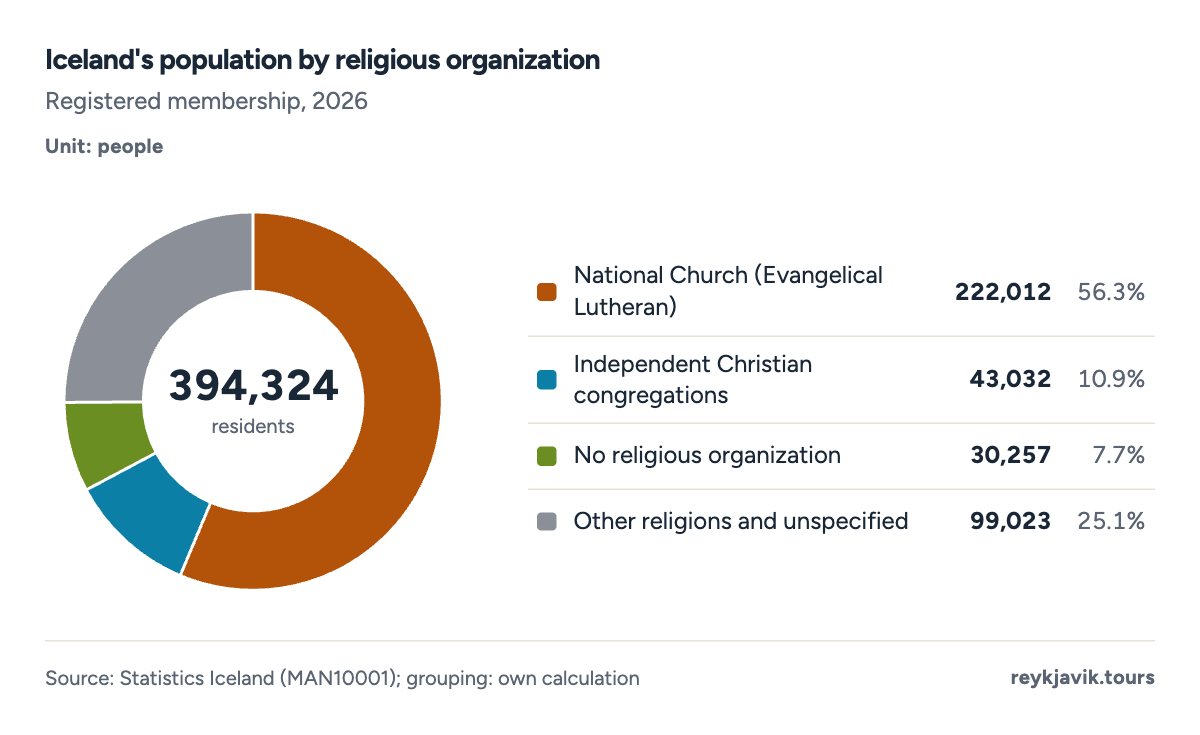
- 56.3% belong to the National Church.
- 7.7% belong to no organization.
Projection: linear trend of 1998–2026 yearly values, 95% prediction range. Our calculation, not a forecast.
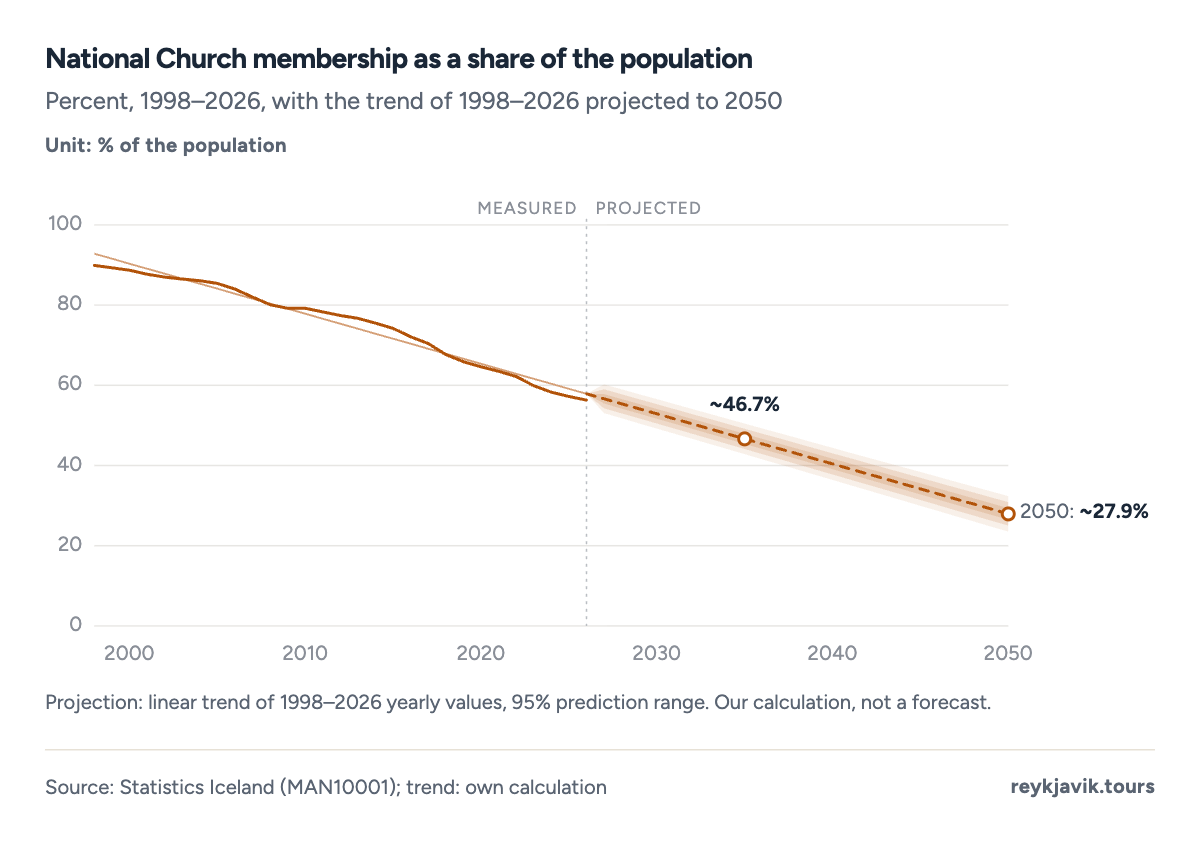
- The National Church's share fell from 89.9% to 56.3%.
| National Church (Evangelical Lutheran) | 222,012 | 56.3 |
| Roman Catholic Church | 15,558 | 3.9 |
| Other Christian congregations | 27,474 | 7.0 |
| Muslim associations (4) | 2,139 | 0.54 |
| Pagan associations (2) | 6,190 | 1.6 |
| Ethical Humanist Association | 6,387 | 1.6 |
| Other religions | 2,714 | 0.69 |
| No religious organization | 30,257 | 7.7 |
| Other and not specified | 81,593 | 20.7 |
| Total population | 394,324 | 100% |
Languages in Iceland: Icelandic and English
Icelandic is "the official language in Iceland" by law - Act No. 61/2011 - and it is the language of school, government and nearly all daily life. It is also one of Europe's smallest language communities: the number of people who speak Icelandic worldwide is essentially the population that speaks it natively, on one island of 394,3241 residents plus a diaspora of tens of thousands, and it has no official count of its own. For a country this size, the more striking register fact is the number of origin countries behind the population: residents of Iceland were born in 1862 different countries and territories, so the languages spoken in the country run well beyond Icelandic, Danish and English - Polish is the largest language group by birthplace after Icelandic. An official answer to how many languages are spoken in Iceland does not exist.
On the Iceland English speaking percentage question the honest answer is the same: there is no official count. The best evidence is a University of Iceland telephone survey from 2011, which found that 86%9 of Icelanders hear English every day and 65%9 hear it for more than an hour a day - a level of passive exposure few countries match, driven by subtitled television (one private channel broadcast entirely in English) and the internet. English is a compulsory subject from primary school, alongside Danish.
What percentage of Iceland speaks Icelandic?
Again no register counts it. What is known: the 304,7952 residents born in Iceland (77.3%) grow up with Icelandic as the default language, the state teaches it to immigrant adults free of charge, and the roughly 77,2262 immigrants overwhelmingly arrive speaking something else. Icelandic is therefore spoken natively or fluently by the large majority of residents - but a precise percentage is not published, and this page will not invent one.
LGBT residents in Iceland
No Icelandic figure answers the Iceland LGBT population percentage question: nothing in the population register records sexual orientation or gender identity beyond a binary/legal sex field, and no official survey publishes a share. The nearest official number is small but concrete: 23010 people were registered as non-binary or other out of 396,500 residents at the end of June 2026 - 0.06% - which measures who has changed an administrative registration, not who is LGBT. What international comparisons do measure is acceptance: ILGA-Europe's Rainbow Map 2026 ranks Iceland 3rd of 4911 European countries with a score of 86%11, and the Williams Institute's Global Acceptance Index puts Iceland among the five most accepting12 of 174 countries. Same-sex marriage has been legal since 2010, and Iceland's prime minister from 2009 to 2013, Jóhanna Sigurðardóttir, was the world's first openly gay head of government.
Blonde hair, blue eyes and red hair
Searchers often ask the ethnic-composition question through appearance. The genetics are genuinely Norse-and-Celtic: studies of Icelandic DNA consistently show ancestry split between Scandinavia and the British Isles, the two source regions of the settlement era. For the percentages, the only compiled figures are aggregator estimates, not official statistics: World Population Review puts the percentage of natural blonde hair in Iceland at about 70%13 (2016 estimates, alongside Finland 80% and Sweden 78%), and the Iceland blue eyes percentage at roughly 90%13 - an estimate with no census behind it, since no one counts eye colour. The percentage of redheads in Iceland is estimated at 6.93%14, second in the world behind the United Kingdom's 8.44%, which fits the Celtic side of the ancestry. Treat all three as rough external estimates; the official composition of Iceland is the origin register above.
What the numbers mean
Iceland's composition has changed faster than any other Nordic country's, and the register shows where the pressure lands. Immigrants are 28.7%1 of everyone aged 15–39 - the ages that staff the tourism, construction and fish-processing industries - but only 5.3%1 of the over-65s, so pensions and schools meet very different populations. Whole towns now run on foreign-born majorities in all but name: one in three residents of the Reykjanes towns, and nearly two in three of Vík's municipality. The language question runs the other way: a country where 86% hear English daily absorbs newcomers in English while the state teaches them Icelandic. And the second generation, 8,3511 children and growing three times faster than the immigrant group itself, will be the first cohort for whom "immigrant background" and "Icelander" are the same thing.
Conclusions
- Iceland is still one of Europe's most homogeneous countries, but only just: 70.9% of residents have no foreign background, down from 93.7% in 1996, and the foreign-background share (21.7%) has doubled since 2011.
- The change is migration-driven and recent: immigrants went from 2.0% of the population in 1996 to 19.6% in 2026, and more than half of that increase came after 2016.
- The race questions have no official answers, and the proxies say so: about 0.6% of residents were born in Sub-Saharan Africa or the Caribbean, while 72.4% of immigrants were born in Europe - the "white share" some searchers want is a stacking exercise, not a statistic.
- Composition now varies more by postcode than by decade: Breiðholt in Reykjavík is 39.6% immigrant while Grafarvogur is 16.0%, and Vík's municipality is 64.0% - higher than any Nordic capital region.
Methodology
- Origin 1996–2026
- Foreign citizens 1950–2026
- 63 municipalities
- Checked Sept 16, 2026
Definition. Origin groups follow Statistics Iceland: an immigrant is born abroad with parents and grandparents born abroad; a second-generation immigrant is born in Iceland to two immigrant parents. Foreign background = immigrants + second generation. Race is not recorded in any Icelandic register.
Data sources. Origin, birthplace, citizenship, naturalization, municipality, district, length-of-stay, age and religion data from Statistics Iceland's PX tables;[^px_origin][^px_birth][^px_citizens][^px_nat][^px_places]8 the non-binary registration from Statistics Iceland's quarterly release;10 European comparisons from Eurostat;7 the CIA World Factbook ethnicity note;3 the English-exposure study from the University of Iceland;9 hair and eye colour estimates from World Population Review (aggregator, labelled);[^wpr_blonde]14 the Icelandic language act;15 and ILGA-Europe11 and the Williams Institute12 on LGBT acceptance.
Calculations. Municipality immigrant shares divide MAN43005 immigrants by MAN02005 population. Continent-of-birth totals map MAN43004's 211 birth countries to continents (work/analyze.py). Nordic foreign-citizen shares are 1 minus own citizens over total population from Eurostat migr_pop1ctz. Christian membership groups MAN10001 organizations by name. Median ages and age-band shares are calculated from single-year ages. Trend projections are least-squares lines with a 95% prediction range.
Limitations. Iceland collects no data on race, self-identified ethnicity, languages spoken or sexual orientation; every figure answering those questions is a labelled proxy. Eurostat's harmonised series for Iceland ends in 2022 and Denmark's in 2022. Blonde-hair, blue-eye and redhead percentages are aggregator estimates without a primary source. The religion register records organization membership, not belief or celebration.
Sources
- Statistics Iceland (Hagstofa Íslands). “Population by origin, sex and age 1996–2026 (MAN43000).” Statistics Iceland. px.hagstofa.is. Accessed 16 Sept. 2026. Back to text
- Statistics Iceland. “Population born abroad by background and country of birth 1996–2026 (MAN43004); population by country of birth (MAN12103).” Statistics Iceland. px.hagstofa.is. Accessed 16 Sept. 2026. Back to text
- Central Intelligence Agency. “Iceland - People and Society (The World Factbook, Ethnic groups: data represent population by country of birth).” CIA. cia.gov. Accessed 16 Sept. 2026 (text as mirrored 2024). Back to text
- Statistics Iceland. “Population by country of citizenship 1998–2026 (MAN04103) and foreign citizens 1950–2026 (MAN04001).” Statistics Iceland. px.hagstofa.is. Accessed 16 Sept. 2026. Back to text
- Statistics Iceland. “Acquisition of Icelandic citizenship by former citizenship 1991–2025 (MAN04119).” Statistics Iceland. px.hagstofa.is. Accessed 16 Sept. 2026. Back to text
- Statistics Iceland. “Immigrants by municipality (MAN43005), population by municipality (MAN02005), immigrants in Reykjavík by districts (MAN43006), immigrants by length of stay (MAN43007).” Statistics Iceland. px.hagstofa.is. Accessed 16 Sept. 2026. Back to text
- Eurostat. “Population on 1 January by country of birth (migr_pop3ctb) and by citizenship (migr_pop1ctz), 2025 release.” European Commission, 10 Aug 2026. ec.europa.eu. Accessed 16 Sept. 2026. Back to text
- Statistics Iceland. “Populations by religious and life stance organizations 1998–2026 (MAN10001).” Statistics Iceland. px.hagstofa.is. Accessed 16 Sept. 2026. Back to text
- Arnbjörnsdóttir, Birna. “Exposure to English in Iceland: A Quantitative and Qualitative Study (MA thesis).” University of Iceland (Skemman), 2011. skemman.is. Accessed 16 Sept. 2026. Back to text
- Statistics Iceland. “The population grew by 1,450 in the second quarter of 2026.” Statistics Iceland, 31 July 2026. statice.is. Accessed 16 Sept. 2026. Back to text
- ILGA-Europe. “Rainbow Map 2026.” ILGA-Europe, May 2026. rainbowmap.ilga-europe.org. Accessed 16 Sept. 2026. Back to text
- Williams Institute, UCLA School of Law. “Iceland, the Netherlands and Norway have the highest levels of LGBT acceptance (Global Acceptance Index).” UCLA. williamsinstitute.law.ucla.edu. Accessed 16 Sept. 2026. Back to text
- World Population Review (aggregator). “Blonde Hair Percentage by Country (2016 estimates).” World Population Review. worldpopulationreview.com. Accessed 16 Sept. 2026. Back to text
- World Population Review (aggregator). “Percentage of Redheads by Country.” World Population Review. worldpopulationreview.com. Accessed 16 Sept. 2026. Back to text
- Alþingi (the Icelandic Parliament). “Act on the Icelandic Language, No. 61 of 2011.” Alþingi. althingi.is. Accessed 16 Sept. 2026. Back to text
About the author
Laufey turns public statistics on tourism and travel into research people can check and cite.
Every figure on this page links to its source. How we research
Related research
More data on Iceland's weather and travel from Reykjavik Tours.
- SocietyHow Many People Live in Iceland? (2026 Data)396,500 people living in IcelandRead the research →
- SocietyWhat Is the Biggest City in Iceland? (2026 Data)140,470 residents of Reykjavík, Iceland's biggest cityRead the research →
- SocietyIceland Average Height for Men and Women (2026 Data)5 ft 11 in average height of young Icelandic menRead the research →