M.Sc. in Atmospheric Sciences, University of Iceland (Háskóli Íslands), with a minor thesis on North Atlantic storm-track variability
Former research assistant at the Icelandic Meteorological Office (Veðurstofa Íslands), working on subarctic climate modeling and volcanic-ash dispersion forecasting
B.A. in Sociology, also from the University of Iceland, with fieldwork on rural depopulation and tourism's impact on small fishing communities (Westfjords focus)
Grew up in Akureyri, spent seven years living in Reykjavík and two in a small village in the Westfjords - brings first-hand experience of Iceland's regional weather extremes and community life
Fluent in Icelandic and English; has translated Icelandic Met Office public advisories for international outlets
Published field notes and data-driven pieces on glacier retreat (Vatnajökull), aurora forecasting, and the socioeconomic effects of overtourism in the Golden Circle
M.A. in Journalism, University of Iceland, with additional coursework in Environmental Communication at the University of Bergen (Norway), giving a comparative Nordic lens
12+ years in Icelandic media, including editorial roles at RÚV (Iceland's national broadcaster) covering weather-related public safety reporting (storms, volcanic eruptions, road closures)
Former fact-checking lead for a travel-and-culture desk, specializing in verifying tourism statistics, safety advisories, and climate data against primary sources (Vedur.is, Statistics Iceland)
Has overseen editorial standards for bilingual (Icelandic/English) publications, ensuring both cultural nuance and accuracy for international readers
Advocate for citing primary sources (Icelandic Met Office, Icelandic Tourist Board / Ferðamálastofa) rather than secondhand reporting
Key findings
90%About 90% of Iceland's primary energy use is renewable, led by geothermal at 70% (2020).
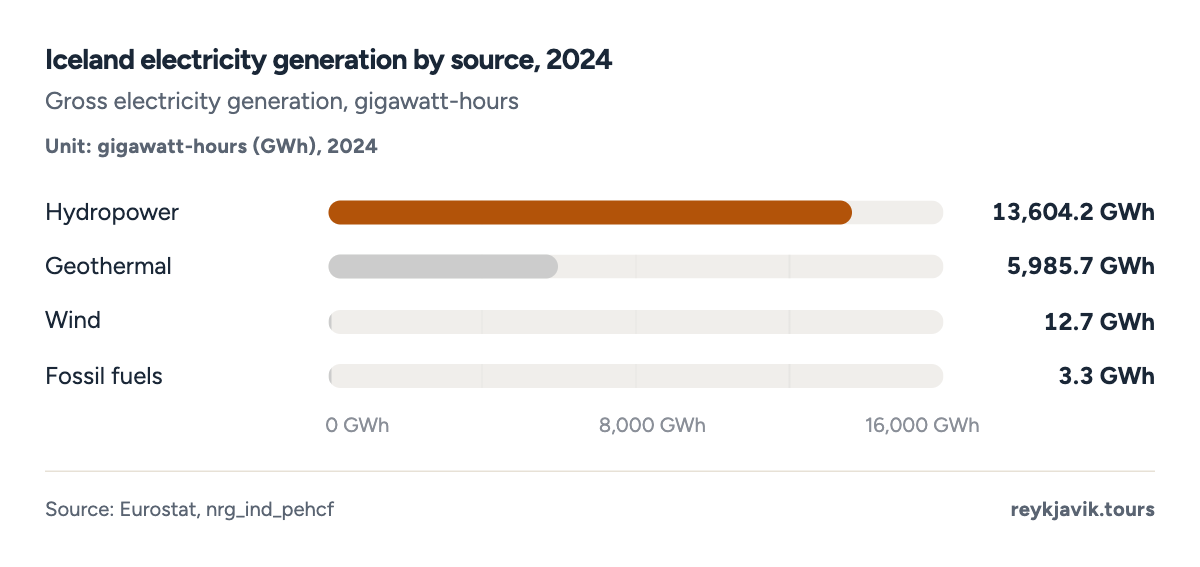
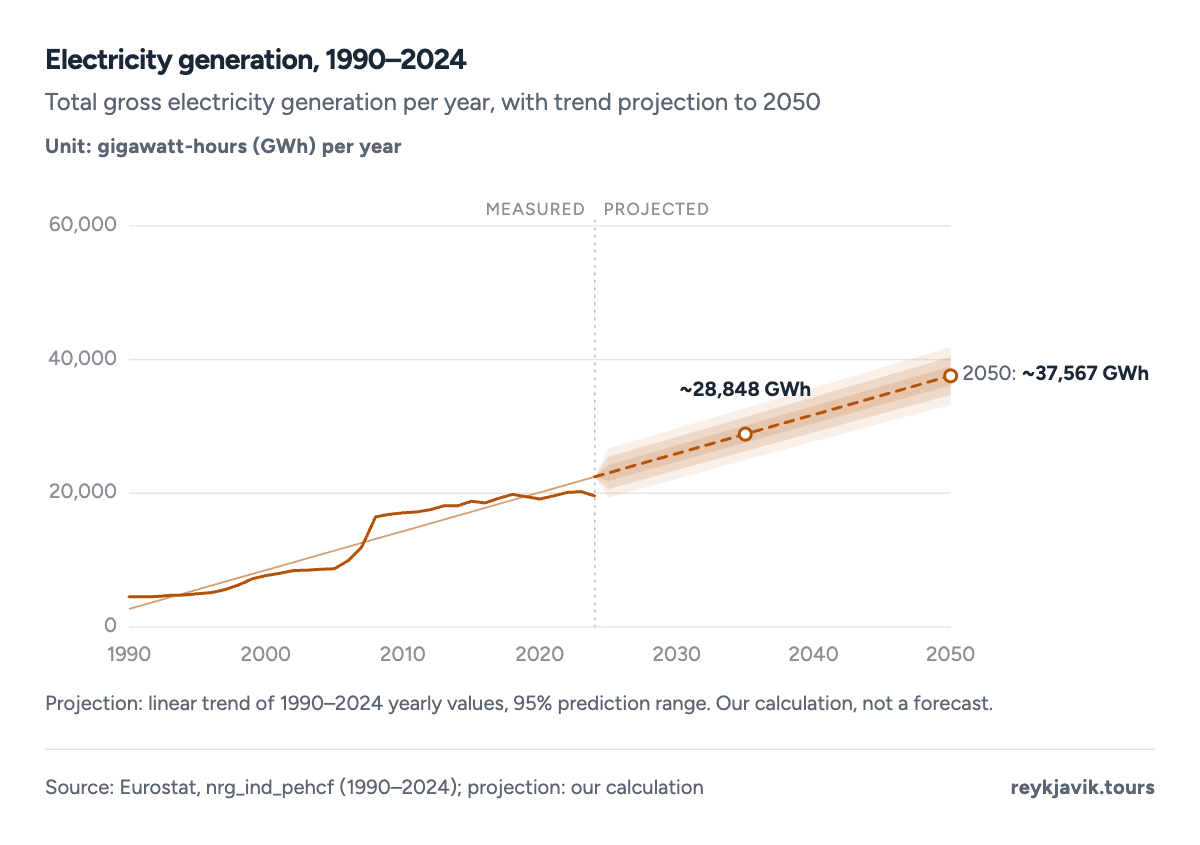
99.98%In 2024, 99.98% of Iceland's electricity came from renewable sources - 19,606 GWh in total.
70.4%Geothermal energy supplies 70.4% of Iceland's primary energy, the highest share on Earth.
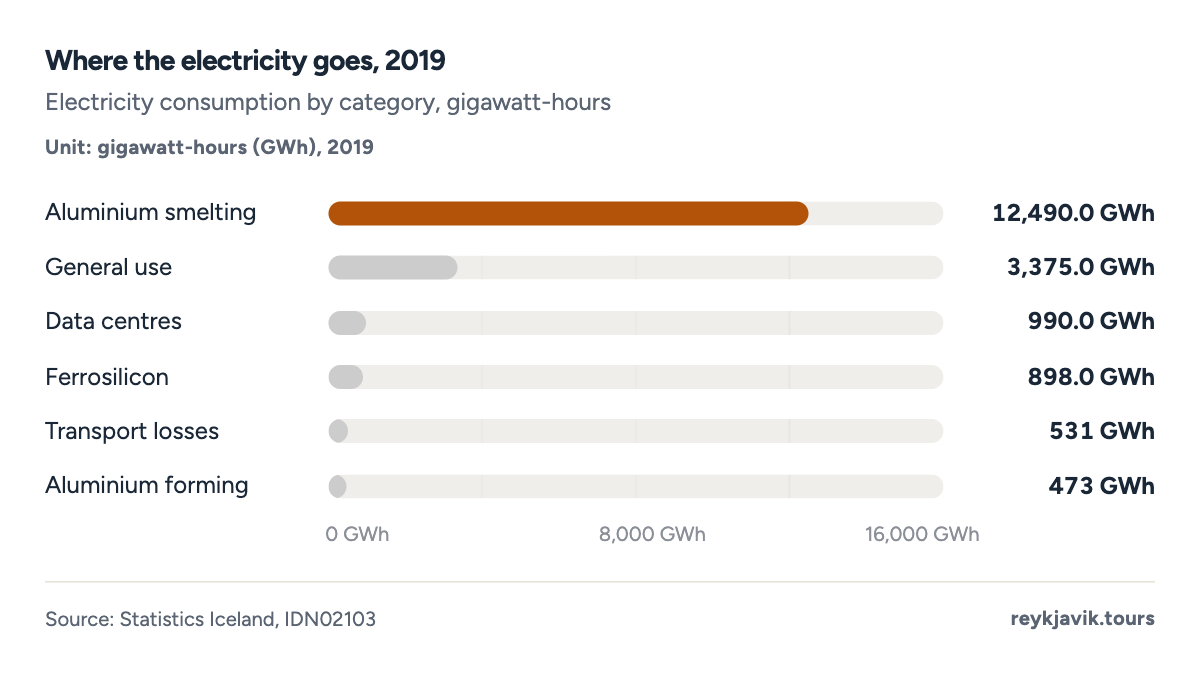
64%Aluminium smelting consumes 64% of Iceland's electricity - 12,490 GWh in 2019.
51.1 MWhIcelanders use 51.1 MWh of electricity per person per year, the world's highest figure.
Iceland is the closest thing on Earth to a fossil-free economy. About 90%1 of the primary energy the country uses is renewable, 99.98%2 of its electricity flows from hydro, geothermal and wind, and the hot water that heats nine in ten homes comes straight from volcanic ground. It was not always so: in 1940, 69.6%1 of the country's energy was imported coal, and homes in Reykjavík were heated by oil furnaces.
This page assembles the full picture from official sources - Orkustofnun's 80-year energy balance, Eurostat's electricity statistics and Statistics Iceland's usage tables: the headline percentages, the 1940–2020 transition, the plants behind the numbers, who actually consumes the electricity, and the one sector where fossil fuel still rules.
How much renewable energy does Iceland use?
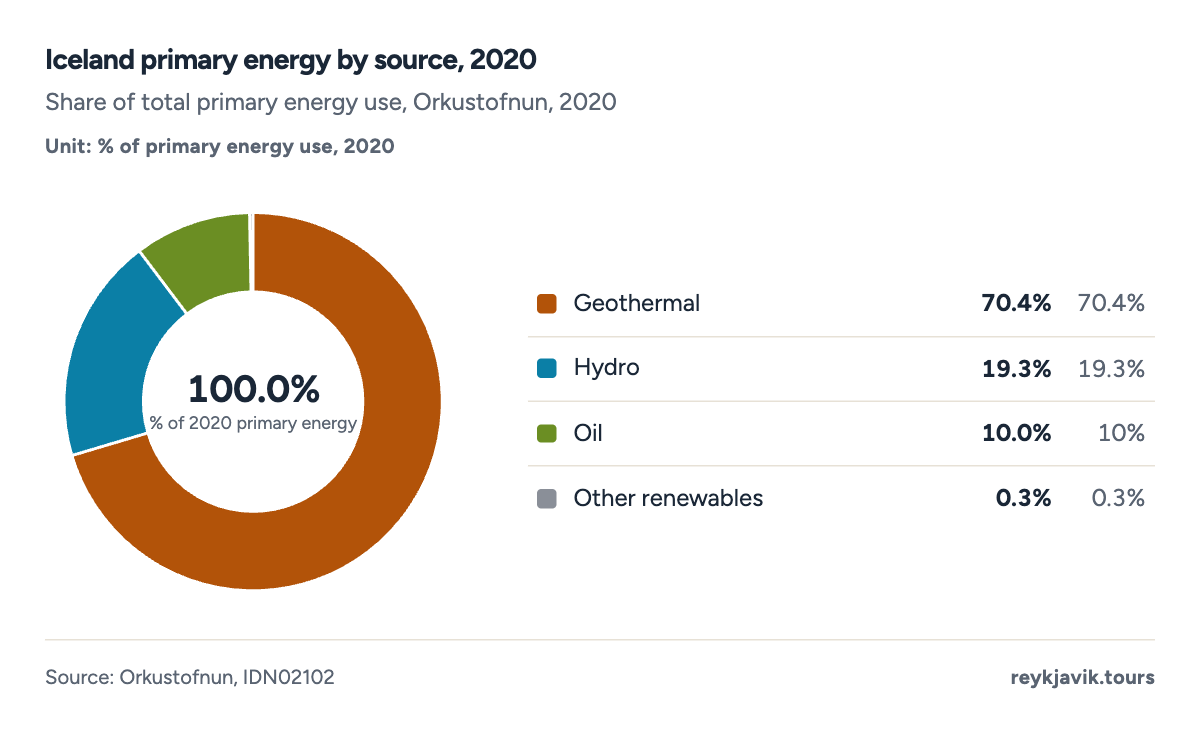
The headline Iceland renewable energy sources percentage is 90.0%1 of primary energy use in 2020 - the latest year of Orkustofnun's long-run energy balance. The mix behind that number: 70.4%1 geothermal, 19.3%1 hydropower, and small contributions from biofuel and the country's first wind farms; the remaining 10.0%1 is almost entirely imported oil for ships, aircraft and vehicles.
Three official numbers describe the same energy system, and each answers a different question:
Primary energy (Orkustofnun): 90.0%1 renewable in 2020.
Electricity (Eurostat): 99.98%2 renewable in 2024.
Gross final energy, EU definition (Eurostat): 79.3%3 renewable in 2024.
The 10.7-point gap between the primary and final-energy figures is not a contradiction - it is mostly transport. The EU measure counts petrol, diesel and aviation fuel in the denominator, and Iceland's cars, fishing fleet and aircraft still run on fossil fuel. The electricity grid, by contrast, is effectively carbon-free all year.
Iceland primary energy by source, 2020
Share of total primary energy use, Orkustofnun, 2020
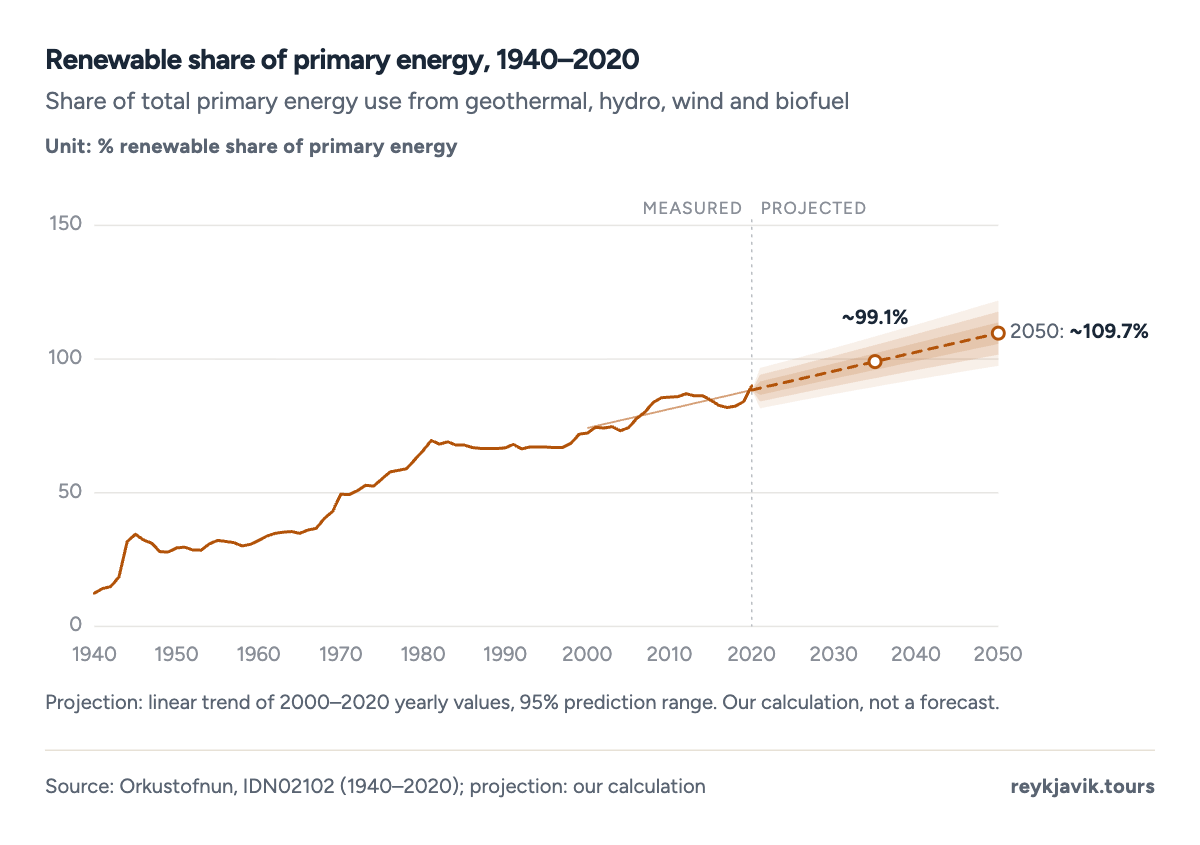
The renewable share rose from 12.4% in 1940 to 90.0% in 2020.
Most of the jump happened between 1965 and 1985, when geothermal district heating replaced oil.
The straight-line trend passes 100% around 2044 - the true ceiling, because ships and aircraft stay on fossil fuel.
From coal to geothermal: 1940–2020
Iceland's energy transition is one of the fastest ever recorded. In 19401, imported coal covered 69.6%1 of primary energy and domestic renewables just 12.4%1. Twenty years later the renewable share had reached 32.2%1; by 1980 it was 65.7%1; by 2020, 90.0%1.
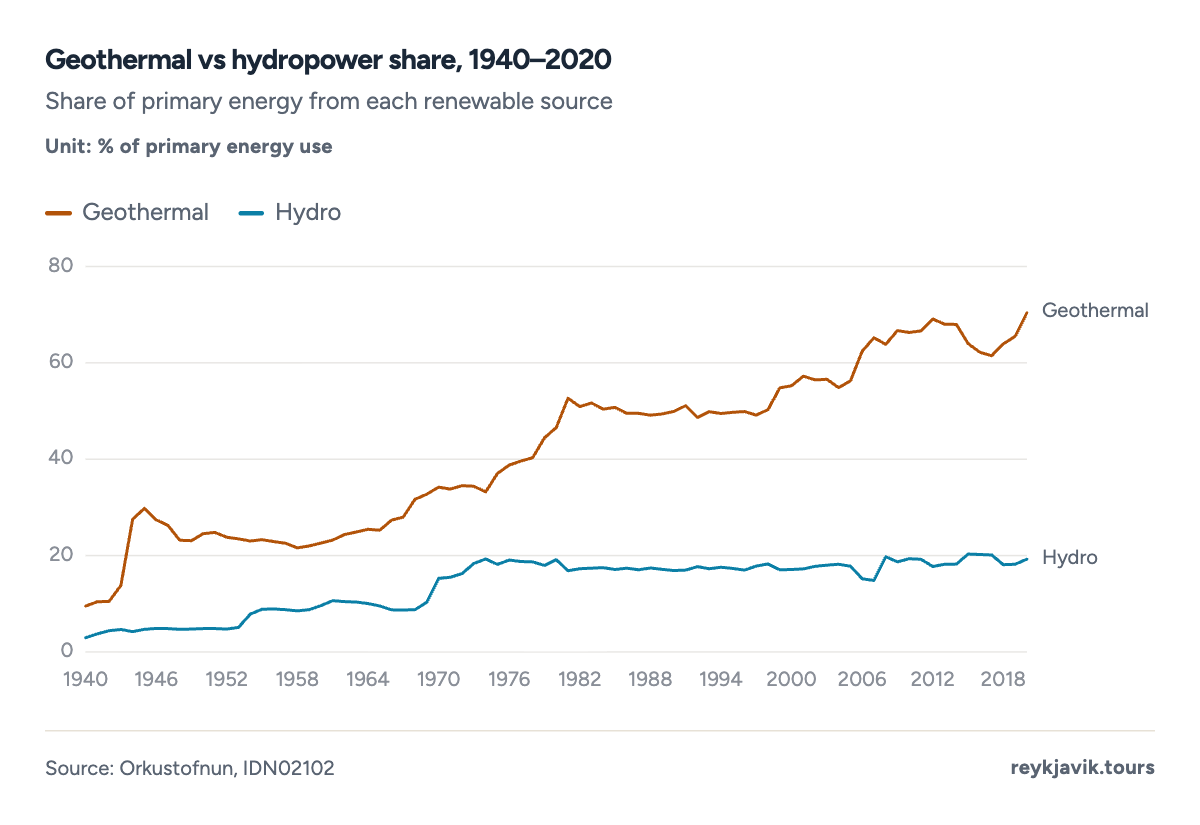
The switch had two engines. First, hydropower grew steadily from the first 0.01 MW4 plant in 1904 into a national grid. Second, and more dramatic: the oil crises of the 1970s pushed the government to finance geothermal district heating in every town - a programme so successful that geothermal overtook oil as the main heating source within a decade5. Coal vanished from the energy balance entirely: the last year with any recorded coal use was 20191, a rounding error of what it once was.
Peat, which heated turf farms for centuries, disappeared even earlier - its last appearance in the statistics is 19451. What remains of fossil energy is oil, and its share keeps shrinking as the car fleet electrifies.
The speed of the change is worth pausing on. A country that heated its capital with coal smoke in 1940 had, by 1985, an energy system in which renewables were the norm and fossil fuel the exception - a full energy transition completed inside one working lifetime1. Few nations have managed anything similar; most are still at the beginning of that road. The Icelandic case is often studied precisely because it shows what the destination looks like: not a poorer, colder economy, but a larger one, running on a resource it had been standing on all along.
Geothermal vs hydropower share, 1940–2020
Share of primary energy from each renewable source
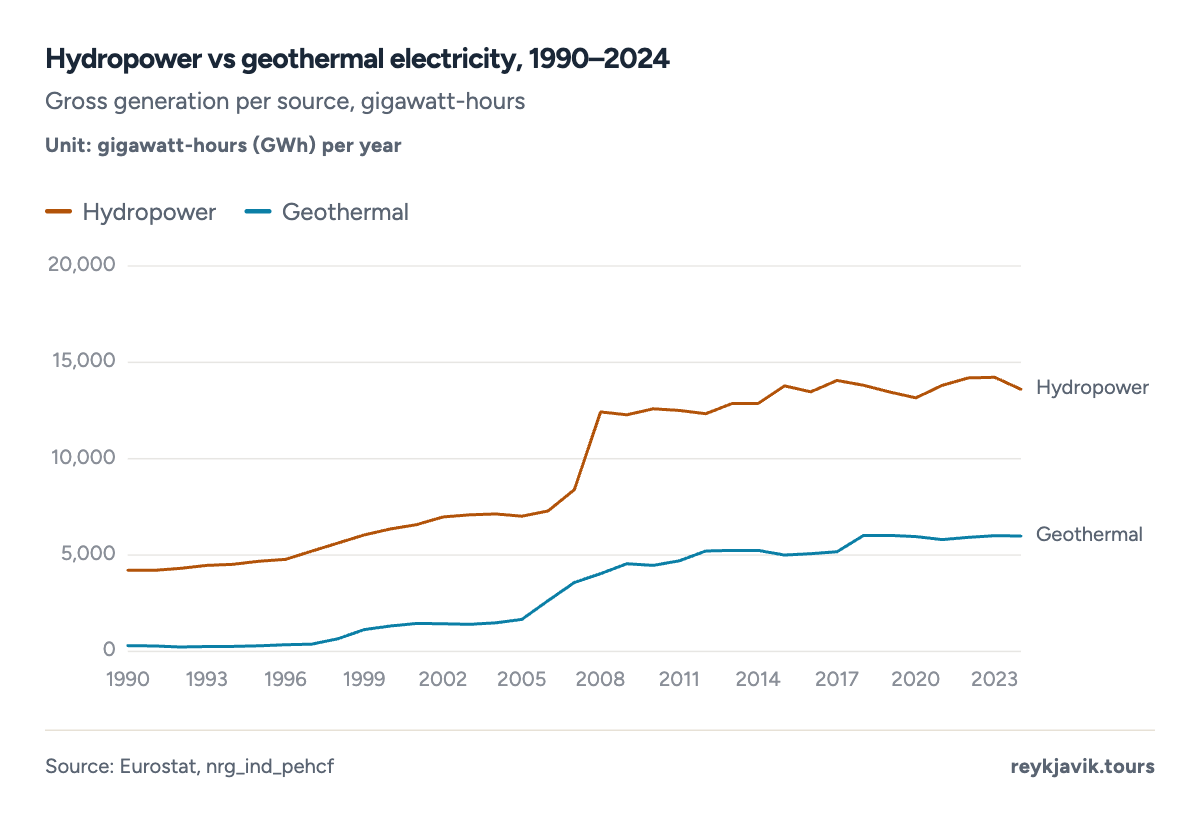
The renewable share of generation has been above 99.8%2 in every year since 1990 - the grid was never significantly fossil. Even in 1990, when geothermal generation was only 300 GWh2, hydropower kept the renewable share at 99.87%2.
Iceland geothermal electricity percentage
Geothermal's share of generation grew from 6.7%2 in 1990 to 30.5%2 in 2024, as high-temperature fields at Nesjavellir, Hellisheiði, Reykjanes and Þeistareykir were harnessed one by one. Geothermal's advantage is stability: it runs at full power through freezing winters and dry summers alike, complementing hydro's seasonal swings.
Wind is the newcomer. The first grid-connected turbines started turning in 20134 (the Hafið and Búrfell test farms), and installed wind capacity reached 72 MW4 by 2019 - small, but growing fast.
So where does all this power actually go? The answer surprises most visitors, and it is the reason Iceland's per-capita numbers look the way they do.
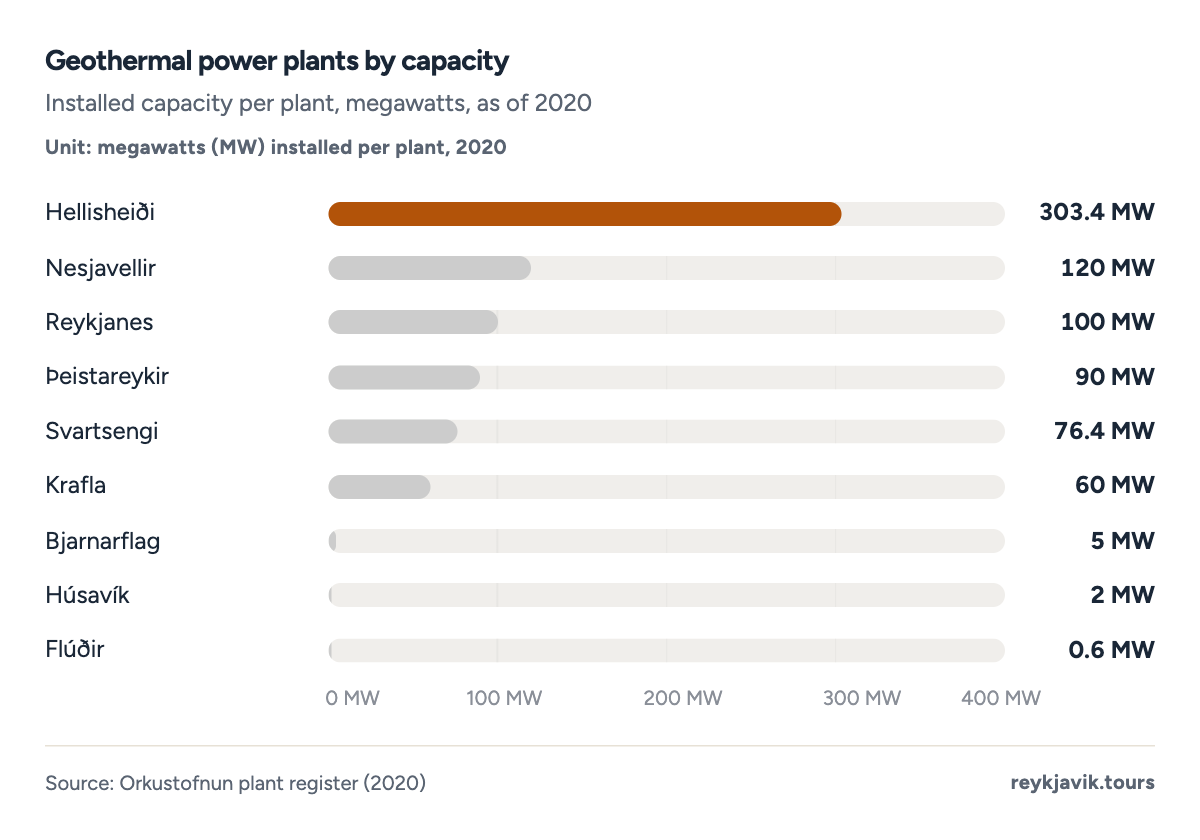
Iceland has 96 operating geothermal power plants with a combined listed capacity of 757.4 MW6 (2020 register). The largest, Hellisheiði, alone delivers 303.4 MW6 - it is one of the largest geothermal plants in the world.
Iceland geothermal energy percentage
Geothermal's share of primary energy - the number most searches call the geothermal percentage - reached 70.4%1 in 2020, the highest such share of any country. Geothermal is Iceland's workhorse twice over: it generates 30.5%2 of electricity and heats the overwhelming majority of buildings.
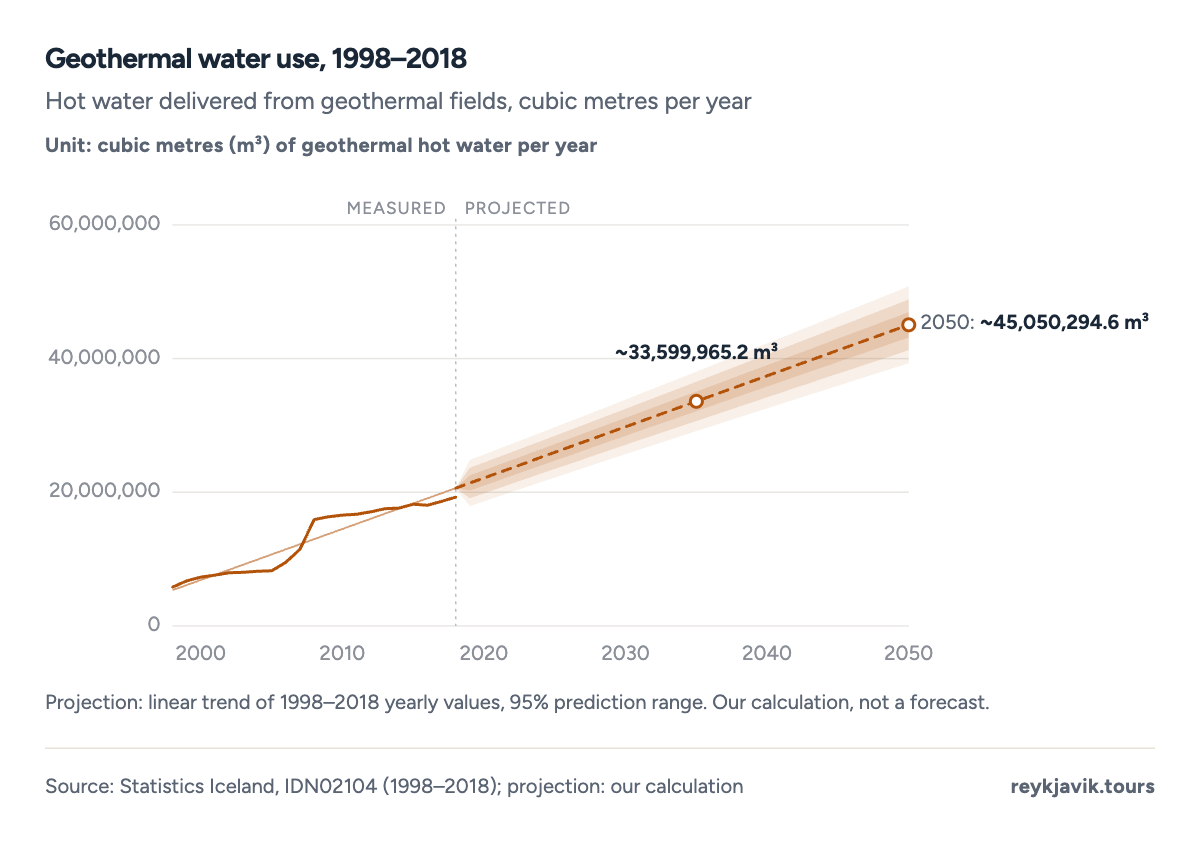
Beyond power and heat, geothermal steam warms greenhouses that grow tomatoes and bananas, dries fish stock, keeps swimming pools at 39 spawning degrees7 - and the total draw of geothermal water tripled from 5.8 million m³7 in 1998 to 19.3 million m³7 in 2018.
Geothermal power plants by capacity
Installed capacity per plant, megawatts, as of 2020
Iceland district heating geothermal percentage: nine in ten homes
About 90%5 of Icelandic homes are heated with geothermal energy through district-heating networks - the outcome of the 1970s programme that converted one town after another from oil furnaces to volcanic heat. Reykjavík alone pipes hot water to more than 100,000 households from the Nesjavellir and Hellisheiði fields5.
The district-heating systems use far more geothermal water than the power plants do: industry and space heating together drew 19.3 million m³7 of hot water in 2018, while services - swimming pools, snow melting and spas - took 1.8 million m³7. This direct use of heat, invisible in electricity statistics, is the quiet backbone of the Iceland renewable energy percentage.
The contrast with the rest of Europe is stark. In most countries, heating a house is either a gas-filed bill or an efficiency project; in Iceland it is a plumbing connection. Reykjavík's streets stay ice-free in winter because hot water runs under the pavement5, the outdoor pools are open at midnight in January, and the domestic hot-water tap has a faint mineral smell that newcomers notice for a week and locals no longer smell at all. Nine in ten homes are heated by a volcano - a sentence that sounds like tourism copy and happens to be official energy statistics5.
Geothermal water use, 1998–2018
Hot water delivered from geothermal fields, cubic metres per year
Unit: cubic metres (m³) of geothermal hot water per year
Projection: linear trend of 1998–2018 yearly values, 95% prediction range. Our calculation, not a forecast.
Who uses 19,606 GWh? Iceland energy use per capita
Iceland generates more electricity per person than any other country: 51.1 MWh8 per inhabitant in 2024 - roughly three times Norway and about fifteen times the world average8. The reason is not profligate households; it is industry.
Aluminium: the giant customer
Aluminium smelters consumed 12,490 GWh9 in 2019 - 64%9 of all electricity generated that year. Ferrosilicon production added another 898 GWh9. Metal smelting is, in effect, Iceland's biggest export of renewable energy - embedded in ingots.
How many data centers are in Iceland?
Commercial registries list about 610 data-centre facilities in Iceland (2025), and Statistics Iceland's electricity table shows computer server farms drawing 990 GWh9 in 2019 - about 5%9 of national generation, more than all the country's farms use. Iceland's cold climate, cheap green power and direct fibre links to Europe and North America make it a natural home for computing; the first wave of centres mined cryptocurrency, the current wave trains AI models10.
General use - every household, shop, office and public building combined - accounted for just 3,375 GWh9 in 2019. Iceland electricity consumption per capita for ordinary life is unremarkable; the headline number is industry-driven. Measured as total primary energy, use reaches roughly 695 GJ1 per person per year (2020) - also among the world's highest8.
There is a scale jump worth making explicit. One aluminium smelter potline uses more electricity than every home in the country combined; one data centre hall can draw as much as a small town. Iceland's energy statistics describe a nation of 383,7268 people, but its energy system was built - and is continuously resized - to serve continental-scale industry that happens to sit on a volcanic island. When a new smelter or server farm connects, national generation jumps in a visible step, which is exactly what the 1990–2024 generation chart shows2.
Where the electricity goes, 2019
Electricity consumption by category, gigawatt-hours
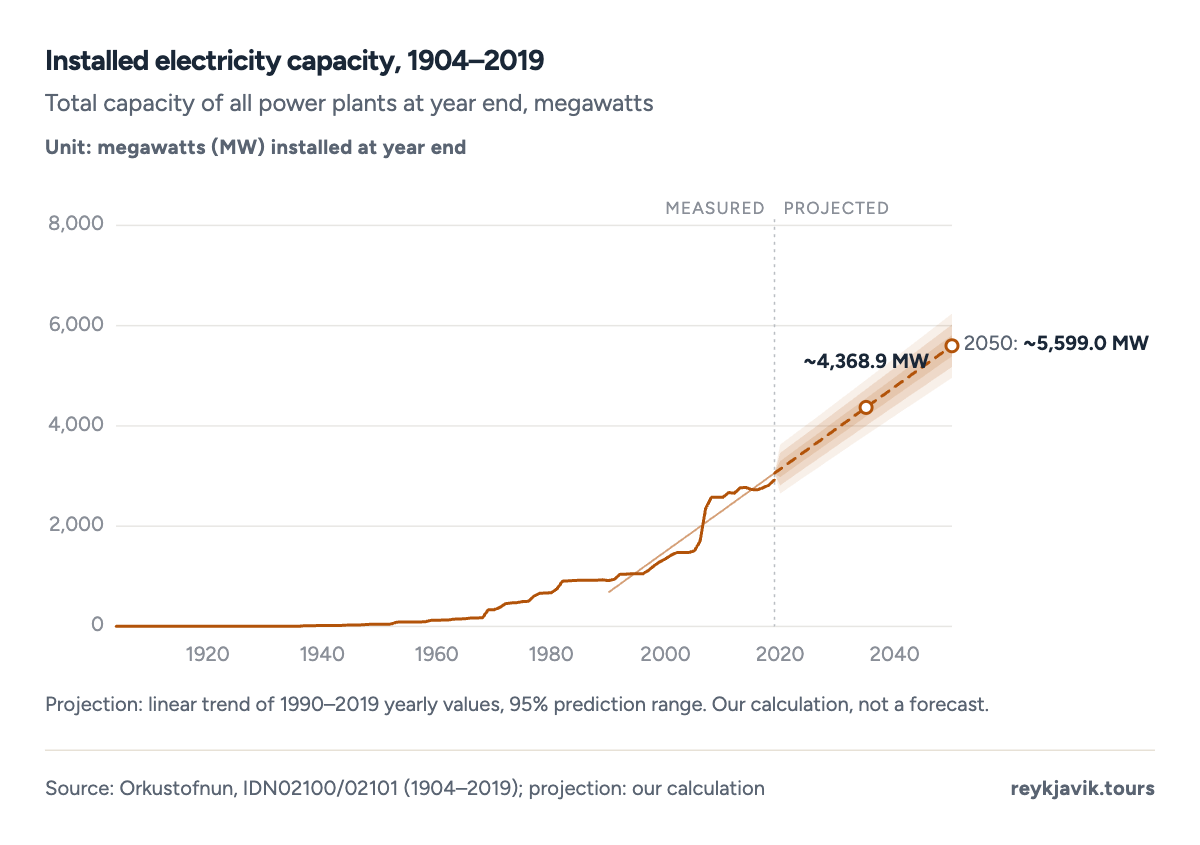
Installed electricity capacity grew from 0.01 MW4 in 1904 to 2,923 MW4 in 2019: hydropower 2,096 MW4, geothermal 753 MW4, wind 72 MW4 and a residual 2.4 MW4 of oil back-up. The Iceland geothermal power capacity total of 753.2 MW sits inside that total, spread across the nine plants listed above.
Kárahnjúkar - officially the Fljótsdalur Power Station - is the largest dam in the country, a 690 MW11 hydropower project in the eastern highlands completed in 2008 to power the Fjarðaál aluminium smelter11. Its reservoir, Hálslón, is the largest lake in Iceland by volume. One dam alone represents nearly a quarter of the country's entire installed capacity, and its story - clean power, heavy industry, contested wilderness - is the story of Iceland's energy economy in miniature.
For a traveller, the engineering is part of the landscape. The ring road crosses spillways and high-tension lines that march across the empty east; the visitor centre at Kárahnjúkar explains how the dam sits in a valley carved by the very glacier that now fills its reservoir. One dam alone represents nearly a quarter of national capacity, and it exists, in the end, to export electricity as metal11.
Installed electricity capacity, 1904–2019
Total capacity of all power plants at year end, megawatts
Unit: megawatts (MW) installed at year end
Projection: linear trend of 1990–2019 yearly values, 95% prediction range. Our calculation, not a forecast.
Iceland's first power plant delivered 0.01 MW in 1904; by 2019 the total was 2,923 MW.
Capacity grew 200-fold between 1950 and 2019.
Where fossil fuels remain
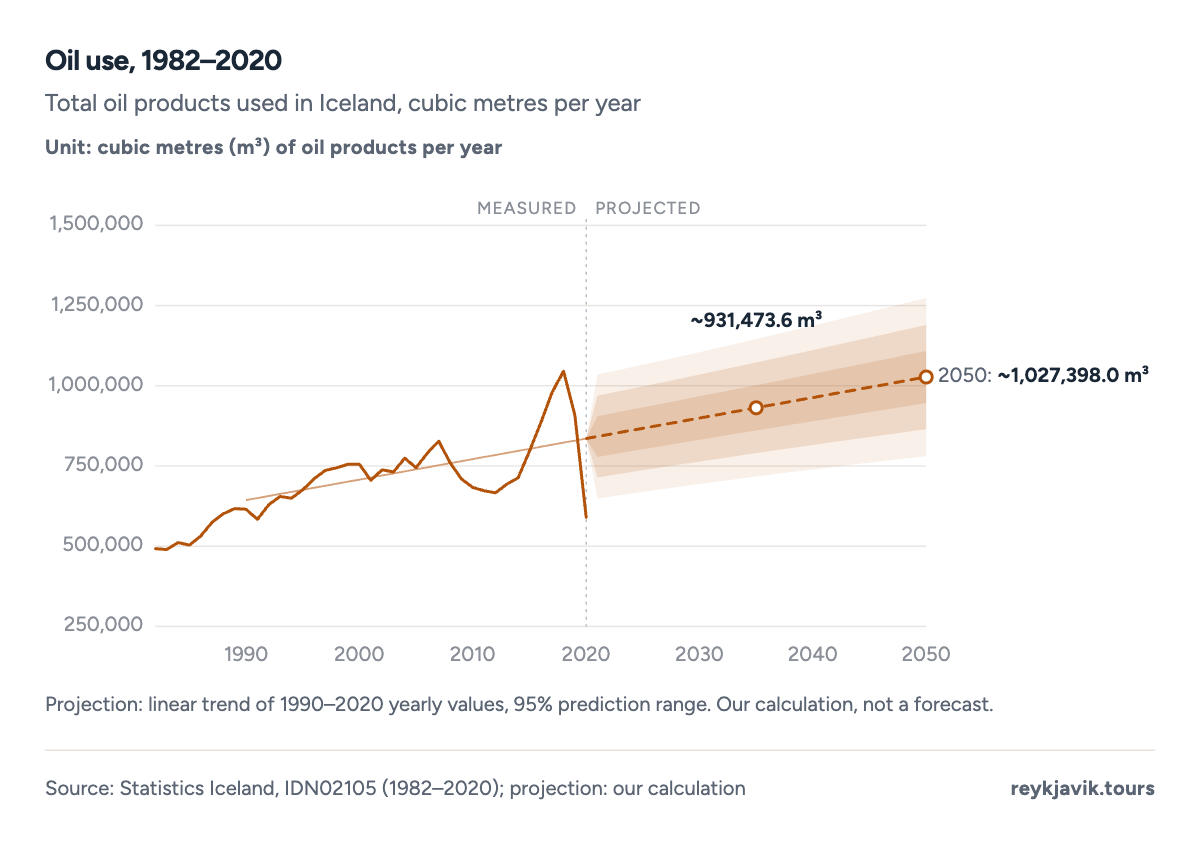
Oil use in Iceland was 590,153 m³12 in 2020 - up from 492,290 m³12 in 1982 but well below its 2000s peak. The split explains why the EU-definition renewable share stays near 79%3 while the primary share reaches 90%: road transport burned 283,851 m³12 (48% of all oil), international aviation and shipping took large shares that never touch the electricity grid, and the fishing fleet - the traditional backbone of the economy - consumed another large slice12.
These are the last strongholds of fossil energy: ships, planes, and the remaining petrol and diesel cars. Each is now shrinking, but at very different speeds.
The stakes are practical, not just statistical. Iceland imports every drop of oil it uses - the annual bill swings with world prices and the króna, and in a bad year it visibly dents the national economy12. Every fishing boat that can some day run on renewable-derived fuel, and every car that switches to the grid, is import spending converted into domestic renewable generation. That is why the electric-car curve in the next section matters more to Iceland than to almost any other country: for most nations EVs shift emissions between sectors, but for Iceland they eliminate them outright, because the electricity they draw is already 99.98% renewable2.
Oil use, 1982–2020
Total oil products used in Iceland, cubic metres per year
Unit: cubic metres (m³) of oil products per year
Projection: linear trend of 1990–2020 yearly values, 95% prediction range. Our calculation, not a forecast.
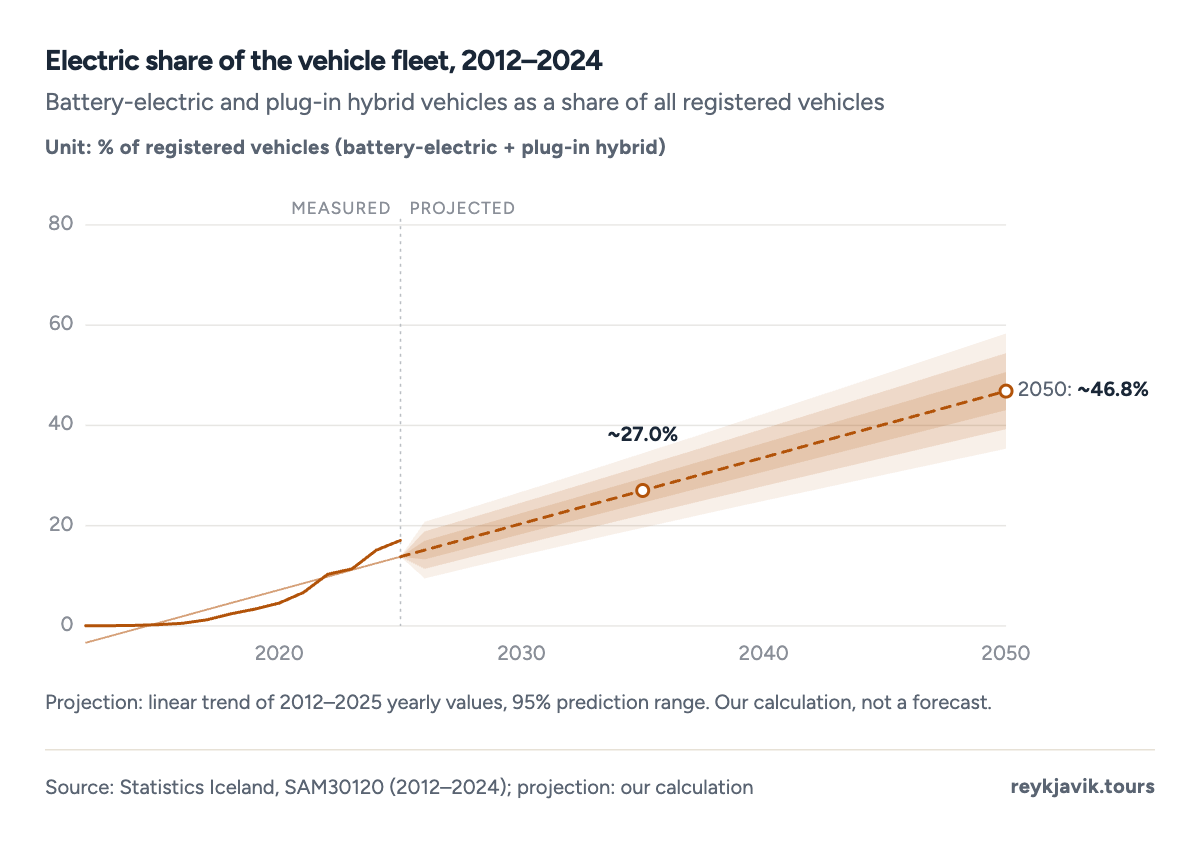
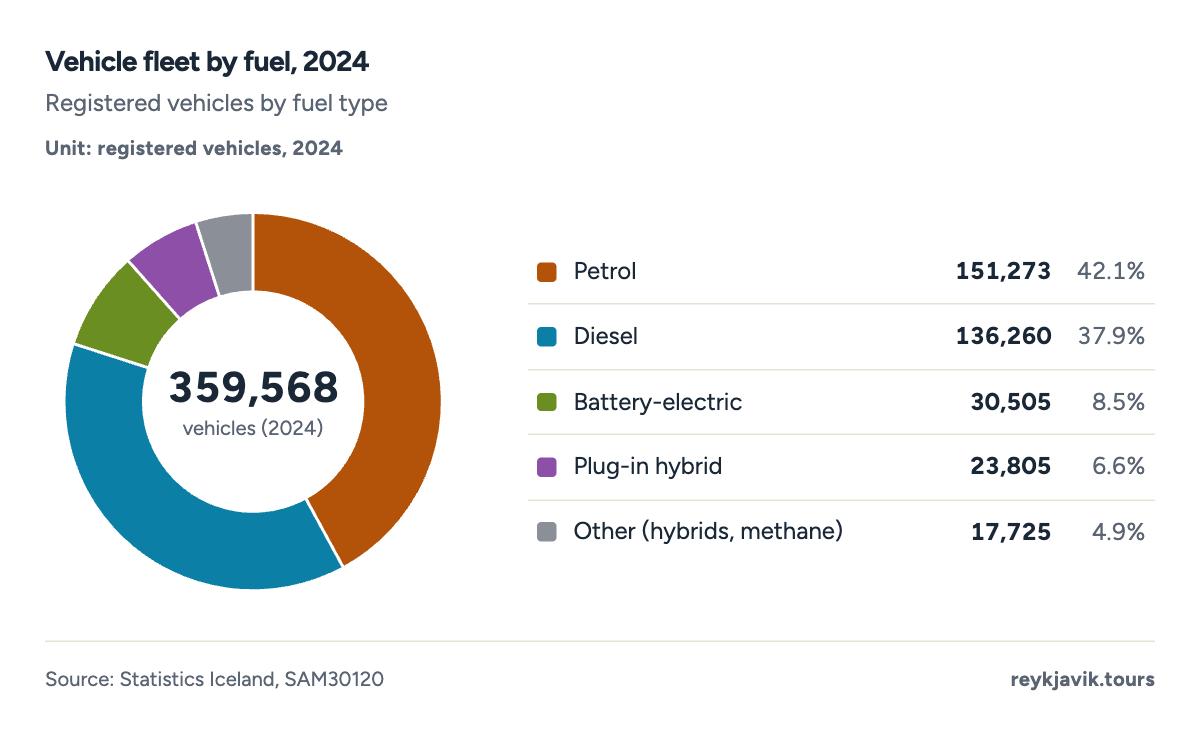
Iceland has one of the fastest vehicle electrification rates in the world. From just 1513 electric cars in 2012, the fleet reached 30,50513 battery-electric vehicles plus 23,80513 plug-in hybrids in 2024 - a combined 15.1%13 of all registered vehicles. Iceland EV adoption per capita stands among the top three markets globally, helped by cheap renewable electricity, high petrol prices and a compact national charging network13.
The consequence for the energy balance is direct: every petrol car replaced by an electric one moves consumption from the oil column - the country's last fossil dependency - onto an already-renewable grid.
The shift has a visible geography. Charging points cluster where tourists drive - the Golden Circle, the south coast, the ring road - because rental fleets turned electric faster than private ownership did. A visitor in 2024 could drive the entire ring road on electricity, a feat that was impractical in 201813. The petrol stations did not close; they added chargers in the forecourt, and the energy flowing through them is now, almost entirely, volcanic.
Electric share of the vehicle fleet, 2012–2024
Battery-electric and plug-in hybrid vehicles as a share of all registered vehicles
Unit: % of registered vehicles (battery-electric + plug-in hybrid)
Projection: linear trend of 2012–2025 yearly values, 95% prediction range. Our calculation, not a forecast.
Iceland runs on geothermal heat first and hydropower second: geothermal covers 70.4%1 of primary energy, hydro 19.3%1, and together they leave oil just one-tenth of the energy system - almost all of it mobility.
The 99.98% renewable grid predates the green-energy era: it was already essentially fossil-free in 1990, because Iceland never had thermal coal power at scale - the transition that other countries are attempting now, Iceland effectively finished in the 1980s2.
The headline percentages flatter ordinary consumption: two-thirds of electricity goes to aluminium and other heavy industry, and per-capita figures (51.1 MWh8 per person) measure smelters, not lifestyles.
The three renewable numbers (90% primary, 99.98% electricity, 79.3% EU-final) differ because they count different things - the honest answer to "what percentage" depends on whether the question includes aviation fuel and shipping3.
The last fossil chapter is being written on roads and runways: a 15.1% electrified car fleet in 2024 is converting the biggest remaining oil use into renewable electricity, one charging port at a time13.
Definition. Primary energy use counts energy as it enters the economy (geothermal heat, hydro potential, imported oil). The EU gross-final-energy definition counts energy delivered to end users, including transport fuels. Renewable electricity share is renewable generation divided by total generation.
Data sources. Orkustofnun energy balance IDN02102 and capacity tables IDN02100/02101; Eurostat nrg_ind_pehcf and nrg_ind_ren; Statistics Iceland IDN02103, IDN02104, IDN02105, SAM30120 and population table MAN00000; Orkustofnun district-heating statistics; Orkustofnun plant register (2020); Landsvirkjun; Cloudscene data-centre registry (commercial source, labelled as such).
Calculations. Renewable share of primary energy sums Orkustofnun's geothermal, hydro, wind and biofuel shares. Per-capita electricity divides Eurostat generation by the Statistics Iceland population of the same year (51.1 MWh = 19,605.9 GWh ÷ 383,726 people, 2024). Per-capita primary energy converts terajoules to gigajoules (×1,000) before dividing. Electrified fleet share sums battery-electric and plug-in hybrid vehicles over all registered vehicles. Projections are ordinary least-squares linear trends with a 95% prediction interval, computed by the renderer.
Limitations. Orkustofnun's energy balance ends in 2020; later primary-energy years are not yet published, so the 90% headline is dated 2020 while electricity and EU-definition figures run to 2024. The plant list reflects the 2020 register; Þeistareykir's later expansion is not included. Eurostat's electricity renewable share can exceed 100% under its accounting because gross final consumption excludes some own-use and losses. The data-centre count is a commercial registry (Cloudscene) and depends on how facilities are defined; the electricity table's server-farm figure is the official measure. Geothermal water use ends in 2018.
Sources
Orkustofnun (National Energy Authority). “Primary energy use by source, 1940–2020 (IDN02102).” Orkustofnun, 2021. data.os.is. Accessed 2026-09-17. Back to text
Eurostat. “Electricity generation by fuel type - Iceland (nrg_ind_pehcf).” European Commission, 2025. ec.europa.eu. Accessed 2026-09-17. Back to text
Eurostat. “Renewable energy statistics - Iceland (nrg_ind_ren).” European Commission, 2025. ec.europa.eu. Accessed 2026-09-17. Back to text
Orkustofnun. “Installed electricity capacity by source, 1904–2019 (IDN02100, IDN02101).” Orkustofnun, 2020. data.os.is. Accessed 2026-09-17. Back to text
Orkustofnun. “District heating in Iceland.” Orkustofnun, 2024. orkustofnun.is. Accessed 2026-09-17. Back to text
Orkustofnun (data compiled in Wikipedia, 'Geothermal power in Iceland'). “Icelandic geothermal power plants, capacity and ownership, 2020.” Orkustofnun / Wikipedia, 2020. en.wikipedia.org. Accessed 2026-09-17. Back to text
Statistics Iceland. “Geothermal water use by sector, 1998–2018 (IDN02104).” Statistics Iceland, 2019. hagstofa.is. Accessed 2026-09-17. Back to text
Statistics Iceland. “Population key figures, 1703–2026 (MAN00000).” Statistics Iceland, 2026. hagstofa.is. Accessed 2026-09-17. Back to text
Statistics Iceland. “Electricity production and use by category, 1990–2019 (IDN02103).” Statistics Iceland (Hagstofa Íslands), 2020. hagstofa.is. Accessed 2026-09-17. Back to text
Cloudscene. “Number of data centers by country, November 2025.” Cloudscene (commercial registry), 2025. cloudscene.com. Accessed 2026-09-17. Back to text
Landsvirkjun. “Fljótsdalur Power Station (Kárahnjúkar), 690 MW.” Landsvirkjun, 2024. landsvirkjun.com. Accessed 2026-09-17. Back to text
Statistics Iceland. “Oil use by transport mode, 1982–2020 (IDN02105).” Statistics Iceland, 2021. hagstofa.is. Accessed 2026-09-17. Back to text
Statistics Iceland. “Vehicle fleet by fuel type and weight, 1995–2024 (SAM30120).” Statistics Iceland, 2025. hagstofa.is. Accessed 2026-09-17. Back to text