Iceland CO2 Emissions per Capita (2026 Data)
Iceland's CO2 emissions per person: the 1960-2024 trend, the aluminium paradox, gas-by-gas breakdown and comparisons with the Nordics and the USA.
- Published
- Updated
- 5 sources
- 14 statistics
- 9 min read

- M.Sc. in Atmospheric Sciences, University of Iceland (Háskóli Íslands), with a minor thesis on North Atlantic storm-track variability
- Former research assistant at the Icelandic Meteorological Office (Veðurstofa Íslands), working on subarctic climate modeling and volcanic-ash dispersion forecasting
- B.A. in Sociology, also from the University of Iceland, with fieldwork on rural depopulation and tourism's impact on small fishing communities (Westfjords focus)
- Grew up in Akureyri, spent seven years living in Reykjavík and two in a small village in the Westfjords - brings first-hand experience of Iceland's regional weather extremes and community life
- Fluent in Icelandic and English; has translated Icelandic Met Office public advisories for international outlets
- Published field notes and data-driven pieces on glacier retreat (Vatnajökull), aurora forecasting, and the socioeconomic effects of overtourism in the Golden Circle

- M.A. in Journalism, University of Iceland, with additional coursework in Environmental Communication at the University of Bergen (Norway), giving a comparative Nordic lens
- 12+ years in Icelandic media, including editorial roles at RÚV (Iceland's national broadcaster) covering weather-related public safety reporting (storms, volcanic eruptions, road closures)
- Former fact-checking lead for a travel-and-culture desk, specializing in verifying tourism statistics, safety advisories, and climate data against primary sources (Vedur.is, Statistics Iceland)
- Has overseen editorial standards for bilingual (Icelandic/English) publications, ensuring both cultural nuance and accuracy for international readers
- Advocate for citing primary sources (Icelandic Met Office, Icelandic Tourist Board / Ferðamálastofa) rather than secondhand reporting
Key findings
- 9.67 tIceland emitted about 9.67 tonnes of CO2 per person in 2024 (OWID).
- 12.0 tPer-capita CO2 peaked at 12.0 tonnes in 2008, then fell about a fifth.
- 4.28 MtIceland's greenhouse gases total 4.28 Mt of CO2-equivalent per year (2024).
- 3xIceland's per-capita CO2 is about 3x Sweden's and 1.5x Norway's.
- 77%CO2 makes up 77% of Iceland's greenhouse gases; methane and N2O add 17%.
- 0.008%Iceland produces only 0.008% of global greenhouse gas emissions.
The Iceland carbon emissions per capita figure - the number behind every climate comparison - is about 9.7 tonnes of CO2 per person per year (2024)1, a number that contradicts every postcard. The country runs its grid on nearly 100% hydro and geothermal power, its houses are heated with volcanic water, and yet its Iceland CO2 emissions per capita figure sits above Norway's, triple Sweden's, and higher than almost every country in Europe1.
The paradox has an address: aluminium. Smelting one tonne of aluminium takes about 15 MWh of electricity - clean electricity in Iceland's case - but the smelting process itself releases CO2 from burned anodes, and those process emissions land on Iceland's ledger. Add the fishing fleet, the aviation that connects an island to the world, and a car culture built for long distances, and the explanation is complete. This page measures the emissions, the trend since 1960, and the targets meant to bend the curve - using the annual series back to 1960, the per-country comparison and the gas-by-gas ledger2.
Iceland CO2 emissions per capita: the numbers
Per-capita CO2 emissions in Iceland follow a 60-year arc. They stood at 6.9 tonnes1 in 1960, climbed with industrialisation through the 1970s, and peaked at 12.0 tonnes1 in 2008 - the year the financial crisis stopped the economy, and the emissions, mid-stride. The recovery was partial: by 20241 the figure stood at 9.67 tonnes1, about 60% above the 1960 level but a fifth below the peak. The projection in the chart extends the recent decline honestly - it points to roughly 8 tonnes by the early 2040s, real progress and still nowhere near zero. If the trend bends as the 2030 target demands, the number that started this page will end the decade closer to 5 tonnes than to 10 - a genuine transformation, and the first thing a reader five years from now should check against these charts.
On the broader greenhouse-gas measure that includes methane, nitrous oxide and F-gases, Iceland emitted 4.28 million tonnes of CO2-equivalent3 in 2024 - 12.13 tonnes3 per person - or about 0.008%3 of the global total3. So the Iceland co2 emissions per capita 2024 answer is 9.67 t (fossil CO2 only), while the Iceland greenhouse gas emissions per capita figure is 12.13 t CO2e once every gas is counted; the Iceland co2 emissions per capita 2023 comparison was 9.05 t per person. The Iceland CO2 emissions 2023 total was 3.45 Mt; the Iceland annual CO2 emissions figure now stands near 3.5 Mt. The per-capita framing matters here: Iceland is too small to move the global number, but its per-person rate is what the climate targets measure.
Projection: linear trend of 2000–2024 yearly values, 95% prediction range. Our calculation, not a forecast.
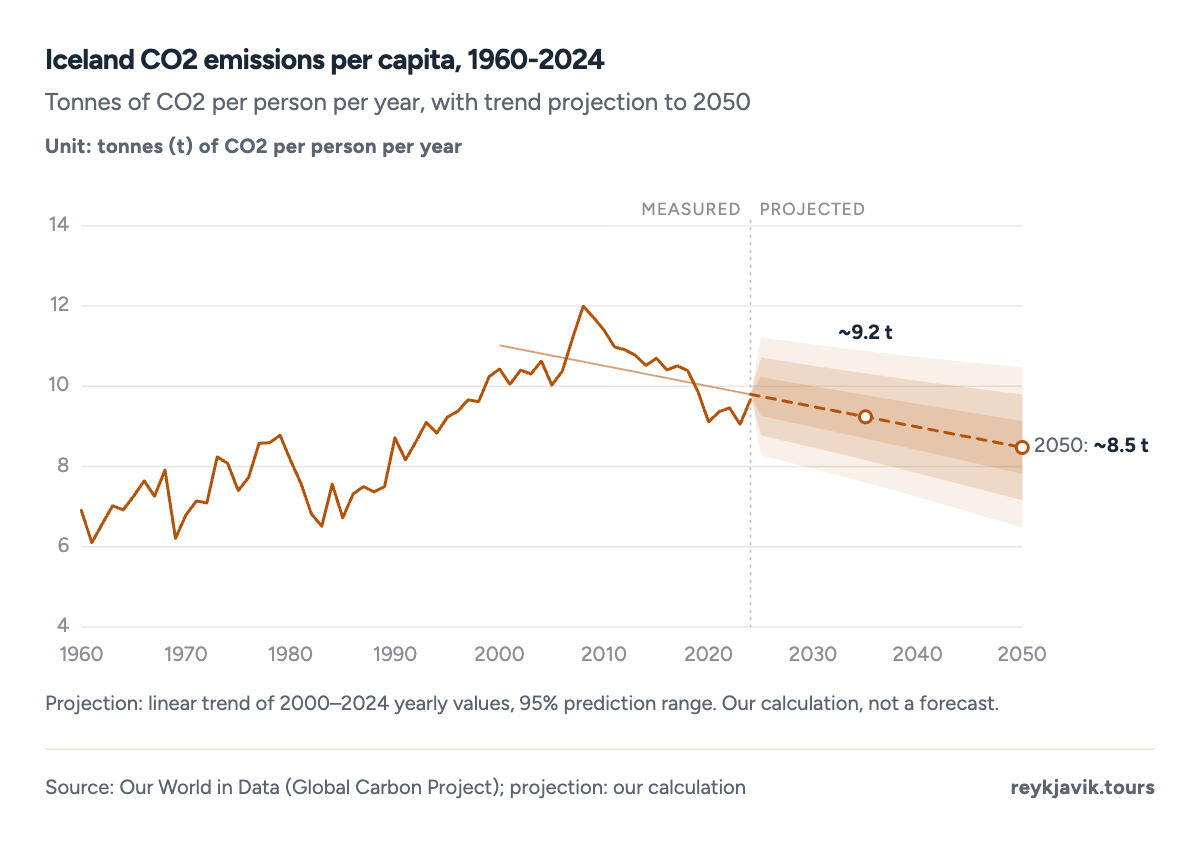
- Per-capita emissions climbed from 6.9 t (1960) to a 12.0 t peak in 2008.
- The 2008 financial crash cut emissions harder than any policy since.
- By 2024 the figure stood at 9.67 t - still about 60% above the 1960 level.
| 1960 | 6.91 |
| 1970 | 6.79 |
| 1980 | 8.16 |
| 1990 | 8.72 |
| 2000 | 10.43 |
| 2008 | 12.0 |
| 2015 | 10.7 |
| 2020 | 9.11 |
| 2024 | 9.67 |
The smelters: how green power and grey chemistry mix
Iceland hosts three giant metal plants: the ISAL (Rio Tinto) smelter in Straumsvik, the Elkem ferrosilicon plant at Akranes, and the Grundartangi complex. Between them they consume the majority of the electricity Landsvirkjun generates, and they employ thousands in towns that would otherwise live on fish alone. Their electricity is clean; their process is not. Smelting releases CO2 from the carbon anodes as a chemical necessity - roughly 1.5 to 2 tonnes of CO2 per tonne of aluminium produced, independent of where the power comes from4.
The arithmetic explains the per-capita paradox precisely. Iceland's roughly 90,000-tonne annual aluminium process emissions, spread across 390,000 people, contribute more per person than most countries' entire transport sectors. A German commuter who heats with gas still emits less per head than an Icelander whose grid is spotless - because the smelter's output is counted at the smelter, while the aluminium flies abroad in ingots. Consumption-based accounting flips the picture; territorial accounting - the one climate targets use - does not4.
None of this makes the smelters a mistake. They were Iceland's industrialisation strategy: cheap green power attracting capital that fishing villages could never have raised. But they fix a floor under the country's emissions that efficiency drives cannot lower - only process innovation (inert anodes, carbon capture on the pots) can, and those technologies remain pilot-stage4.
The aluminium paradox: green power, grey ledger
Iceland produces essentially all of its electricity from hydro and geothermal plants - the factor that makes its electric cars and heated sidewalks genuinely clean. But two aluminium smelters and a ferrosilicon plant emit CO2 as a by-product of the smelting reaction itself, not from burning fuel, and no grid can change that chemistry. Manufacturing - overwhelmingly the metal plants - is the single largest emissions sector in the accounts4.
Anyone searching Iceland co2 emissions by sector finds the same four chapters: manufacturing (mostly smelting chemistry), transport, fisheries and agriculture. This is why Iceland's per-capita number misleads casual readers. A visitor who heats, lights and drives electric in Reykjavik emits close to nothing; the ledger's biggest line belongs to exporting industry whose emissions are counted where the metal melts, not where the metal is used4.
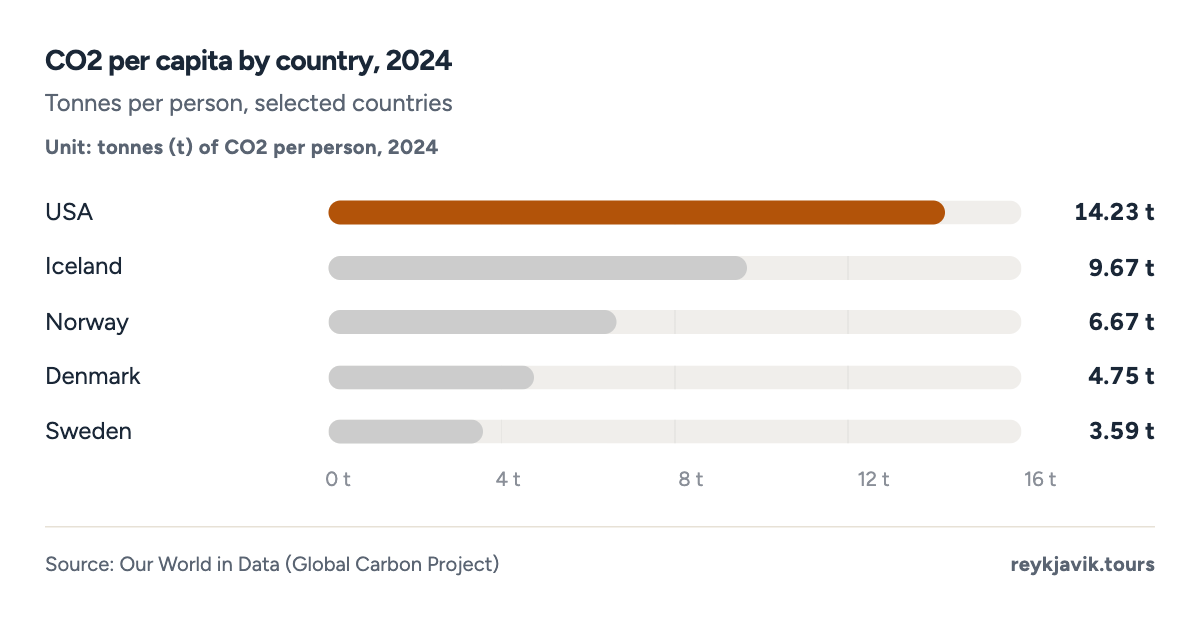
- Iceland's 9.67 t sits between the USA (14.2 t) and its Nordic neighbours.
- Sweden's 3.59 t shows what a heavily electrified Nordic economy reaches.
- Iceland emits about twice as much per person as Denmark.
The fleet: cars, fish and planes
Transport is the face of Icelandic emissions. The country registers roughly 360,000 vehicles, and its car fleet has been among Europe's fastest to electrify - plug-in models passed a sixth of the fleet by 2024, pushed by cheap renewable electricity and punishing import taxes on combustion engines4. Every electric car subtracts from the transport line in the inventory without adding to the electricity line, because the grid has no fossil plants to feed.
Fishing is the quieter giant. Iceland's trawlers burned their way through the North Atlantic long before climate accounting existed, and the fleet still emits more than most of the country's towns combined. Quota systems compressed the fleet but not its fuel; the route to cuts here runs through hydrogen, methanol and electric hybridisation trials now running in Icelandic harbours4.
Aviation is the awkward line. Keflavik's departures are counted where the fuel is sold, and Iceland's position - three hours from both Europe and North America - makes it a natural stopover, so the ledger catches long-haul traffic that has nothing to do with Icelandic residents. Per-capita statistics fold these transit and tourist flights into a small national population, which is one more reason the per-person number looks the way it does - and why the Iceland carbon footprint per capita, counted by consumption, reads differently from the production ledger used by the targets4.
Transport, fishing and farming
Beyond industry, three sectors carry the load. Road transport is the largest fossil emitter - the fleet of 360,000 vehicles, plus the tour buses and rental cars that serve two million visitors. Fishing vessels burn heavy fuel across the North Atlantic; fisheries' share of Iceland's emissions is far above the world average precisely because fishing matters so much to the economy4. Aviation adds the flights in and out, and agriculture contributes methane and nitrous oxide from livestock and drained soils - the same gases visible in the by-gas donut above3.
The cleaner the grid gets, the more these sectors dominate - which is why Iceland's climate policy focuses on electrifying transport and restoring wetlands rather than on the electricity sector its neighbours argue about.
The comparison chart above explains why climate commentators watch Iceland differently from its size. A country with the population of a small city emitting like a small industrial nation is a statistical curiosity; but the same chart shows the decline is real, steady and policy-driven - the electric-car fleet, the modernised trawlers and the wetland rewetting all bend the per-person line downward without any single dramatic intervention. Steady, unglamorous, and visible from orbit: Iceland's per-capita decline is the rarest thing in climate data, a rich country actually cutting emissions year after year1.
Projection: linear trend of 1990–2024 yearly values, 95% prediction range. Our calculation, not a forecast.
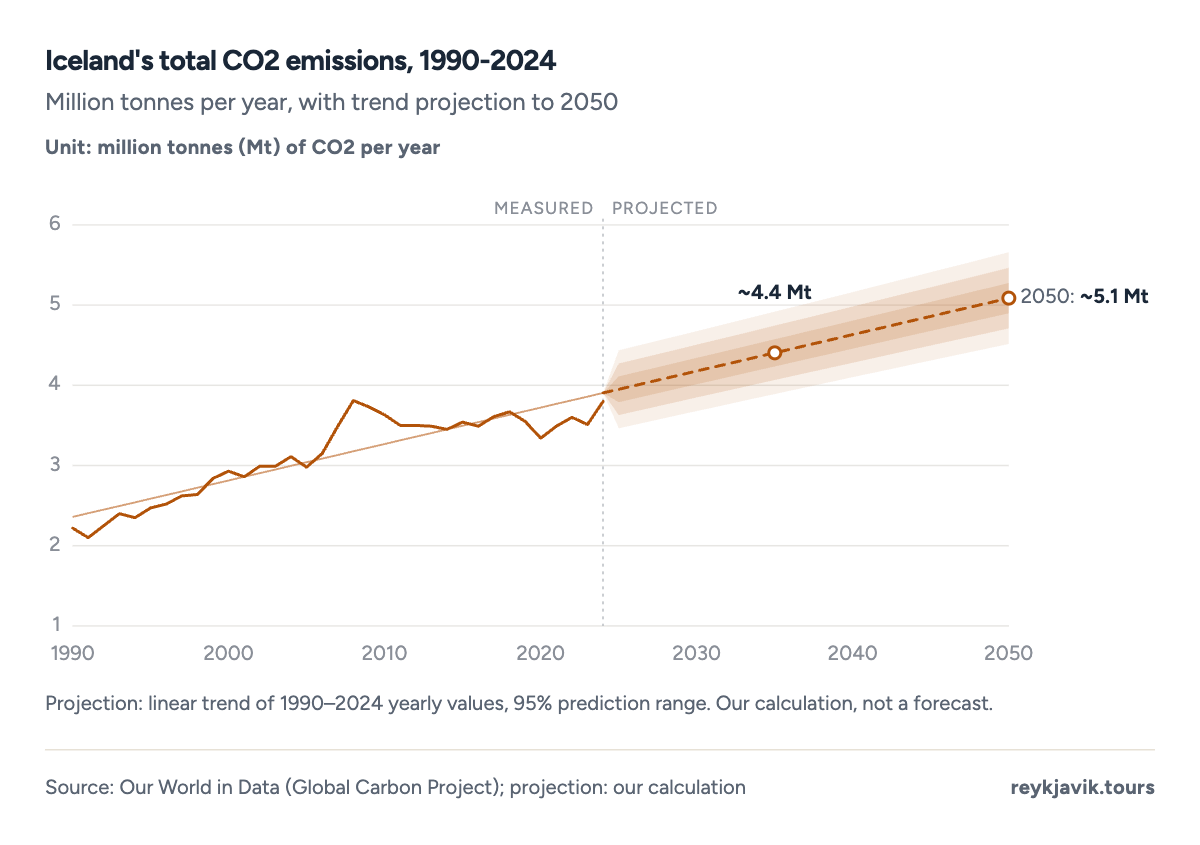
- Total CO2 emissions peaked above 3.8 Mt around 2008.
- Emissions in 2024 stood near 3.5 Mt - below the 2008 peak but above 1990.
| 1990 | 2.22 |
| 2000 | 2.93 |
| 2008 | 3.81 |
| 2015 | 3.54 |
| 2020 | 3.34 |
| 2024 | 3.8 |
The policy toolbox: carbon tax, electrification and CarbFix
Iceland prices carbon directly: a carbon tax levied on fossil fuels has risen year by year and is set to reach roughly ISK 10,000 per tonne of CO2 within the decade. The revenue funds offsets and electrification; the point is to make the petrol pump send the same signal as the climate target4.
The two big plays are visible from the road. First, transport electrification - recharging rental fleets, EV purchase incentives and a national charging grid that now covers every Ring Road town. Second, land: Iceland has drained its wetlands for a century, and those drained soils emit more CO2 than all its cars; rewetting them is the cheapest large-scale removal the country owns, and the restoration programme is among the most ambitious in the world4.
Carbon capture gets the headlines because Iceland demonstrates it best: the CarbFix process dissolves CO2 in water and injects it into basalt, where it mineralises into stone within two years. The Climeworks Orca and Mammoth plants beside Hellisheidi geothermal station are the world's first commercial direct-air-capture facilities, and their existence is why Iceland can promise genuine removals - not just offsets - on the road to 20504. What began as a science experiment injecting a few hundred tonnes is now a business removing tens of thousands, paid for by companies buying removal credits rather than promises. The basalt under the island can theoretically absorb more carbon than Iceland has ever emitted, which makes this the one climate technology where the country is not a customer but the infrastructure itself4.
The trend: what bent the curve
The line chart shows two bends. The first, 2008-2009, was not environmental: the financial collapse shut smelters' expansion, grounded flights and idled cars, cutting per-capita emissions from 12.0 to under 10 tonnes within two years1. The second is slower and real: since 2018, per-capita emissions have drifted down as electric and plug-in cars took a visible share of sales, fisheries modernised, and wetland restoration began reversing one of the country's largest sources4.
The projection extends the recent trend to 2050 - our calculation, not a forecast. It slopes gently downward, nowhere near fast enough to meet the targets below without new policy; that gap between the dashed line and the 2050 commitment is the entire Icelandic climate debate in one image5.
- Iceland
- Denmark
- Sweden
- Norway
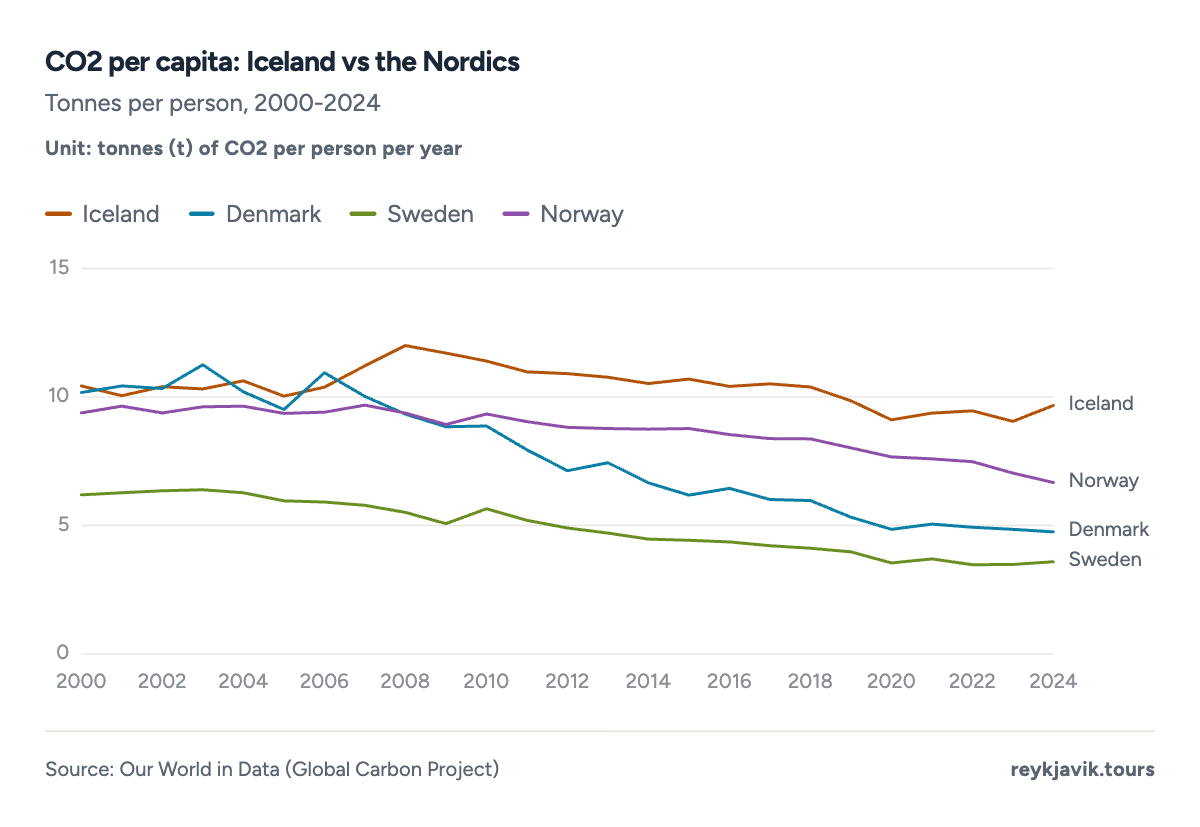
- Iceland's per-capita emissions run about 1.5x Norway's and roughly triple Sweden's.
- All four Nordics show the same shape: a 2008 peak, a fall, a slow decline since.
| USA | 14.23 |
| Iceland | 9.67 |
| Norway | 6.67 |
| Denmark | 4.75 |
| Sweden | 3.59 |
The targets: 2030 and carbon neutrality
Iceland's commitments are steeper than its curve. Under the effort-sharing agreement with the EU, the country has pledged to cut non-ETS emissions 55%5 below 2005 levels by 2030, and to reach carbon neutrality by 2050 - emissions balanced by removals, mostly through afforestation and wetland restoration5.
The distance between pledge and line is the story to watch: the 2050 neutrality goal requires bending the projection, not extending it. What helps Iceland's case is unusual - its removal options (afforestation, soil recarbonatisation, even carbon capture on geothermal emissions at CarbFix, which mineralises CO2 into basalt within years) scale with the same geology that makes the rest of the system clean5. Each technology has been demonstrated at scale in Iceland first, which is why the 2050 neutrality pledge is treated locally as engineering rather than rhetoric2. And the wetland programme scales with patience rather than technology: Iceland drained more land than it can re-wet quickly, which makes the removal pipeline long, slow and uniquely Icelandic.
| 2030 | Cut emissions 55% below 2005 levels (with LULUCF, EU effort-sharing agreement) |
| 2050 | Carbon neutrality - emissions offset by removals |
| Electricity | already ~100% renewable (hydro + geothermal) |
- CO2 (fossil + industry)3,292,971 t76.9%
- Methane (CH4)480,704 t11.2%
- Nitrous oxide (N2O)264,520 t6.2%
- F-gases244,216 t5.7%
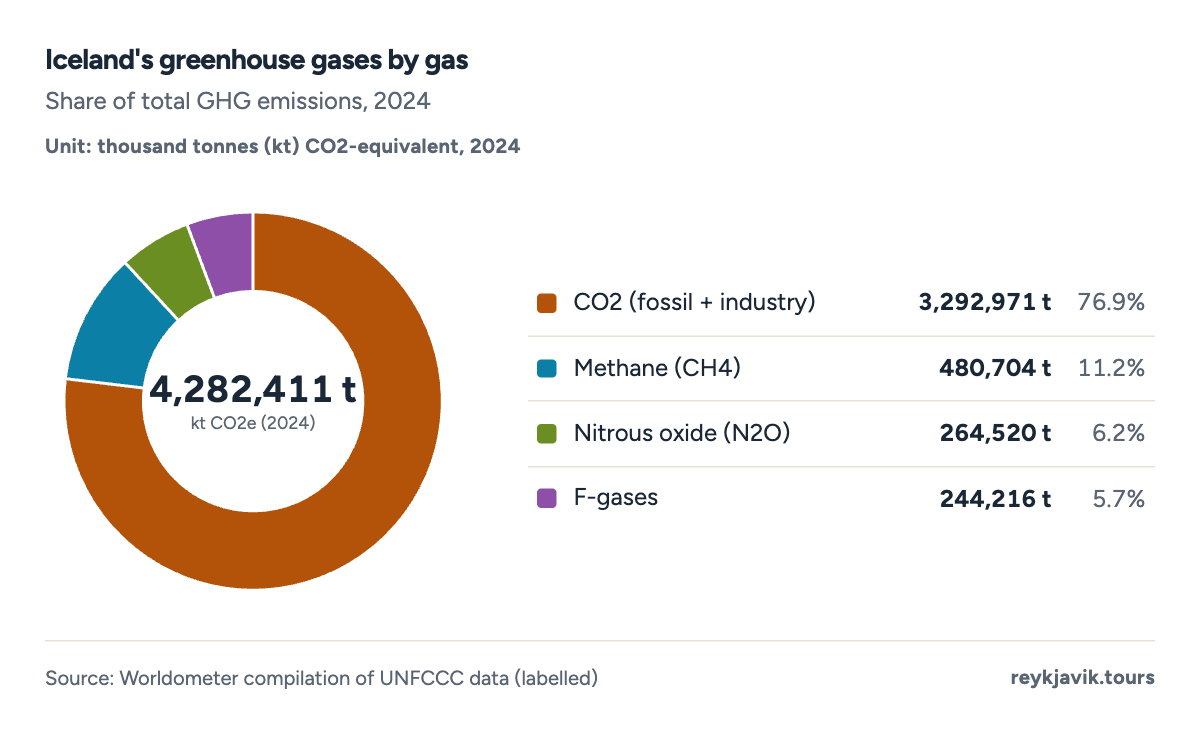
- CO2 makes up 77% of Iceland's greenhouse gases; the rest is methane, N2O and F-gases.
- Methane and N2O come mostly from agriculture and waste rather than energy.
Conclusions
- Iceland emits about 9.7 t1 of CO2 per person - high for Europe despite a fully renewable grid, because the ledger counts smelting chemistry, not just burned fuel. The number answers the headline question but not the whole story: aluminium exports, not Icelanders' lifestyles, carry most of it.
- Emissions peaked at 12.0 t1 per person in 2008 and fell about a fifth by 2024; the financial crash did more than any policy before 20181.
- The comparison is unflattering locally and flattering regionally: Iceland sits above every Nordic neighbour per capita but well below the United States1.
- CO2 is only three-quarters of the story - methane from agriculture and waste, and F-gases from industry, fill the rest of the 4.28 Mt greenhouse ledger3.
- The 2030 target (-55% vs 2005) and 2050 carbon neutrality demand a bend in the curve that the current trend line does not yet show - electrification of transport and wetland restoration are the levers being pulled5.
Methodology
- Per-capita and total CO2: 1936-2024 series (OWID/Global Carbon Project)
- Greenhouse gases by gas: 2024 (UNFCCC data via Worldometer)
- Country comparison: 2000-2024
Definition. CO2 emissions here are fossil CO2 from energy and industry, territorial (produced in Iceland). The greenhouse-gas total converts all gases to CO2-equivalents and excludes land use (LULUCF), which is why it differs from the UNFCCC headline including land use.
Data sources. Our World in Data, compiled from the Global Carbon Project (per-capita and total CO2, 1936-2024); Worldometer compilation of UNFCCC greenhouse-gas data (aggregator, labelled); Government of Iceland climate policy pages; Environment Agency of Iceland inventory for sector context.
Calculations. Per-capita values divide territorial CO2 by population as published by the source. Percent changes use the index years stated in the text. The projection is an ordinary least-squares linear trend with a 95% prediction interval, computed by the renderer.
Limitations. OWID/Global Carbon Project figures are fossil CO2 and exclude land-use change; the greenhouse-gas totals include all gases and therefore run higher. Per-capita figures count emissions produced in Iceland, including exports of aluminium - the consumption-based ledger, which allocates emissions to the buyer, is lower for Iceland but is not published annually. 2024 values are estimates by the compilers.
Sources
- Our World in Data (Global Carbon Project). “CO2 emissions per capita and total CO2 emissions, Iceland 1936-2024.” Our World in Data (aggregator of GCP/UNFCCC data), 2024. ourworldindata.org. Accessed 2026-09-17. Back to text
- Reykjavik Tours. “Own conversions and context (labelled).” own calculation, 2026. reykjavik.tours. Accessed 2026-09-17. Back to text
- Worldometer (UNFCCC compilation). “Iceland greenhouse gas emissions by gas, 2024.” Worldometer (aggregator, labelled), 2025. worldometers.info. Accessed 2026-09-17. Back to text
- Environment Agency of Iceland (UST). “Greenhouse gas inventory and sector breakdown.” UST, 2025. ust.is. Accessed 2026-09-17. Back to text
- Government of Iceland. “Climate policy: carbon neutrality by 2050, 2030 reduction targets.” Government Offices of Iceland, 2026. government.is. Accessed 2026-09-17. Back to text
About the author
Laufey turns public statistics on tourism and travel into research people can check and cite.
Every figure on this page links to its source. How we research
Related research
More data on Iceland's weather and travel from Reykjavik Tours.
- EnergyIceland Renewable Energy Percentage (2026 Data)90% of Iceland's energy is renewableRead the research →
- NatureBiggest Glacier in Iceland (2026 Data)7,720 km² Vatnajökull, Iceland's biggest glacierRead the research →
- WeatherIceland Daylight Hours by Month (2026 Data)21.2 h of daylight in Reykjavík on the longest dayRead the research →
- WeatherHow Much Snow Does Iceland Get? (2026 Data)55 days a year with snow on the ground in ReykjavíkRead the research →
- WeatherIceland Temperature by Month (2026 Data)39 °F average temperature in IcelandRead the research →
- WeatherIceland Weather by Month (2026 Data)4.5 in rain in September, Iceland's wettest monthRead the research →