Average Cost of Living in Iceland (2026 Data)
What it costs to live in Iceland per month: rent, food and bills for a single person and a family, how Iceland compares with the rest of the world, and what it costs to move there.
- Published
- Updated
- 15 sources
- 84 statistics
- 12 min read

- M.Sc. in Atmospheric Sciences, University of Iceland (Háskóli Íslands), with a minor thesis on North Atlantic storm-track variability
- Former research assistant at the Icelandic Meteorological Office (Veðurstofa Íslands), working on subarctic climate modeling and volcanic-ash dispersion forecasting
- B.A. in Sociology, also from the University of Iceland, with fieldwork on rural depopulation and tourism's impact on small fishing communities (Westfjords focus)
- Grew up in Akureyri, spent seven years living in Reykjavík and two in a small village in the Westfjords - brings first-hand experience of Iceland's regional weather extremes and community life
- Fluent in Icelandic and English; has translated Icelandic Met Office public advisories for international outlets
- Published field notes and data-driven pieces on glacier retreat (Vatnajökull), aurora forecasting, and the socioeconomic effects of overtourism in the Golden Circle

- M.A. in Journalism, University of Iceland, with additional coursework in Environmental Communication at the University of Bergen (Norway), giving a comparative Nordic lens
- 12+ years in Icelandic media, including editorial roles at RÚV (Iceland's national broadcaster) covering weather-related public safety reporting (storms, volcanic eruptions, road closures)
- Former fact-checking lead for a travel-and-culture desk, specializing in verifying tourism statistics, safety advisories, and climate data against primary sources (Vedur.is, Statistics Iceland)
- Has overseen editorial standards for bilingual (Icelandic/English) publications, ensuring both cultural nuance and accuracy for international readers
- Advocate for citing primary sources (Icelandic Met Office, Icelandic Tourist Board / Ferðamálastofa) rather than secondhand reporting
Key findings
- $3,679A single person needs about $3,679 a month (446,337 kr) to live in Reykjavík, Numbeo's 2026 data shows.
- $8,927A family of four needs about $8,927 a month (1,083,086 kr) to live in Reykjavík, per Numbeo.
- 172.7Iceland's overall price level is 172.7% of the EU average, second-highest in Europe after Switzerland, per Eurostat.
- 3,521 krAverage rent nationwide is 3,521 kr per square metre a month, up 3.6% in a year.
- 259,951 krA single adult must show at least 259,951 kr ($2,143) a month in income to get most Icelandic residence permits.
- 64.2Iceland's electricity and heating price level is just 64.2% of the EU average, the cheapest category measured.
- $8,242Mean monthly earnings reached 1,058,000 kr ($8,242) in 2025, up 88% from 563,000 kr in 2014, per Statistics Iceland.
- 15,290 krIcelandic families pay as little as 15,290 kr ($126) a month for a full day of public preschool.
Iceland ranks among the two or three most expensive countries in Europe to live in172.71 - yet heating a home here costs less, relative to the rest of Europe, than in almost any other country, because geothermal water runs through the pipes instead of imported gas or oil. That contradiction sits at the heart of the average cost of living in Iceland: rent, restaurants and childcare(private) run far above the European average, while electricity and hot water run far below it.
This report gathers Numbeo's crowd-sourced price estimates, Statistics Iceland's official household spending and wage data, Eurostat's price-level comparisons and the Directorate of Immigration's financial requirements into one budget: what a single person and a family actually spend each month, how that compares with the rest of the world, and how much money it takes to move here in the first place.
How much does it cost to live in Iceland
A single person living alone in Reykjavík spends about $3,6792 a month once rent is added: 197,670 kr2 for food, transport and everyday spending, plus 248,667 kr2 for a one-bedroom apartment outside the city centre. Renting in the city centre instead pushes the total to $4,1362 a month. These are Numbeo's crowd-sourced averages for Reykjavík (624 price entries from 89 contributors as of 28 August 2026), the closest thing to a single answer this question has, since no Icelandic authority publishes its own "cost of living" figure.
A family of four needs roughly $8,9272 a month, or $9,6482 in the city centre - about 2.4 times a single person's budget, mostly because a three-bedroom apartment costs 1.3 times as much to rent as a one-bedroom flat. Average monthly expenses in Iceland rise fastest with housing, not food: the family estimate excluding rent is only 3.8 times the single-person figure, close to what a family of four (two adults, two children) is generally assumed to need.
Two official datasets confirm the same order of magnitude. Iceland's Housing and Construction Authority puts the nationwide average rent at 3,521 kr3 per square metre a month; a 55 m² one-bedroom flat at that rate costs 193,655 kr3 ($1,596), close to Numbeo's outside-centre figure. And Statistics Iceland's last Household Budget Survey (2013–2016, average household of 2.9 people) found total annual spending of 6,238,999 kr4; adjusted to September 2026 prices using the consumer price index, that is about 10,125,254 kr4 a year, or $6,954 a month - in the same range as the family estimate once a larger, older household and included rent are taken into account. Statistics Iceland has not repeated the survey since; the figure is a floor, not a current one.
The average cost of living in Reykjavík
Reykjavík itself is not unusually expensive by Icelandic standards: the capital's average rent, 3,544 kr3 per square metre, sits close to the 3,521 kr nationwide figure, and Numbeo's estimates above are themselves built from Reykjavík prices. The bigger gap runs between the capital region as a whole and small rural towns, where rent can run a third lower.
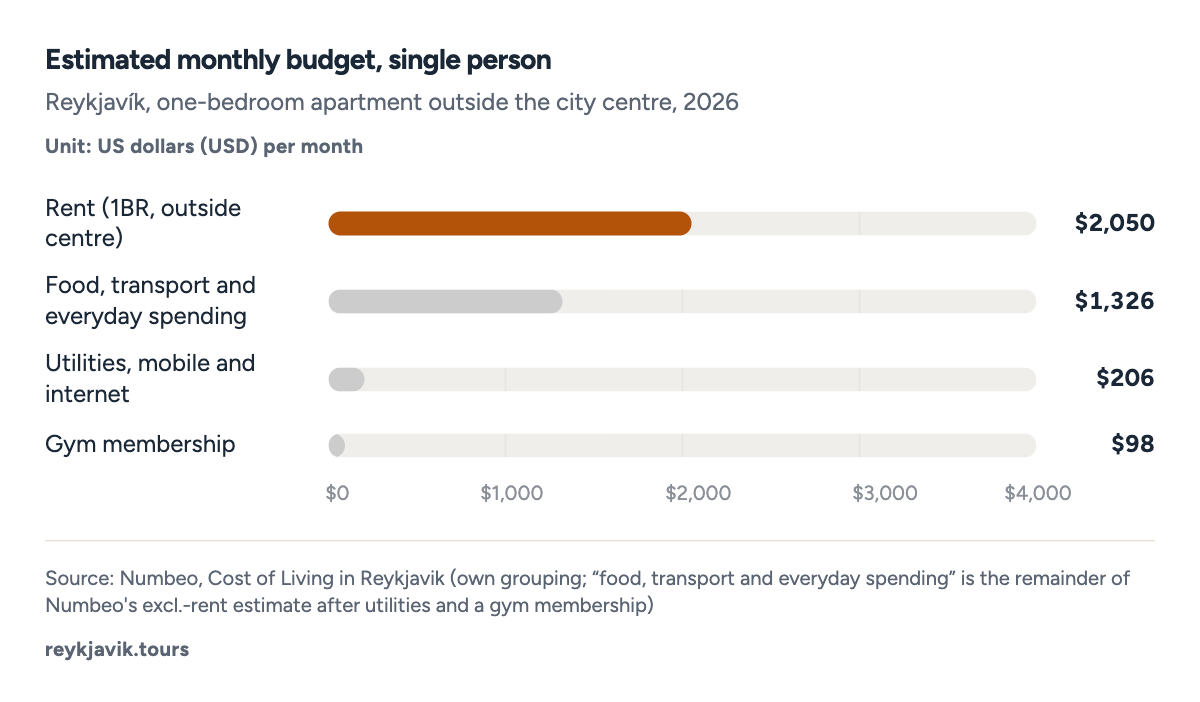
- Rent is the single largest item at $2,050 a month.
- Food, transport and other everyday spending add up to about $1,326.
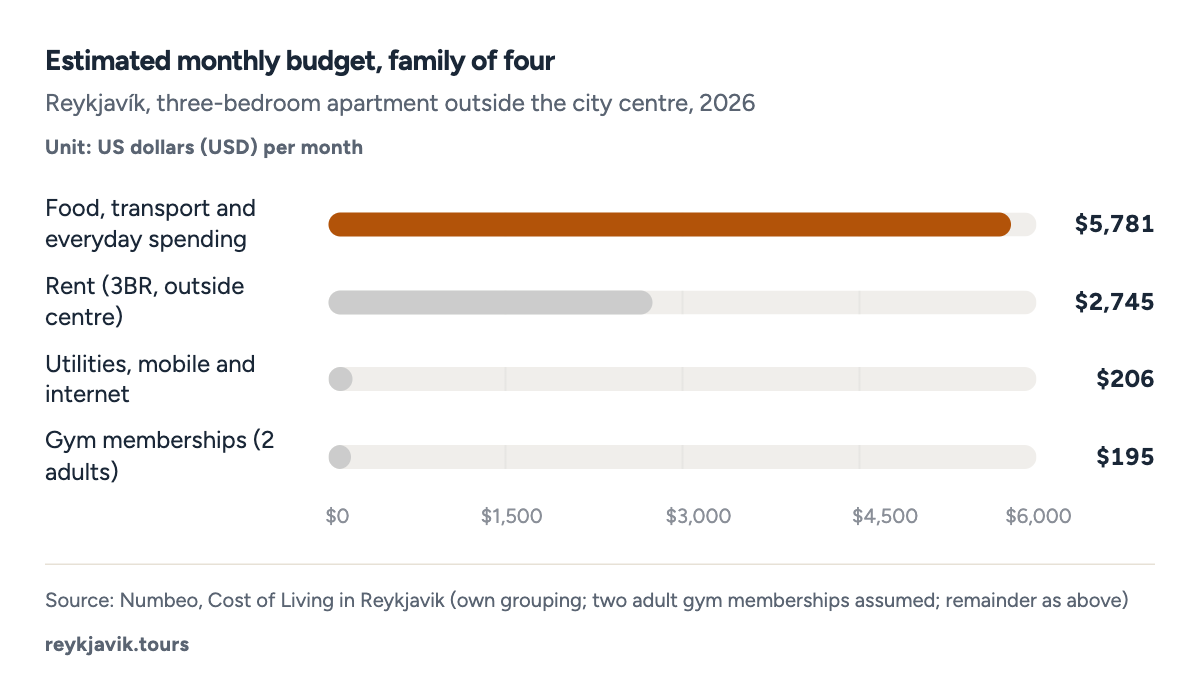
- A three-bedroom rental costs $2,745 a month, 1.3× a one-bedroom flat.
- Food, transport and other everyday spending for the family add up to about $5,781.
| Single person | Outside city centre | $1,629 | $2,050 | $3,679 | 446,337 kr |
| Single person | City centre | $1,629 | $2,506 | $4,136 | 501,782 kr |
| Family of four | Outside city centre | $6,182 | $2,745 | $8,927 | 1,083,086 kr |
| Family of four | City centre | $6,182 | $3,465 | $9,648 | 1,170,541 kr |
Iceland vs the rest of the world
Two independent measures agree on where Iceland sits: near the very top. Numbeo's Cost of Living Index, built from crowd-sourced prices worldwide, puts Iceland at 97.65 (New York City = 100) - the 7th highest of the countries it lists, behind only Bermuda, the Cayman Islands, Switzerland and two small, thinly sampled markets (Solomon Islands, Turkmenistan). Among sovereign European countries, only Switzerland scores higher.
Eurostat's price level index, built from official statistical offices rather than crowd-sourced prices, tells the same story: Iceland's overall consumer price level is 172.71 (EU27 average = 100) in 2024, second only to Switzerland's 184.31 and above Norway, Denmark, Ireland, Luxembourg and even the United States. The gap between Iceland and the euro area (around 105) is roughly 65 percentage points - a Reykjavík shopping basket that would cost €100 in the euro area on average costs the equivalent of about €173 in Iceland.
That price level has not always been this high. Iceland's krona collapsed in the 2008 financial crisis, and its relative price level fell from a peak of 182.11 in 2017 down to 103.11 the year of the crash itself, before climbing back above 170 in the years since. A simple straight-line trend through the full 1995–2024 series points to a similar level by 2050, though the swings around 2008–2009 show how much a currency move can shift the number within a single year.
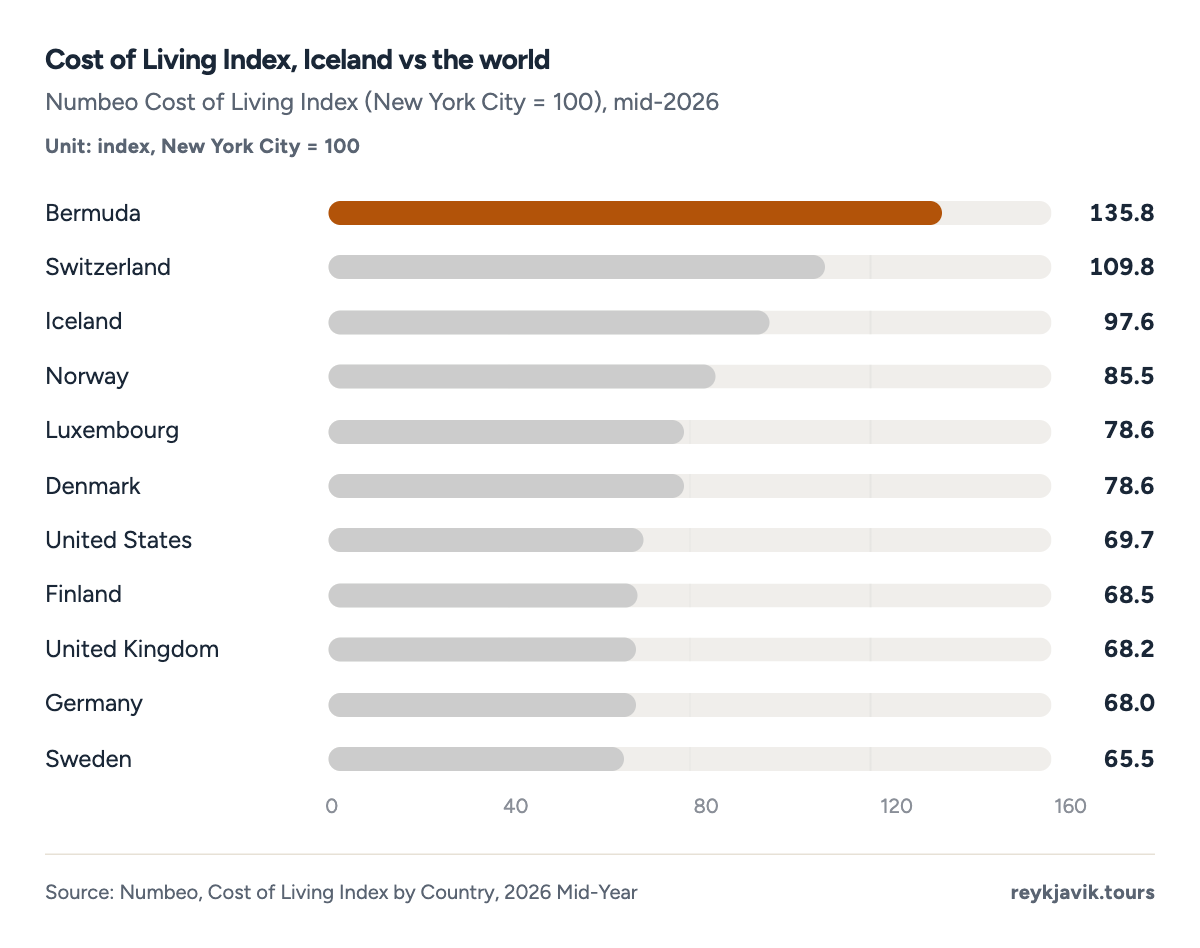
- Iceland scores 97.6, the 7th highest of the countries in Numbeo's table.
- Switzerland is the only sovereign European country that scores higher than Iceland.
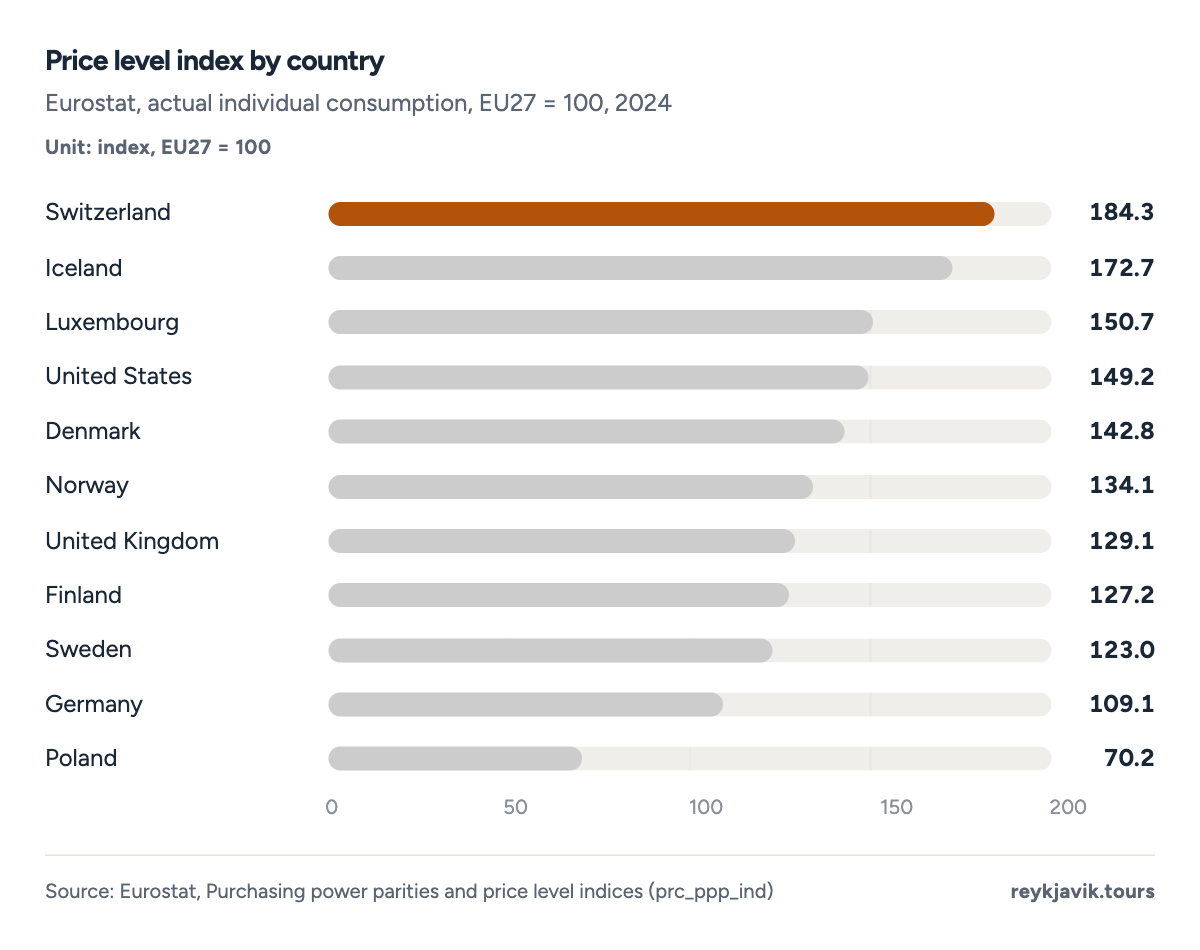
- Iceland's price level, 172.7, is second only to Switzerland's 184.3.
- Iceland is more expensive than every other Nordic country, including Norway.
Projection: linear trend of 1995–2024 yearly values, 95% prediction range. Our calculation, not a forecast.
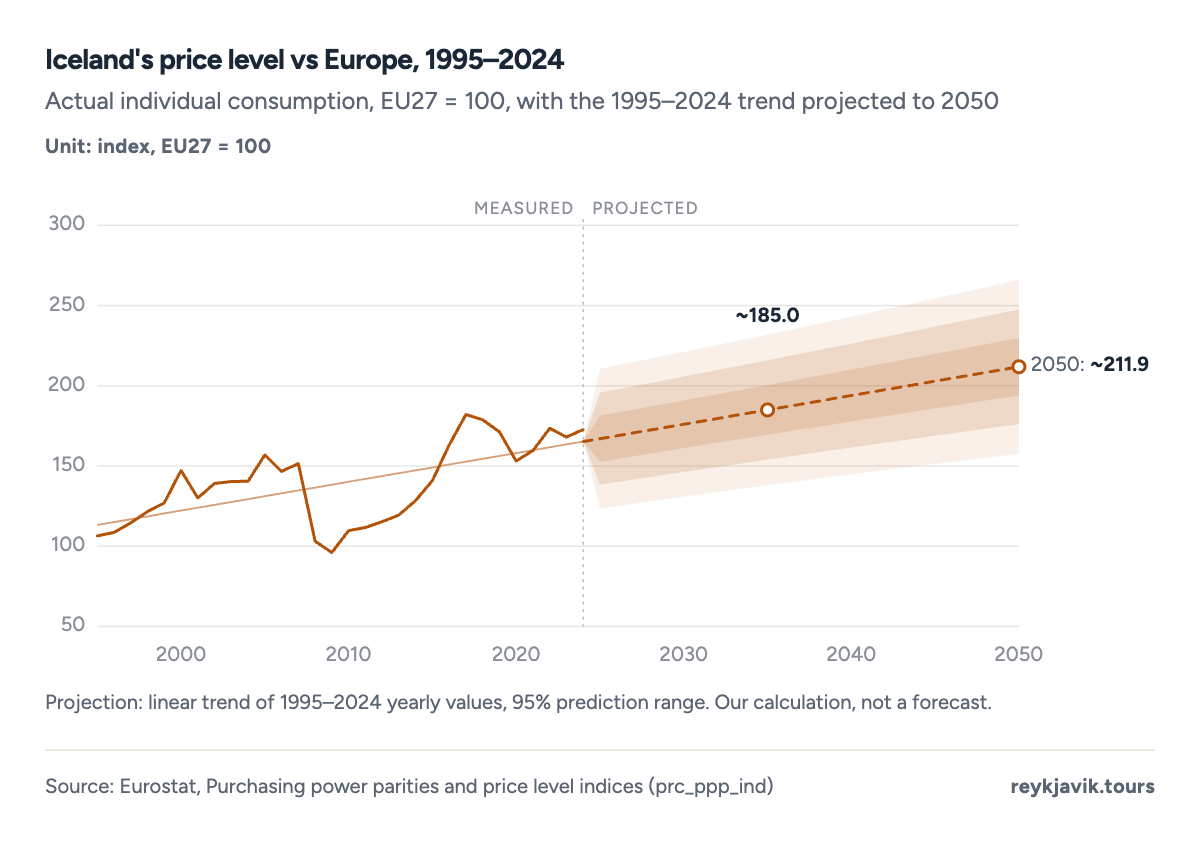
- The price level swung from 103.1 in 2008 to 182.1 in 2017 as the króna moved.
- At 172.7 in 2024, it is close to its 30-year trend.
| 1 | Bermuda | 135.8 | 105.9 | 149.0 | 104.3 |
| 2 | Cayman Islands | 119.9 | 74.1 | 126.9 | 144.9 |
| 3 | Switzerland | 109.8 | 47.9 | 109.5 | 165.7 |
| 4 | Solomon Islands | 104.1 | 20.2 | 66.8 | 13.2 |
| 5 | Turkmenistan | 101.6 | 23.9 | 116.3 | 18.5 |
| 6 | Bahamas | 101.3 | 48.5 | 102.5 | 58.5 |
| 7 | Iceland | 97.6 | 47.7 | 106.3 | 113.6 |
| 8 | Jersey | 91.1 | 48.5 | 80.1 | 101.8 |
| 9 | Singapore | 90.8 | 68.3 | 84.9 | 91.3 |
| 10 | Israel | 89.6 | 35.2 | 86.4 | 115.0 |
| 11 | Norway | 85.5 | 28.2 | 89.4 | 123.2 |
| 12 | Luxembourg | 78.6 | 47.1 | 78.1 | 155.1 |
| 13 | Denmark | 78.6 | 26.6 | 74.3 | 141.2 |
| 16 | Netherlands | 73.0 | 35.9 | 67.4 | 124.3 |
| 21 | United States | 69.7 | 37.1 | 76.4 | 144.5 |
| 23 | Finland | 68.5 | 20.1 | 69.3 | 119.8 |
| 26 | United Kingdom | 68.2 | 30.1 | 64.8 | 118.2 |
| 27 | Germany | 68.0 | 22.0 | 64.6 | 130.0 |
| 29 | Sweden | 65.5 | 20.1 | 67.5 | 128.6 |
Reykjavík's rent looks different depending on which capital it is compared with. A one-bedroom flat outside the centre costs $2,0502 a month in Reykjavík - 48% cheaper than the same flat in New York, 13% cheaper than in London, but 28% more expensive than in Copenhagen and 24% more than in Oslo. Net salaries follow a narrower band: Reykjavík's average net pay sits within 12 percentage points of all four cities, closest of all to Oslo.
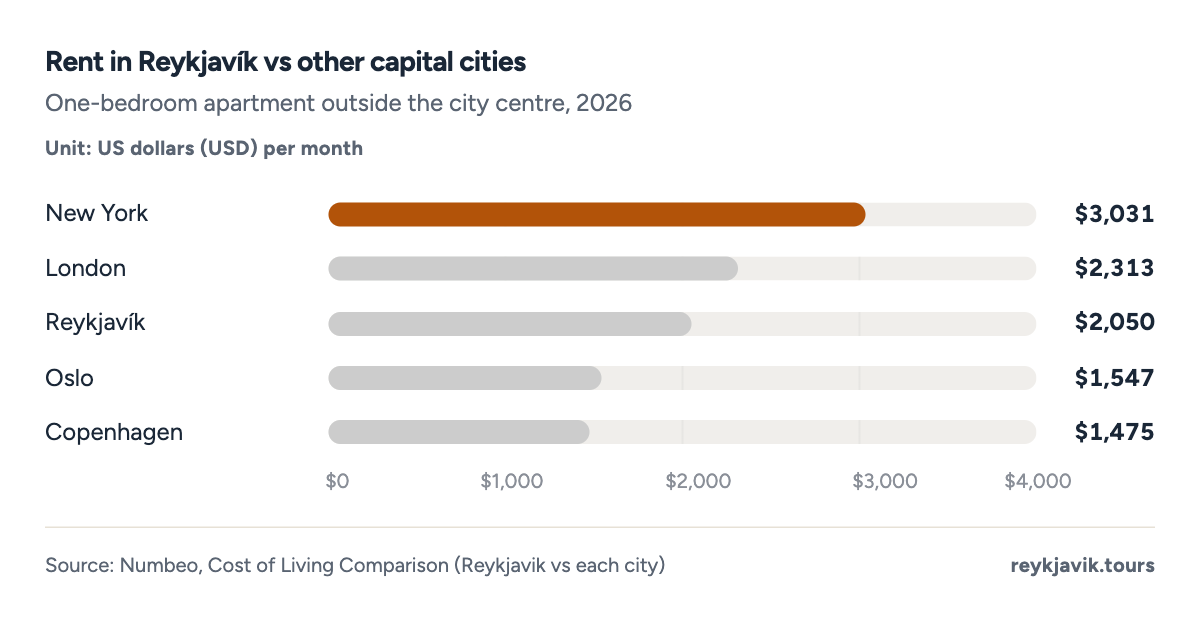
- New York is the most expensive of the cities compared, at $3,031.
- Copenhagen is the cheapest, at $1,475.
| Reykjavík | $2,050 | $4,690 | 0% |
| Copenhagen | $1,475 | $4,650 | −28.0% |
| New York | $3,031 | $5,253 | +47.9% |
| London | $2,313 | $4,834 | +12.9% |
| Oslo | $1,547 | $4,684 | −24.5% |
What Icelanders actually spend on
Statistics Iceland weights its consumer price index by how households actually spend, and the current basket (December 2025) shows housing dominating everything else: 30.3%6 of spending goes on housing, water, electricity and other fuels, more than food (15.4%6) and transport (15.2%6) combined. Recreation and culture take 9.2%6, and every other category - clothing, health, communication, restaurants, education and the rest - shares the remaining 29.9%.
The last full Household Budget Survey, covering 2013–2016, shows how that mix has shifted: housing's share rose from 20.1%4 of spending in 2000–2002 to 30.2%4 in 2013–2016, while food's share fell from 15.9%4 to 13.1%4 over the same period - a pattern familiar from many rich countries, where rising rents and house prices crowd out other spending even as food becomes relatively cheaper. Statistics Iceland has not published a newer round of the survey since 2013–2016, so the category table below is the most recent official breakdown available, even though prices have risen substantially since then.
- Housing, water, electricity and fuels30.330.3%
- Food and non-alcoholic beverages15.415.4%
- Transport15.215.2%
- Recreation, sport and culture9.29.2%
- Other categories29.929.9%
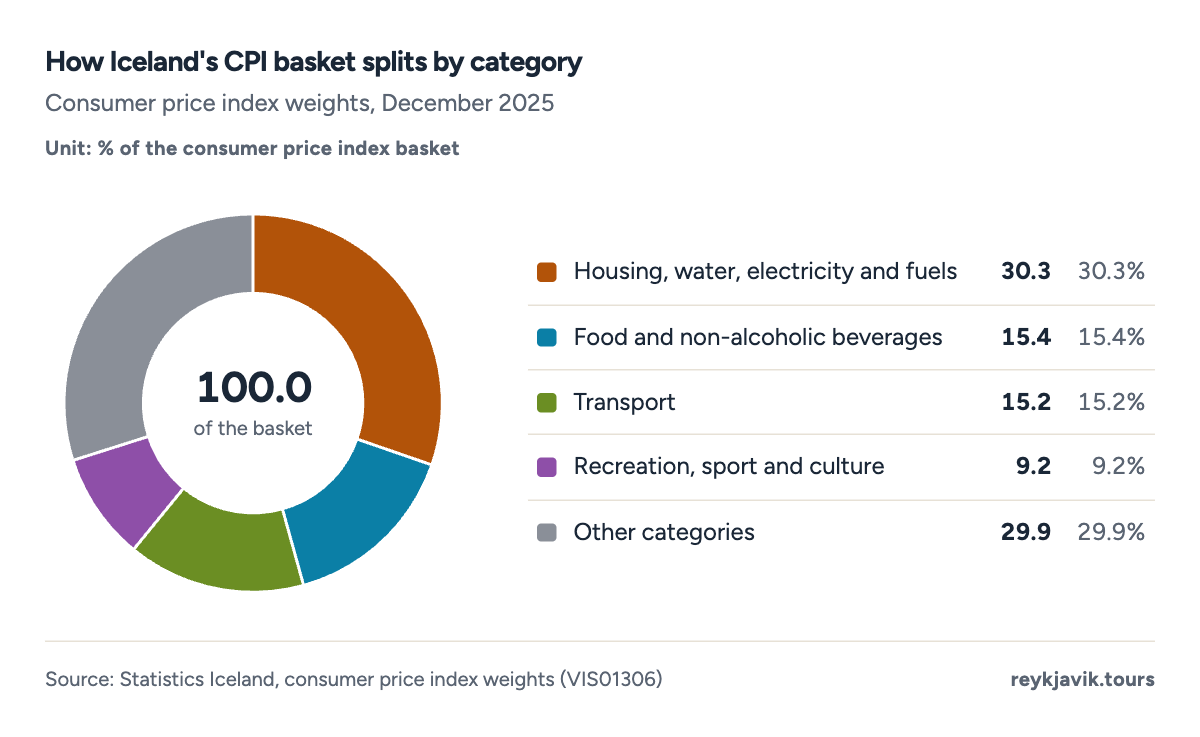
- Housing takes 30.3% of the average household's spending, the largest share.
- Food and transport together take about 30.6%.
- Housing
- Food
- Transport
- Recreation
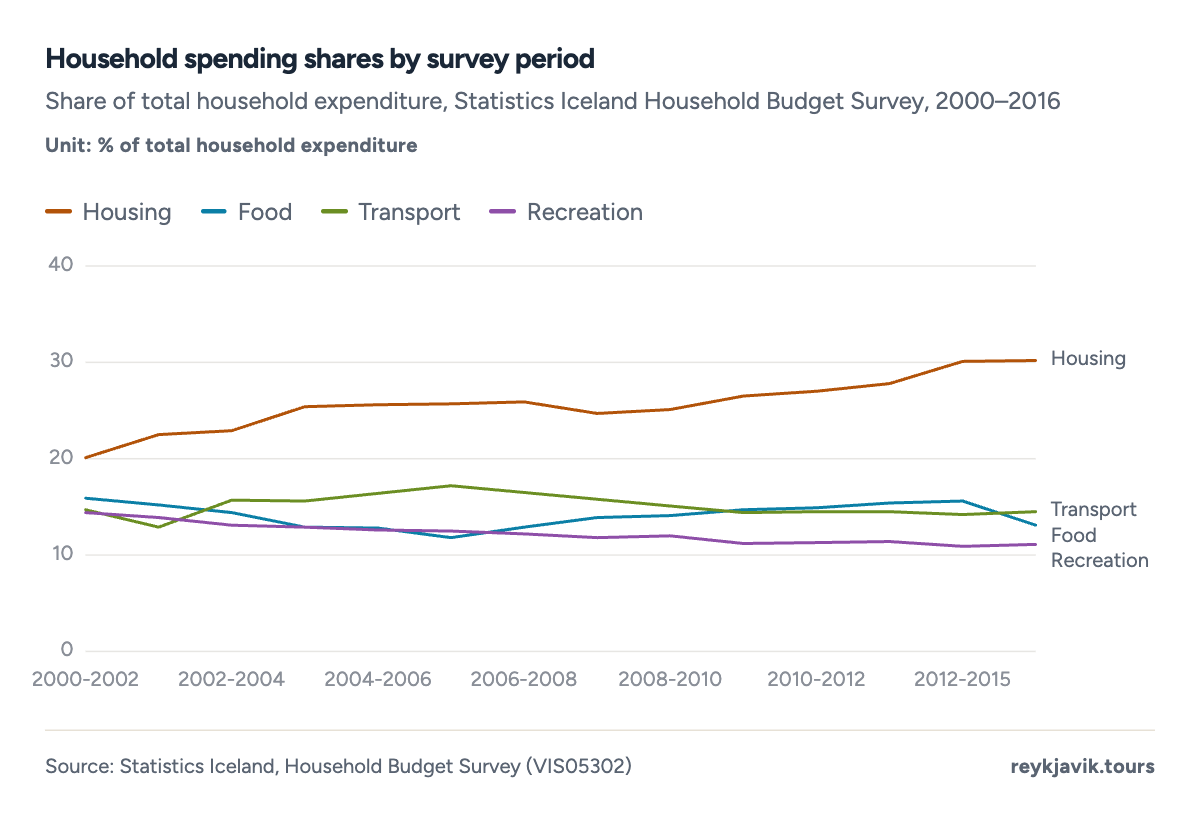
- Housing's share climbed from 20.1% to 30.2%.
- Food's share fell from 15.9% to 13.1%.
| Housing, water, electricity, gas and other fuels | 1,886,211 kr | 30.2% |
| Transport | 907,447 kr | 14.5% |
| Food and non-alcoholic beverages | 820,061 kr | 13.1% |
| Recreation and culture | 693,642 kr | 11.1% |
| Miscellaneous goods and services | 377,586 kr | 6.1% |
| Hotels, cafés and restaurants | 352,516 kr | 5.7% |
| Furnishing and household equipment | 284,728 kr | 4.6% |
| Health | 263,319 kr | 4.2% |
| Clothing and footwear | 241,854 kr | 3.9% |
| Communications | 201,320 kr | 3.2% |
| Alcoholic beverages and tobacco | 162,043 kr | 2.6% |
| Education | 48,272 kr | 0.8% |
Where a household lives changes its total spending as much as any single category. Statistics Iceland's survey found capital-area households spending 6,594,973 kr4 a year on average, against 5,356,504 kr4 in the smallest rural communities - capital-area households spend 23% more overall, driven mainly by higher housing costs, even though the survey is now a decade old.
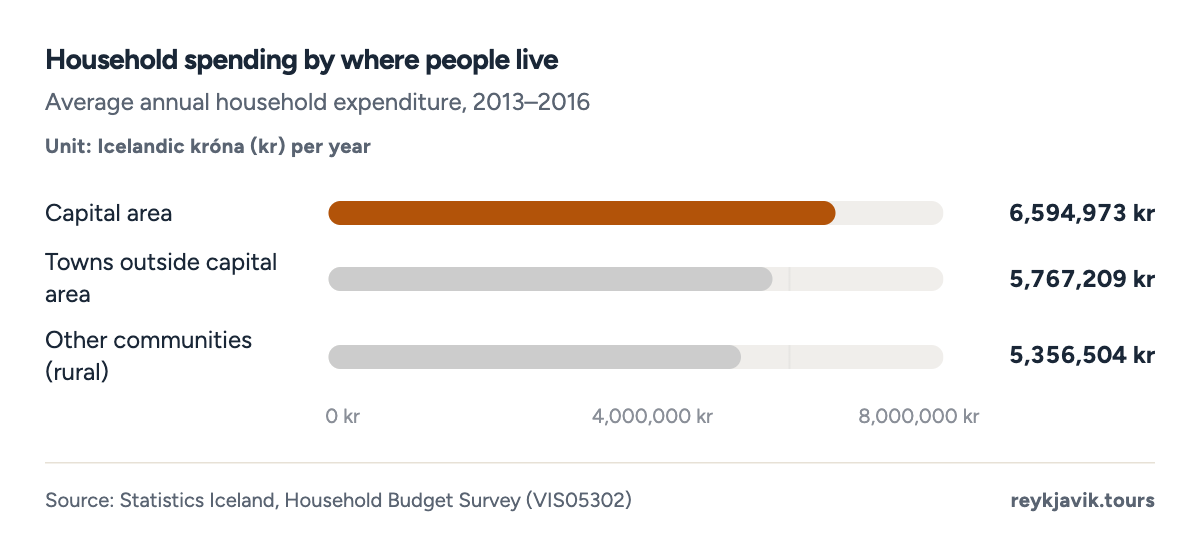
- Capital-area households spend 6,594,973 kr a year on average, the most of the three groups.
- Rural households spend 23% less than capital-area ones.
Housing and rent
Rent is the single biggest line in every Icelandic household budget, and it varies by region as much as it does by apartment size. The nationwide weighted average is 3,521 kr3 per square metre a month; Akureyri, Iceland's largest town outside the capital region, tops the list at 3,796 kr per square metre, though on a comparatively small sample of contracts. Within the capital region itself, rents in Reykjavík, Garðabær/Hafnarfjörður and Kópavogur sit within a few percent of each other, while the towns of Mosfellsbær, Seltjarnarnes and Kjós run cheapest at 2,977 kr.
Smaller apartments cost more per square metre everywhere: in Reykjavík a one-room flat rents for 4,420 kr3 per square metre, more than double the 2,023 kr3 charged for a 6-plus room property, since larger homes spread fixed costs over more space. Buying instead of renting costs about $8,0572 per square metre in the city centre or $6,3732 outside it, per Numbeo; at Numbeo's reported average 20-year mortgage rate of 8.88%2, financing a purchase costs more per month than renting the same space for most buyers.
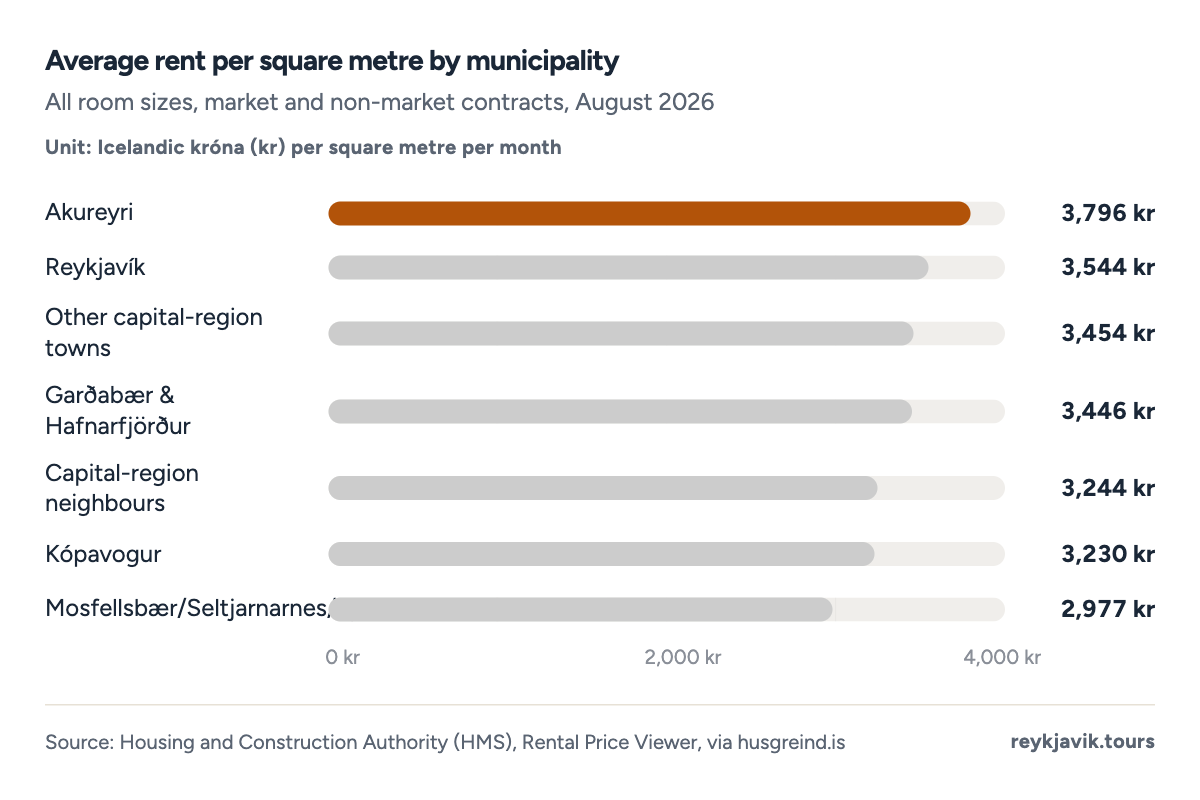
- Akureyri has the highest average rent per square metre, 3,796 kr.
- Mosfellsbær/Seltjarnarnes/Kjós is the cheapest of the areas shown, at 2,977 kr.
| Akureyri | 4,001 kr | 3,348 kr | 3,063 kr | 2,729 kr | 1,971 kr | 1,594 kr |
| Garðabær & Hafnarfjörður | 4,280 kr | 4,273 kr | 3,585 kr | 3,449 kr | 2,665 kr | 1,739 kr |
| Kópavogur | 4,221 kr | 4,020 kr | 3,594 kr | 2,932 kr | 2,526 kr | 1,626 kr |
| Mosfellsbær/Seltjarnarnes/Kjós | 4,733 kr | 4,226 kr | 3,532 kr | 2,981 kr | 2,551 kr | 1,695 kr |
| Reykjavíkurborg | 4,420 kr | 4,299 kr | 3,696 kr | 3,238 kr | 2,994 kr | 2,023 kr |
| Rural municipalities | 3,209 kr | 2,716 kr | 2,293 kr | 1,970 kr | 1,723 kr | 1,530 kr |
| Capital-region neighbours | 3,900 kr | 3,505 kr | 3,122 kr | 2,731 kr | 2,271 kr | 1,563 kr |
| Other capital-region towns | 4,115 kr | 3,965 kr | 3,578 kr | 3,276 kr | 2,739 kr | 2,038 kr |
Average prices in Iceland
Average prices in Iceland run highest for restaurant meals and lowest for basic groceries bought at a supermarket rather than eaten out: a kilogram of beef costs $422, close to the $302 charged for an inexpensive restaurant meal, while a litre of milk is $22 and a loaf of bread $42. A meal for two at a mid-range restaurant runs to $1362 - more than four times an inexpensive one.
Everyday services add up quickly on top of groceries: a monthly public transport pass costs $942, a gym membership $982, and a combined mobile-plus-broadband bill about $1172 a month.
How much does it cost to buy a car in Iceland
A new compact car (Volkswagen Golf 1.5 or similar) costs $51,0182, and a mid-size sedan (Toyota Corolla 1.6 or similar) $53,9752, per Numbeo's Reykjavík prices - broadly in line with new-car prices across Western Europe once Iceland's import duties and VAT are included. Running one costs $22 a litre for gasoline, equivalent to about $7.48 a US gallon.
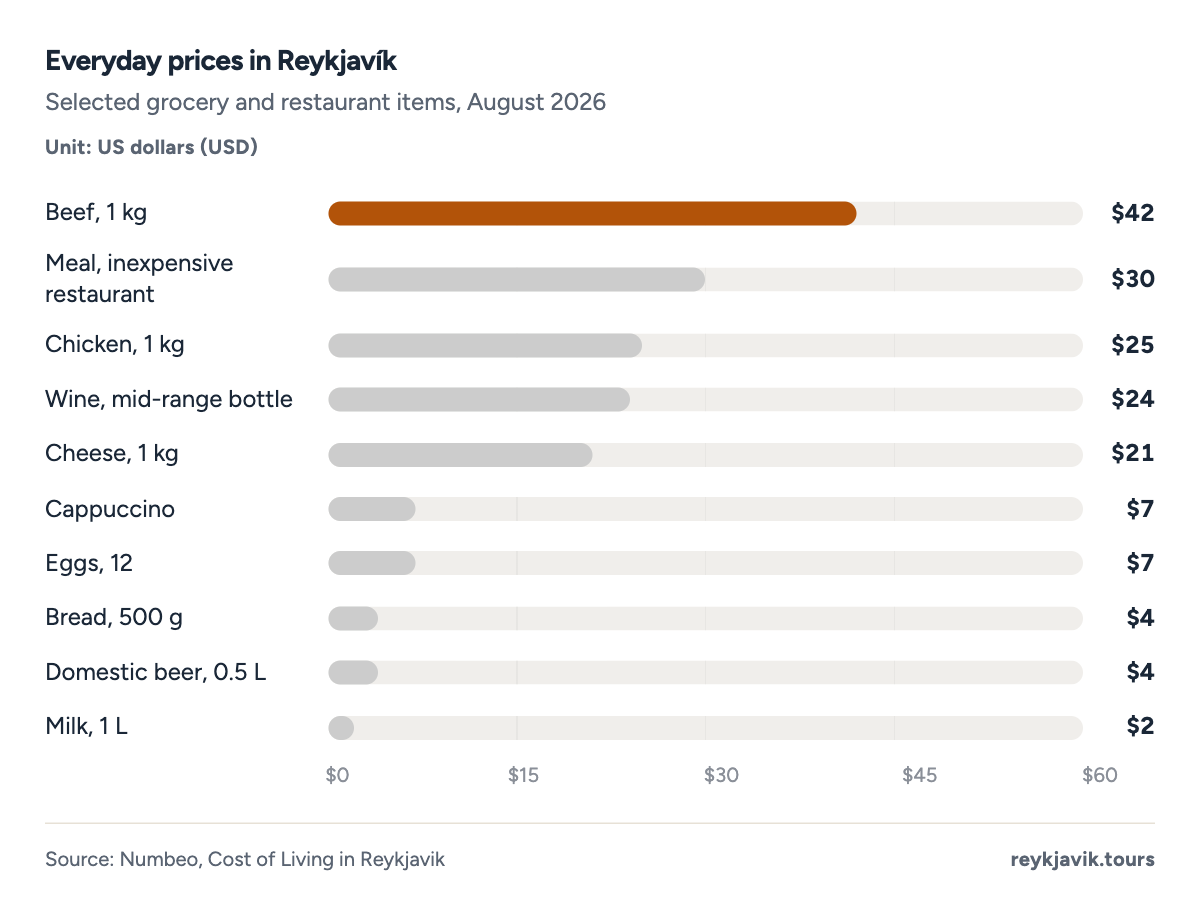
- Beef is the most expensive item shown, at $42 a kilogram.
- Milk is the cheapest, at $2 a litre.
| Running shoes, mid-range | 21,778 kr | $179 |
| Jeans (Levi's 501 or similar) | 19,262 kr | $159 |
| Gym membership, monthly | 11,855 kr | $98 |
| Monthly public transport pass | 11,400 kr | $94 |
| Broadband internet | 10,252 kr | $84 |
| Mobile plan (10GB+) | 3,998 kr | $33 |
| Cinema ticket | 2,395 kr | $20 |
| Cigarettes, pack of 20 | 1,700 kr | $14 |
| Taxi start (standard tariff) | 820 kr | $7 |
| Gasoline, 1 litre | 240 kr | $1.98 |
Utilities and energy: why heating is cheap
Set electricity and heating aside and Iceland's price level looks even higher: health services price at 233.51 and education at 211.51 (both reflect the cost of running mostly public systems, not what a resident pays out of pocket), restaurants and hotels at 167.31, and the broad housing category - which includes rent - at 164.01. But narrow that housing category down to electricity, gas and other fuels alone, and the index falls to just 64.21 - the cheapest of any category Eurostat measures for Iceland, and far below every other spending category on the page.
The reason is geothermal water. Roughly 90% of Icelandic homes are heated by geothermal district heating rather than imported oil or gas, and Byggðastofnun's annual comparison for a reference 140 m² house found the cheapest heating bill, in Seltjarnarnes in the capital region, at just 75,000 kr7 a year. Homes without access to a geothermal network pay far more: heating with oil on the island of Grímsey cost 246,000 kr7 a year, more than three times as much. Electricity for lighting and appliances is more uniform, from 87,000 kr7 a year in the capital region to 120,000 kr7 in parts of rural Iceland.
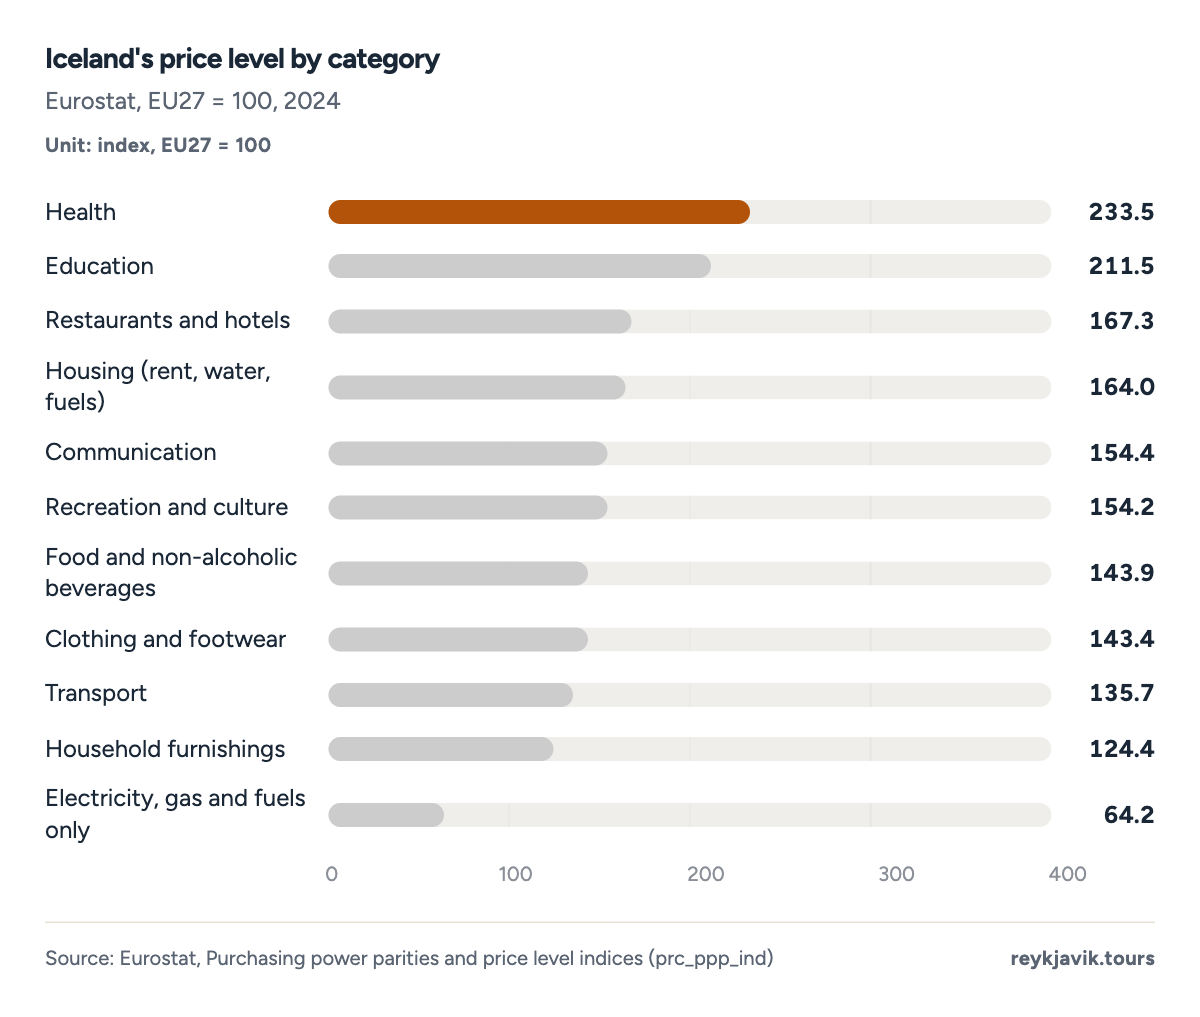
- Electricity, gas and fuels score just 64.2, the cheapest category measured.
- Health and education score highest, but that reflects the cost of running public services, not household bills.
| Electricity, cheapest (capital region) | 87,000 | $717 |
| Electricity, most expensive urban area | 107,000 | $882 |
| Electricity, rural areas (range) | 116,000–120,000 | $956–$989 |
| Heating, cheapest (Seltjarnarnes, geothermal) | 75,000 | $618 |
| Heating, direct electric with heat pump | 99,000 | $816 |
| Heating, direct electric without heat pump | 197,000 | $1,624 |
| Heating, most expensive (Grímsey, oil) | 246,000 | $2,028 |
Salary, tax and take-home pay
Covering the budgets above depends on Icelandic wages, which have grown fast: mean total monthly earnings for full-time employees reached 1,058,000 kr8 ($8,242) in 2025, up from 563,000 kr8 in 2014 - a rise of 88% in 11 years. The median, less pulled up by high earners, was 948,000 kr8 ($7,385) in 2025.
Iceland's 2026 income tax has three bands - 31.49%9 up to 498,122 kr a month, 37.99%9 up to 1,398,450 kr, and 46.29%9 above that - plus a personal tax credit of 72,492 kr9 a month and a mandatory 4% pension contribution. Together they mean a worker on the mean wage of 1,058,000 kr takes home about 734,693 kr9, or 69.4% of gross pay; someone earning the retail-sector starting wage of 481,643 kr keeps a higher 80.8%, since Iceland's tax credit shelters more of a smaller pay cheque. There is no statutory minimum wage; collective agreements set wage floors instead, currently at least 23,750 kr9 an hour under the main labour-federation agreement.
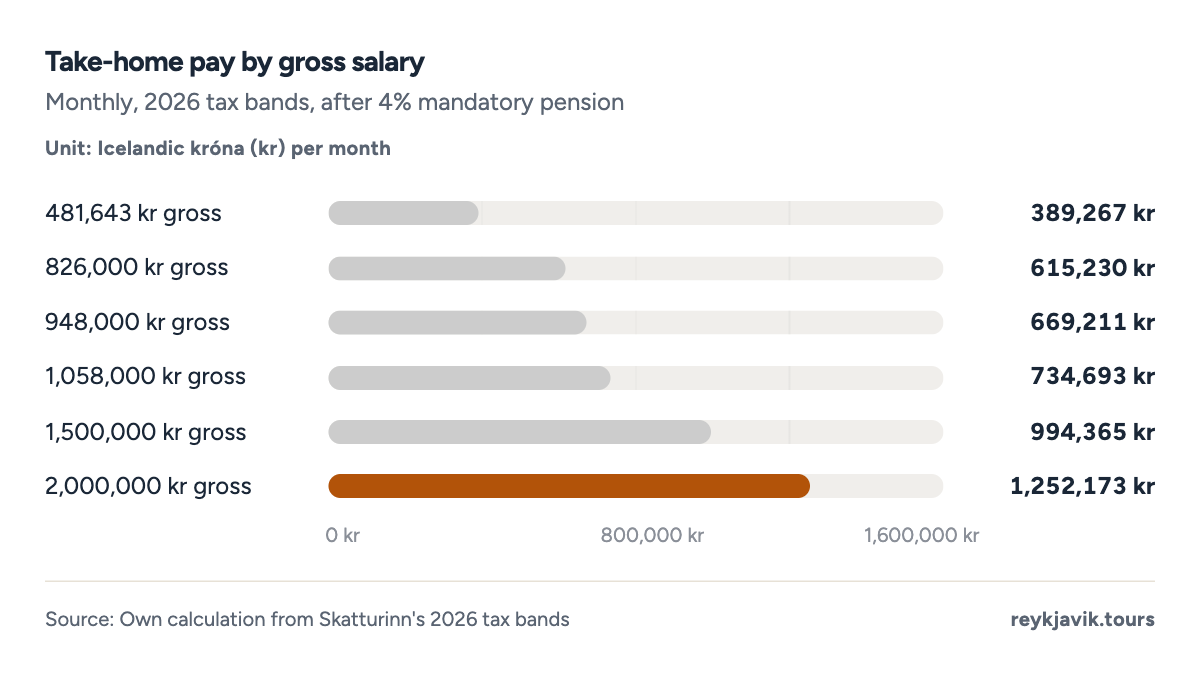
- Take-home pay ranges from 62.6% of gross at the top band to 80.8% at the bottom.
- On the mean wage of 1,058,000 kr, take-home pay is 734,693 kr.
- Mean
- Median
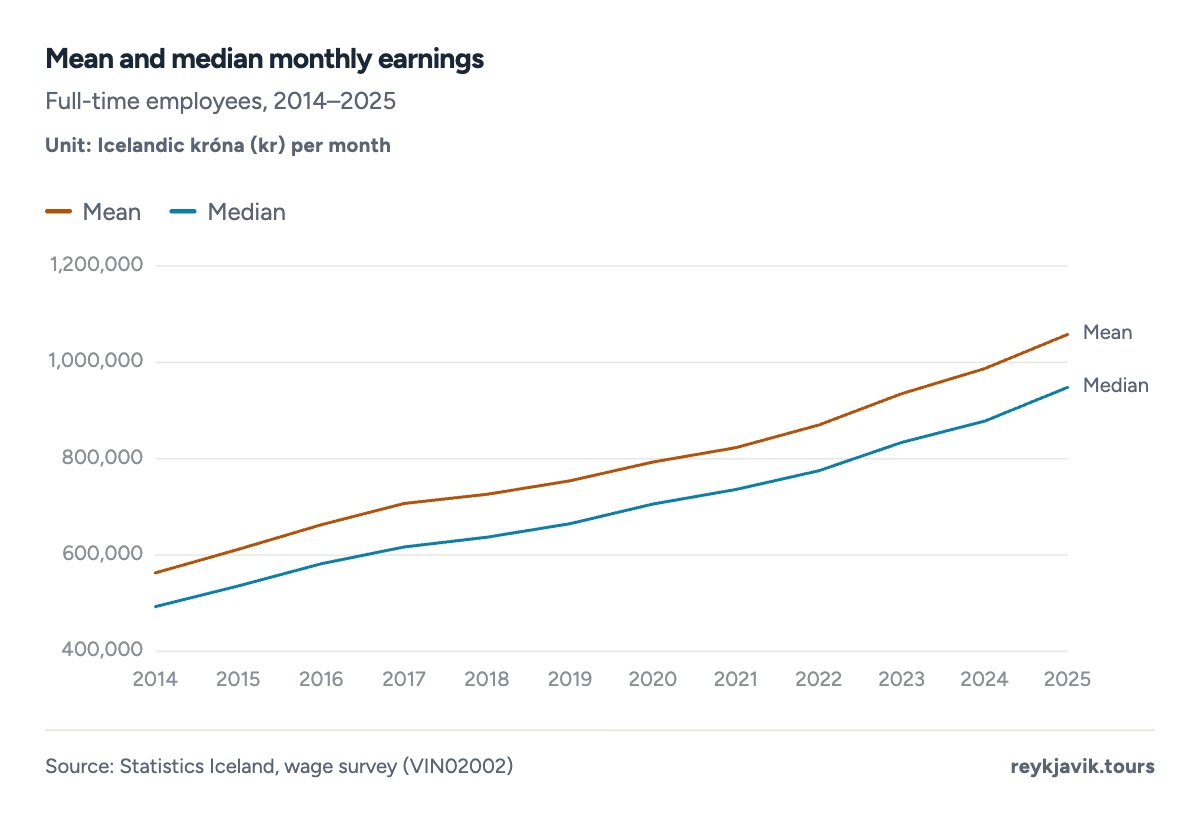
- Mean earnings rose from 563,000 kr in 2014 to 1,058,000 kr in 2025.
- The gap between mean and median, 110,000 kr in 2025, shows high earners pull the average up.
| 481,643 kr | 389,267 kr | 80.8% | $3,208 |
| 826,000 kr | 615,230 kr | 74.5% | $5,071 |
| 948,000 kr | 669,211 kr | 70.6% | $5,516 |
| 1,058,000 kr | 734,693 kr | 69.4% | $6,055 |
| 1,500,000 kr | 994,365 kr | 66.3% | $8,196 |
| 2,000,000 kr | 1,252,173 kr | 62.6% | $10,320 |
| 2014 | 563,000 kr | $4,822 | 493,000 kr | $4,223 |
| 2015 | 612,000 kr | $4,642 | 536,000 kr | $4,065 |
| 2016 | 663,000 kr | $5,494 | 582,000 kr | $4,823 |
| 2017 | 707,000 kr | $6,621 | 617,000 kr | $5,778 |
| 2018 | 726,000 kr | $6,699 | 637,000 kr | $5,877 |
| 2019 | 754,000 kr | $6,148 | 665,000 kr | $5,422 |
| 2020 | 793,000 kr | $5,862 | 706,000 kr | $5,219 |
| 2021 | 823,000 kr | $6,478 | 736,000 kr | $5,793 |
| 2022 | 870,000 kr | $6,423 | 775,000 kr | $5,721 |
| 2023 | 935,000 kr | $6,776 | 834,000 kr | $6,044 |
| 2024 | 987,000 kr | $7,156 | 878,000 kr | $6,366 |
| 2025 | 1,058,000 kr | $8,242 | 948,000 kr | $7,385 |
Wages have grown faster than prices, but not every year. Adjusting mean earnings for inflation with Statistics Iceland's own consumer price index, real wages rose 21%8 between 2014 and 2025, peaking at 23% above their 2014 level in 2020 before the inflation surge of 2022–2023 briefly ate into the gain.
- Nominal wages
- Real wages (inflation-adjusted)
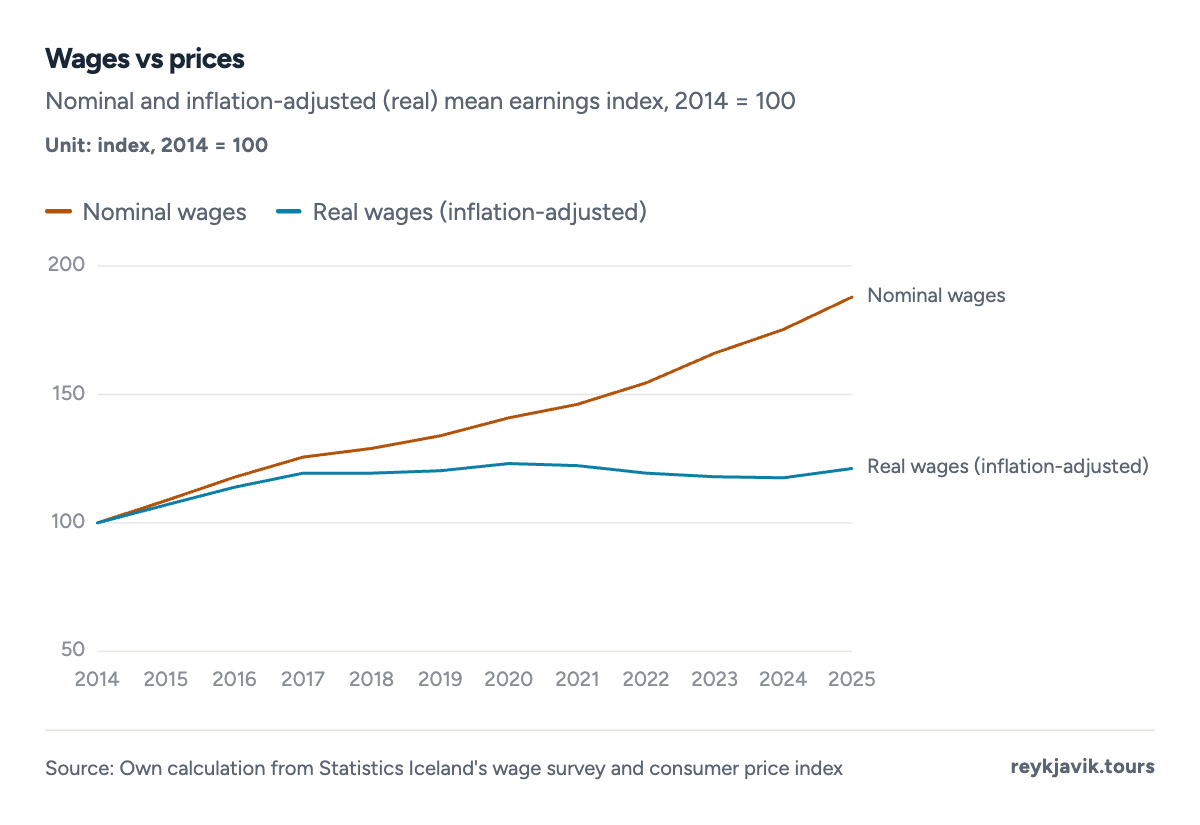
- Real wages were 21% higher in 2025 than in 2014.
- The real-wage gain peaked in 2020 and narrowed during the 2022–2023 inflation surge.
How much money do you need to move to Iceland
Moving to Iceland from outside the European Economic Area means clearing a financial bar before a residence permit is even considered. The Directorate of Immigration requires a single adult to show at least 259,951 kr10 ($2,143) a month in income or savings, and a couple 415,922 kr10 ($3,428) - both above the $3,679–$8,927 monthly budgets estimated earlier, so the requirement itself covers ordinary living costs. Applicants from outside the EEA must also carry private health insurance worth at least 2,000,000 kr10 for their first months in the country, until public health cover begins.
On top of the minimum-support test, every permit carries its own one-time fee: a family-reunification permit costs 110,000 kr10, a work permit 80,000 kr10, and a student permit 70,000 kr10. Permanent residence, available after several years on a qualifying permit, adds a further 60,000 kr10 per adult. None of these fees is refunded if an application is refused.
How much does it cost to immigrate to Iceland
Approval takes time as well as money: the Directorate of Immigration's 2025 averages show first work-based applications processed in about 2 months10, family-reunification cases in 7.5 months10, and permanent-residence applications in 8.5 months10 - months in which an applicant must keep meeting the income and insurance requirements above without yet being able to work freely in every case.
How much does it cost to move to Iceland from US
Iceland-specific shipping quotes are scarce, but general international relocation pricing gives a workable range: moving a household from the United States overseas typically costs $6,30011 to $15,90011, depending on shipment size and whether goods travel by sea or air freight. For a single arrival with only luggage, that shipping cost disappears entirely, leaving the permit fees and minimum-support requirement above as the real price of moving from the US to Iceland.
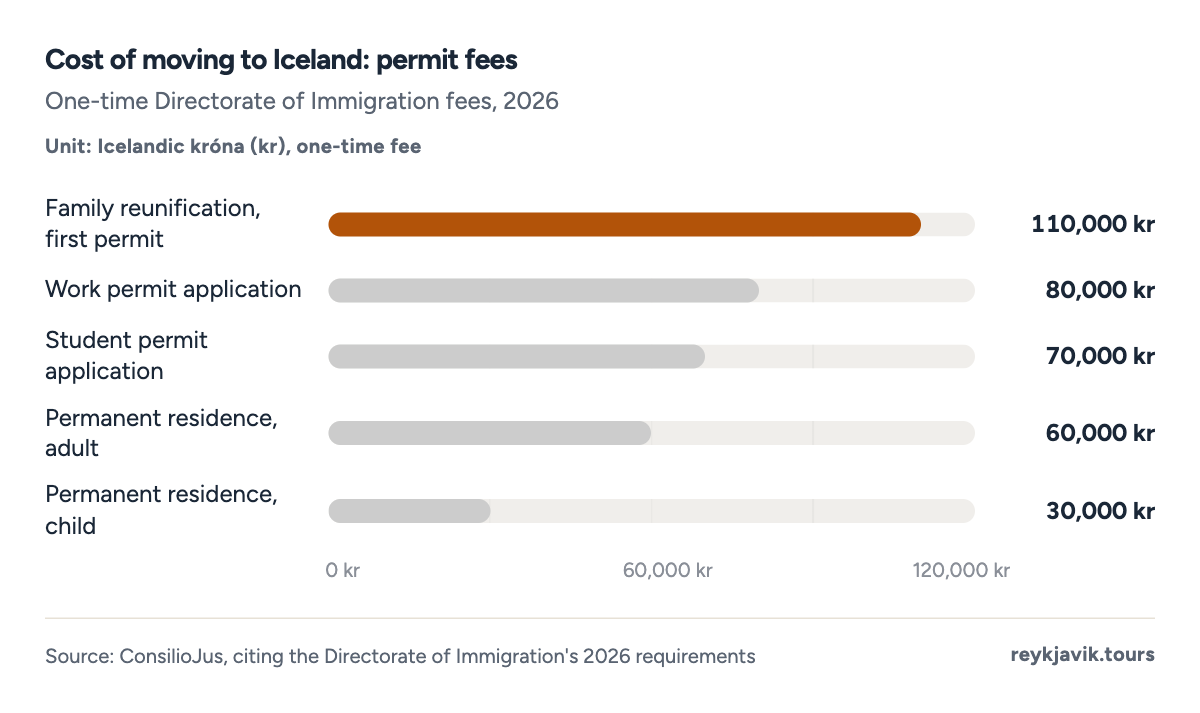
- A family-reunification permit costs the most to file, 110,000 kr.
- Permanent residence for a child is the cheapest fee shown, at 30,000 kr.
| Minimum support, single adult (per month) | 259,951 kr | $2,143 |
| Minimum support, couple (per month) | 415,922 kr | $3,428 |
| Health insurance requirement (one-time) | 2,000,000 kr | $16,484 |
| Work permit application fee | 80,000 kr | $659 |
| Student permit application fee | 70,000 kr | $577 |
| Family reunification, first permit fee | 110,000 kr | $907 |
| Permanent residence fee, adult | 60,000 kr | $495 |
| Permanent residence fee, child | 30,000 kr | $247 |
| International move from the US (shipping, range) | - | $6,300–$15,900 |
Healthcare and childcare costs
Iceland's public healthcare system caps what any patient pays in a month: a general patient pays at most 37,794 kr12 ($311) before the state covers the rest, dropping to just 6,299 kr12 a month for any further care that year. The cap is lower still for children aged 2 to 18 and for elderly or disabled patients, at 25,198 kr12, and children under 2 pay nothing at all.
Childcare shows the same pattern of a heavily subsidised public system next to a far pricier private one. Reykjavík's municipal preschools are tuition-free for the first 36 hours a week; a family using a full 7-hour day pays only the meal fee, 15,290 kr13 ($126) a month, rising to 53,290 kr13 for an 8.5-hour day once the tuition charged for hours beyond 36 a week is added. Numbeo's estimate for a private full-day preschool, by contrast, is 144,524 kr2 ($1,191) a month per child - almost 9 times the public fee.
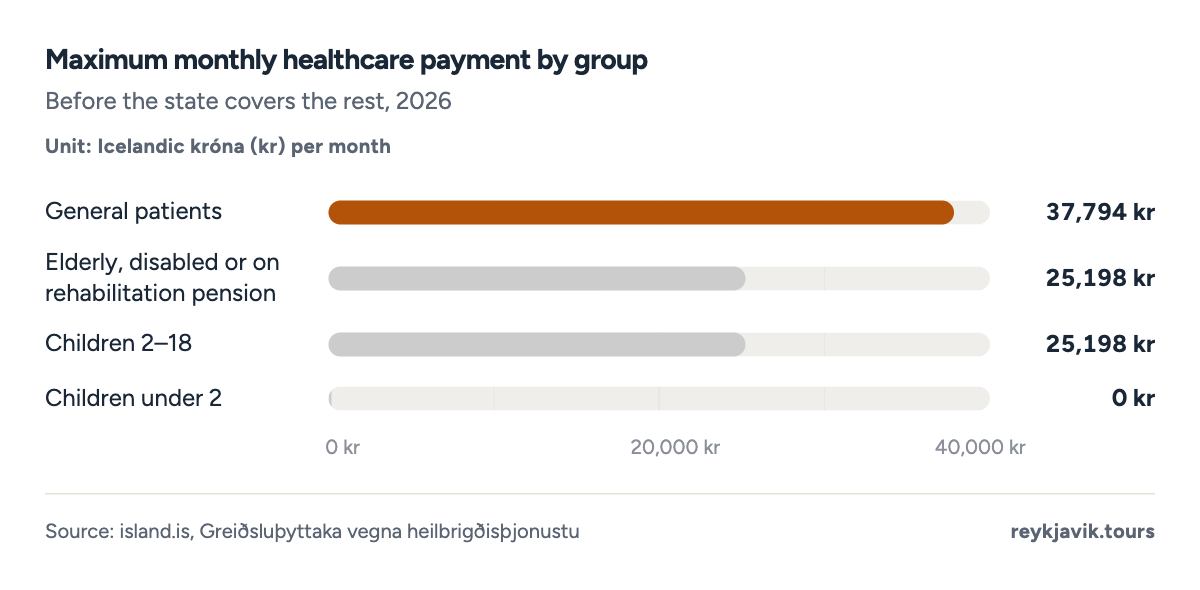
- General patients pay at most 37,794 kr a month for healthcare.
- Children under 2 pay nothing at all.
| General patients | 37,794 kr | 6,299 kr |
| Elderly, disabled or rehabilitation pension | 25,198 kr | 4,331 kr |
| Children 2–18 | 25,198 kr | 4,331 kr |
| Children under 2 | 0 kr | 0 kr |
| Private full-day preschool (Numbeo estimate) | 144,524 kr | $1,191 |
| Reykjavík public preschool, 8.5 h/day | 53,290 kr | $439 |
| Reykjavík public preschool, 7 h/day (36 h/week, tuition-free) | 15,290 kr | $126 |
What the numbers mean for daily life
Every figure above points to the same trade-off: Iceland's wages are among the highest in the world, and so are its prices, so the two mostly cancel out for people who already live and earn here. Numbeo's purchasing-power index for Iceland, 113.6, sits above the United States' 144.5 precisely because local salaries keep pace with local prices. The budgets above matter most for people arriving from lower-wage countries or living on savings, where Iceland's high prices are not offset by an Icelandic paycheck.
How much does Iceland pay you to live there? As a government policy, nothing: there is no national relocation grant or cash payment for moving to Iceland. The closest widely reported example was a private marketing stunt, not a government programme - the Icelandic yogurt company Siggi's offered $50,000 in 2022 to one person willing to move to Iceland and run its social media for a few months.14 Anyone budgeting to move should plan around the costs documented on this page, not around getting paid to arrive.
Conclusions
- Iceland is genuinely one of the most expensive places to live, not just to visit: its overall price level (172.7, EU27 = 100) ranks second in Europe on Eurostat's official data and 7th in the world on Numbeo's crowd-sourced index, both above Norway, Denmark and the United States.
- Housing drives the gap more than anything else. It takes 30.3% of the average household budget, nearly double food's 15.4% share, and rent alone accounts for roughly half of a single person's total monthly cost of living.
- High wages soften the blow for residents but not for newcomers. Mean earnings rose 88% between 2014 and 2025, keeping pace with prices, while anyone moving from abroad must first prove income well above ordinary living costs just to qualify for a permit.
- Public services quietly subsidise the household budget. Subsidised preschool, a capped healthcare bill and geothermal heating an entire order of magnitude cheaper than oil keep several of the biggest potential expenses far below what the headline price-level numbers suggest.
- There is no shortcut: no government pays newcomers to move to Iceland, so the realistic way to plan a move is the budget built in this report - rent, everyday spending, taxes and permit costs together, not a single average number.
Methodology
- Prices 2026
- 17 charts, 12 tables
- 15 sources
- Checked Sept 16, 2026
Definition. “Cost of living” here means ordinary recurring household spending (rent, food, utilities, transport, healthcare, childcare) plus, for prospective movers, the one-time and ongoing costs the Icelandic state requires for a residence permit.
Data sources. Monthly budgets and everyday prices from Numbeo's crowd-sourced Reykjavík data;2 world and Europe comparisons from Numbeo's Cost of Living Index5 and Eurostat's price level indices;1 rent from the Housing and Construction Authority's Rental Price Viewer;3 household spending shares and CPI weights from Statistics Iceland;[^statice_hbs]6 wages from Statistics Iceland's wage survey;8 tax bands from Skatturinn;9 healthcare co-payment caps from island.is;12 preschool fees from Reykjavík City;13 home energy costs from Byggðastofnun and Orkustofnun;7 and immigration requirements from ConsilioJus, an immigration-law information site citing the Directorate of Immigration.10
Calculations. Single/family budget totals add Numbeo's rent figures to its excl.-rent estimates. Category breakdowns of those totals subtract Numbeo's own monthly utilities, mobile, broadband and gym figures from the excl.-rent estimate, with the remainder labelled food, transport and other spending; the family chart assumes two adult gym memberships. The Household Budget Survey's 2013–2016 total is inflated to September 2026 prices using the ratio of the latest available consumer price index (2026M08 = 694.6) to the index for 2015. Take-home pay applies Skatturinn's 2026 tax bands and personal credit after a 4% mandatory pension deduction. All USD conversions use the Central Bank of Iceland's mid-rate of 121.33 kr on 15 Sept 2026;15 wage-by-year figures instead use each year's own average rate. The price-level trend line is a least-squares fit to 1995–2024 with a 95% prediction range, projected to 2050.
Limitations. Numbeo's figures are crowd-sourced (624 Reykjavík price entries from 89 contributors) and can shift from month to month; they are used because no Icelandic authority publishes an equivalent single figure. Statistics Iceland has not repeated its Household Budget Survey since the 2013–2016 round, so category shares before 2026 are the most recent official ones available, not current. Eurostat's health and education price levels reflect the cost of running mostly public systems, not what a resident pays out of pocket. HMS rent data may overstate average rent by about 5% because informal agreements between friends or family are under-represented in the register, and the register did not yet cover the full rental market as of August 2026.
Sources
- Eurostat. “Purchasing power parities and price level indices (prc_ppp_ind).” European Commission. ec.europa.eu. Accessed 16 Sept. 2026. Back to text
- Numbeo. “Cost of Living in Reykjavik.” Numbeo, 28 Aug 2026. numbeo.com. Accessed 16 Sept. 2026. Back to text
- Housing and Construction Authority (HMS). “Rental Price Viewer (Leiguverðsjá), data via husgreind.is.” HMS / husgreind.is, Aug 2026. husgreind.is. Accessed 16 Sept. 2026. Back to text
- Statistics Iceland (Hagstofa Íslands). “Average household expenditure and size by residence, 2000–2016 (VIS05302).” Statistics Iceland. px.hagstofa.is. Accessed 16 Sept. 2026. Back to text
- Numbeo. “Cost of Living Index by Country, 2026 Mid-Year.” Numbeo. numbeo.com. Accessed 16 Sept. 2026. Back to text
- Statistics Iceland (Hagstofa Íslands). “Consumer price index: total series and category weights (VIS01000, VIS01306).” Statistics Iceland. px.hagstofa.is. Accessed 16 Sept. 2026. Back to text
- Byggðastofnun (Icelandic Regional Development Institute). “Samanburður á orkukostnaði heimila árið 2023 (calculations by Orkustofnun).” Byggðastofnun, 30 Jan 2024. byggdastofnun.is. Accessed 16 Sept. 2026. Back to text
- Statistics Iceland (Hagstofa Íslands). “Wage survey: total earnings by sector, occupation and sex (VIN02002).” Statistics Iceland, 13 May 2026. px.hagstofa.is. Accessed 16 Sept. 2026. Back to text
- Skatturinn (Iceland Revenue and Customs). “2026 income tax schedule (tax bands, personal credit).” Skatturinn. skatturinn.is. Accessed 16 Sept. 2026. Back to text
- ConsilioJus. “Iceland Residence Permit 2026: Types, Requirements & Costs.” ConsilioJus, 7 Sept 2026. consiliojus.com. Accessed 16 Sept. 2026. Back to text
- ReloAdvisor. “International moving costs 2026: real prices from 1,000+ quotes.” ReloAdvisor. blog.reloadvisor.org. Accessed 16 Sept. 2026. Back to text
- island.is. “Hvað þarf að borga fyrir heilbrigðisþjónustu? – Greiðsluþáttaka.” Icelandic government (island.is). island.is. Accessed 16 Sept. 2026. Back to text
- Reykjavík City (Reykjavíkurborg). “Leikskólagjöld (preschool fee schedule).” Reykjavík City, 1 Apr 2026. reykjavik.is. Accessed 16 Sept. 2026. Back to text
- Martinez, A.. “You could get paid $50,000 to move to Iceland and enjoy life.” NPR, 22 Sept 2022. npr.org. Accessed 16 Sept. 2026. Back to text
- Central Bank of Iceland (Seðlabánki Íslands). “Official USD/ISK reference exchange rate.” Central Bank of Iceland, 15 Sept. 2026. sedlabanki.is. Accessed 16 Sept. 2026. Back to text
About the author
Laufey turns public statistics on tourism and travel into research people can check and cite.
Every figure on this page links to its source. How we research
Related research
More data on Iceland's weather and travel from Reykjavik Tours.
- EconomyAverage Salary in Iceland (2026 Data)$8,242 average monthly salary, full-timeRead the research →
- HousingAverage Rent in Iceland (2026 Data)ISK 269k average monthly rent in IcelandRead the research →
- EconomyIceland GDP per Capita: Nominal, PPP and Ranking (2026 Data)$98,323 GDP per person in Iceland, 2025Read the research →
- HousingHow Much Is a House in Iceland? (2026 Data)$467k-779k typical capital-region apartmentRead the research →
- Travel costsHow Much Are Hotels in Iceland? (2026 Data)$196 a night for a typical hotel roomRead the research →
- PricesHow Much Is Food in Iceland? (2026 Data)44% above the EU average for food pricesRead the research →