How Much Is Food in Iceland? (2026 Data)
Grocery, restaurant, coffee, beer, wine and cigarette prices, what each supermarket charges, how fast food prices rise, and a daily food budget.
- Published
- Updated
- 16 sources
- 128 statistics
- 11 min read

- M.Sc. in Atmospheric Sciences, University of Iceland (Háskóli Íslands), with a minor thesis on North Atlantic storm-track variability
- Former research assistant at the Icelandic Meteorological Office (Veðurstofa Íslands), working on subarctic climate modeling and volcanic-ash dispersion forecasting
- B.A. in Sociology, also from the University of Iceland, with fieldwork on rural depopulation and tourism's impact on small fishing communities (Westfjords focus)
- Grew up in Akureyri, spent seven years living in Reykjavík and two in a small village in the Westfjords - brings first-hand experience of Iceland's regional weather extremes and community life
- Fluent in Icelandic and English; has translated Icelandic Met Office public advisories for international outlets
- Published field notes and data-driven pieces on glacier retreat (Vatnajökull), aurora forecasting, and the socioeconomic effects of overtourism in the Golden Circle

- M.A. in Journalism, University of Iceland, with additional coursework in Environmental Communication at the University of Bergen (Norway), giving a comparative Nordic lens
- 12+ years in Icelandic media, including editorial roles at RÚV (Iceland's national broadcaster) covering weather-related public safety reporting (storms, volcanic eruptions, road closures)
- Former fact-checking lead for a travel-and-culture desk, specializing in verifying tourism statistics, safety advisories, and climate data against primary sources (Vedur.is, Statistics Iceland)
- Has overseen editorial standards for bilingual (Icelandic/English) publications, ensuring both cultural nuance and accuracy for international readers
- Advocate for citing primary sources (Icelandic Met Office, Icelandic Tourist Board / Ferðamálastofa) rather than secondhand reporting
Key findings
- 44%Food in Iceland costs 44% more than the EU average, the second highest of 36 European countries.
- 171.7Milk, cheese and eggs cost more in Iceland than anywhere else in Europe, at a price level of 171.7.
- $30A meal at an inexpensive restaurant in Reykjavík costs about $30.
- $14A half-litre of draught beer costs about $14 in a Reykjavík bar.
- 185%Alcohol in Iceland costs 185% more than the EU average, the highest in Europe.
- 40%Food prices in Iceland rose 40% in the five years to August 2026.
- 12%The same 25-item grocery basket cost 12% more at Nettó than at Prís in August 2026.
- 185 poundsIceland has 185 pounds of fish and seafood per person a year, the most in the world.
Iceland is the second most expensive country in Europe for food. Eurostat puts the price of food and non-alcoholic drinks at 143.91 against an EU average of 100, behind only Switzerland, and alcohol at 285.11, the highest of all 36 countries compared. For a visitor that means about $302 for a simple restaurant meal and $142 for a draught beer; for households, food takes 15.4%3 of the consumer price basket.
The price you pay depends heavily on where you buy. The same product can cost more than twice as much in one store as in another, and food prices have risen 40%4 in five years. This report brings together official price levels, the national consumer price index, taxes, supermarket surveys and menu prices to show what food and drink cost in Iceland in 2026, item by item.
Iceland vs Europe: food price levels
Eurostat's price level indices compare what the same basket of goods costs in each country, with the EU average set at 100. For food and non-alcoholic beverages in 2024, Switzerland scored 158.51, Iceland 143.91 and Norway 131.21. Denmark came in at 120.21, and Germany at 102.71. Food in Iceland costs about 44% more than the EU average.
The gap is widest for dairy and meat. Milk, cheese and eggs have a price level of 171.71, the highest in Europe, and meat 172.51, second only to Switzerland. Bread and cereals (150.81) also rank second, and fruit and vegetables (136.11) share second place with Norway. Fish is the exception: at 110.11, Iceland ranks only 8th1, below Denmark and Germany.
Drinks sit at the extremes. Non-alcoholic beverages such as soft drinks, juice and coffee have a price level of 129.41, seventh in Europe and below Norway and Denmark, while alcoholic drinks are the most expensive of any country in the comparison. Among the Nordic countries, Sweden is the cheapest for food at 106.41, so the same groceries cost roughly a third more in Iceland than in Sweden by this measure.
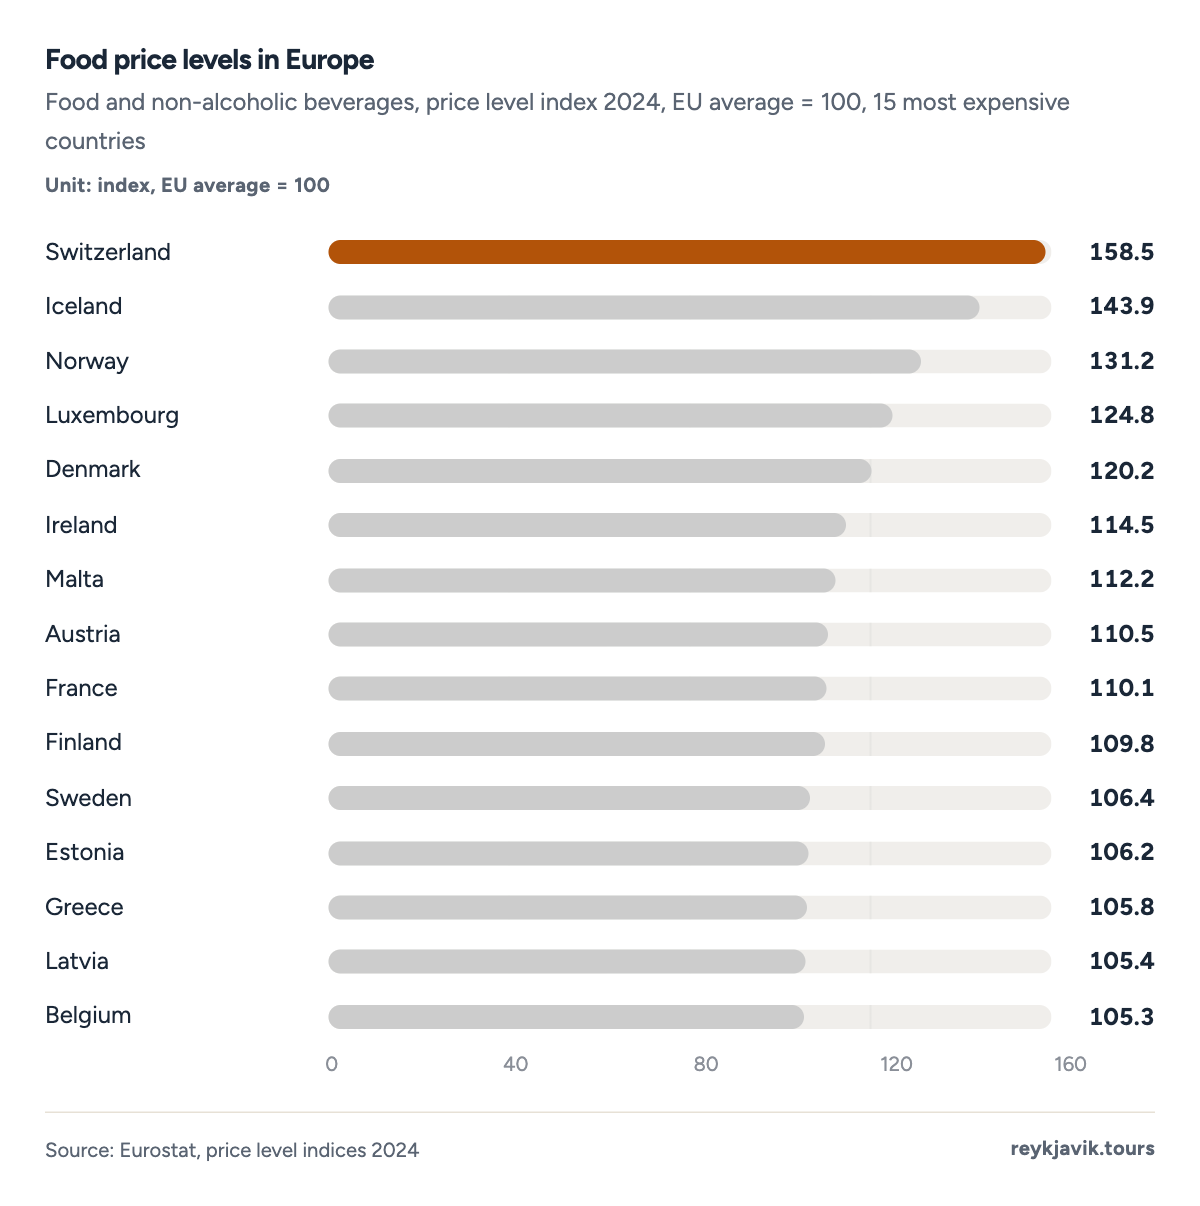
- Iceland scores 143.9, second only to Switzerland.
- Norway follows at 131.2.
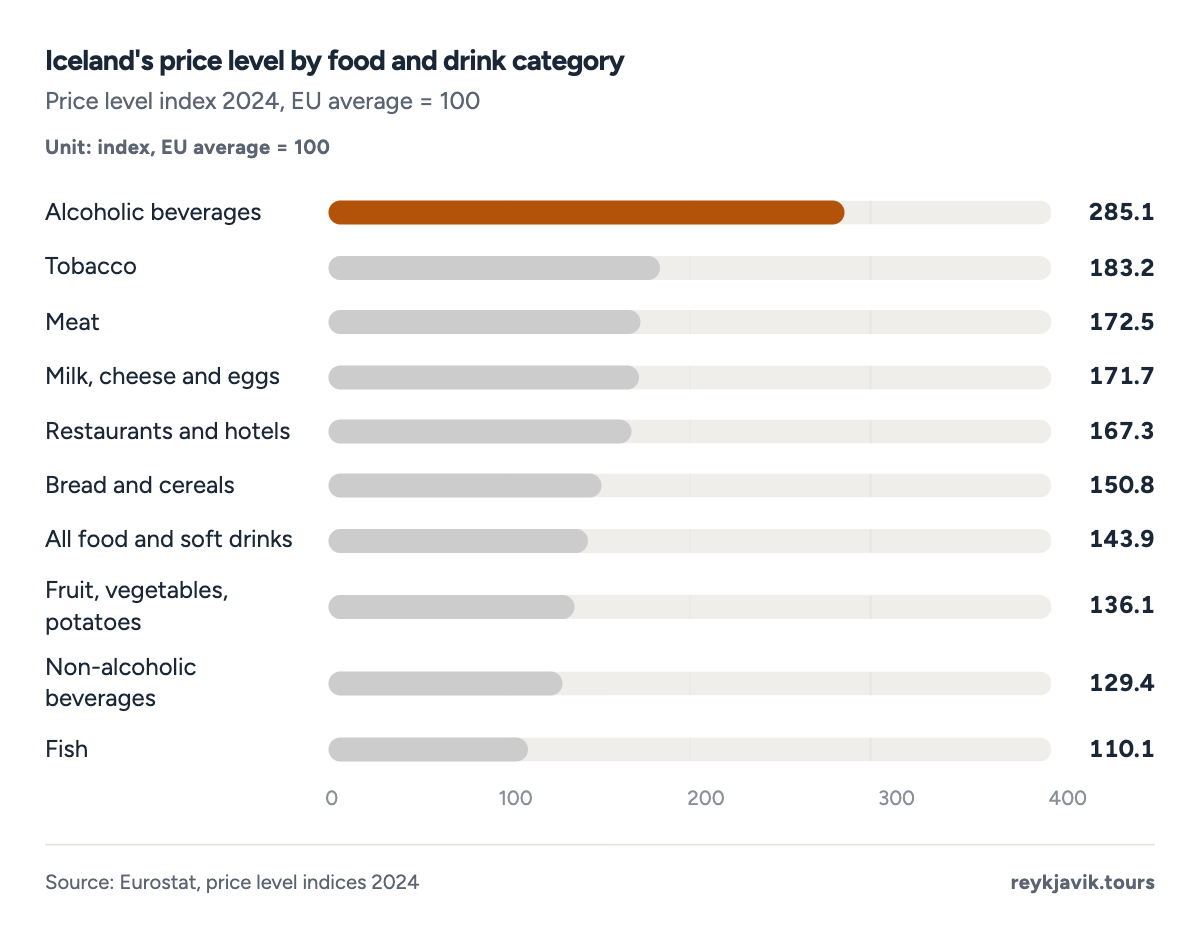
- Alcoholic drinks are the most expensive category at 285.1.
- Fish is the least expensive food category at 110.1.
| All food and soft drinks | 143.9 | 158.5 | 131.2 | 120.2 | 106.4 |
| Bread and cereals | 150.8 | 163.0 | 128.8 | 136.2 | 108.6 |
| Meat | 172.5 | 207.7 | 140.0 | 104.3 | 106.2 |
| Fish | 110.1 | 165.6 | 103.3 | 129.7 | 100.9 |
| Milk, cheese and eggs | 171.7 | 147.2 | 132.0 | 116.3 | 100.8 |
| Fruit, vegetables, potatoes | 136.1 | 137.0 | 136.1 | 111.5 | 115.7 |
| Non-alcoholic beverages | 129.4 | 135.2 | 139.1 | 130.5 | 104.7 |
| Alcoholic beverages | 285.1 | 152.7 | 225.8 | 124.6 | 145.8 |
| Tobacco | 183.2 | 132.8 | 210.5 | 124.0 | 104.0 |
| Restaurants and hotels | 167.3 | 170.8 | 140.0 | 147.6 | 116.7 |
Iceland's food price level relative to Europe has swung widely. The index stood at 175.91 in 2005, fell to 102.81 in 2009, and has been above 130 every year since 2015. Restaurants and hotels followed the same path, from 104.71 in 2009 to 167.31 in 2024.
Projection: linear trend of 2003–2024 yearly values, 95% prediction range. Our calculation, not a forecast.
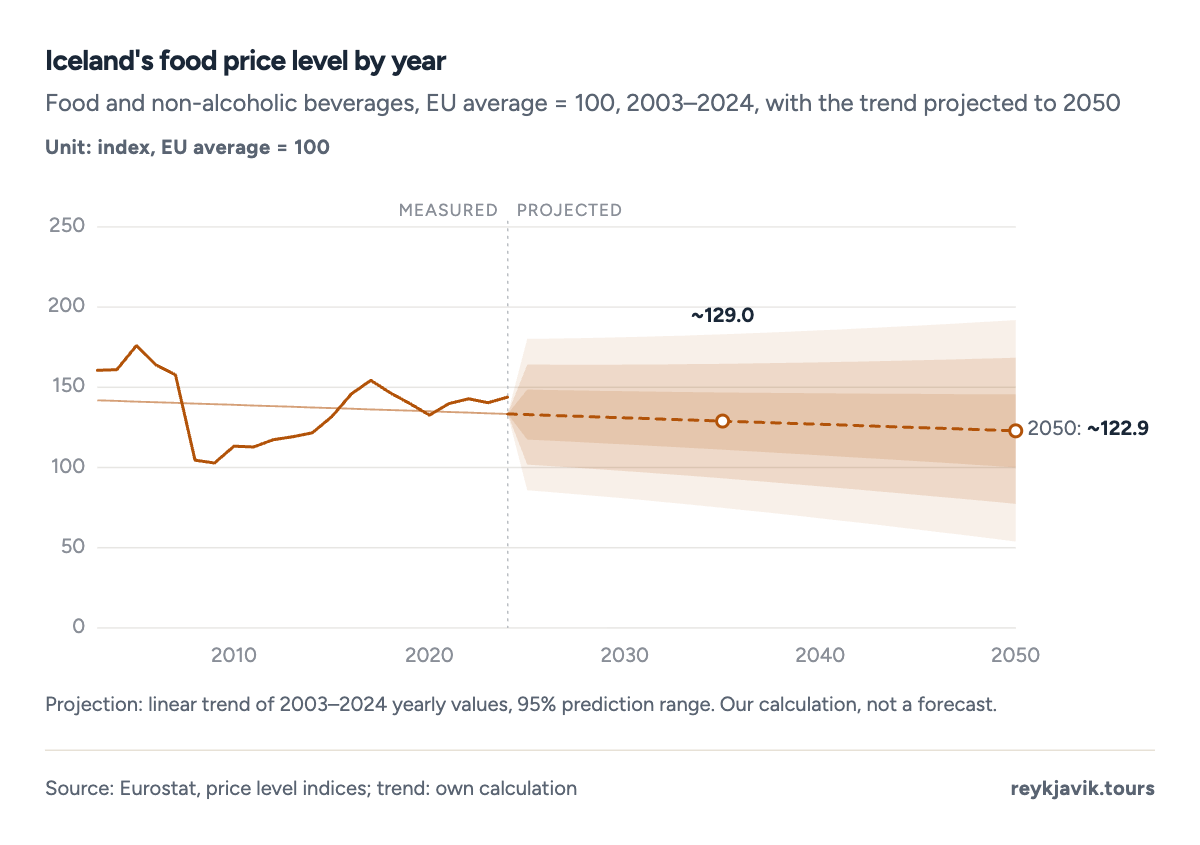
- The peak was 175.9 in 2005.
- The low was 102.8 in 2009.
How much are groceries in Iceland
Crowd-sourced prices collected by Numbeo in Reykjavík give a picture of everyday supermarket items. A litre of milk costs about $2.082 (ISK 252), a dozen eggs $7.202 and chicken fillets about $11.25 a pound2 (ISK 3,009 a kilo). Beef round is the most expensive staple at about $19.11 a pound2, and local cheese about $9.64 a pound2. Fruit costs less per pound: bananas cost about $1.29 a pound2.
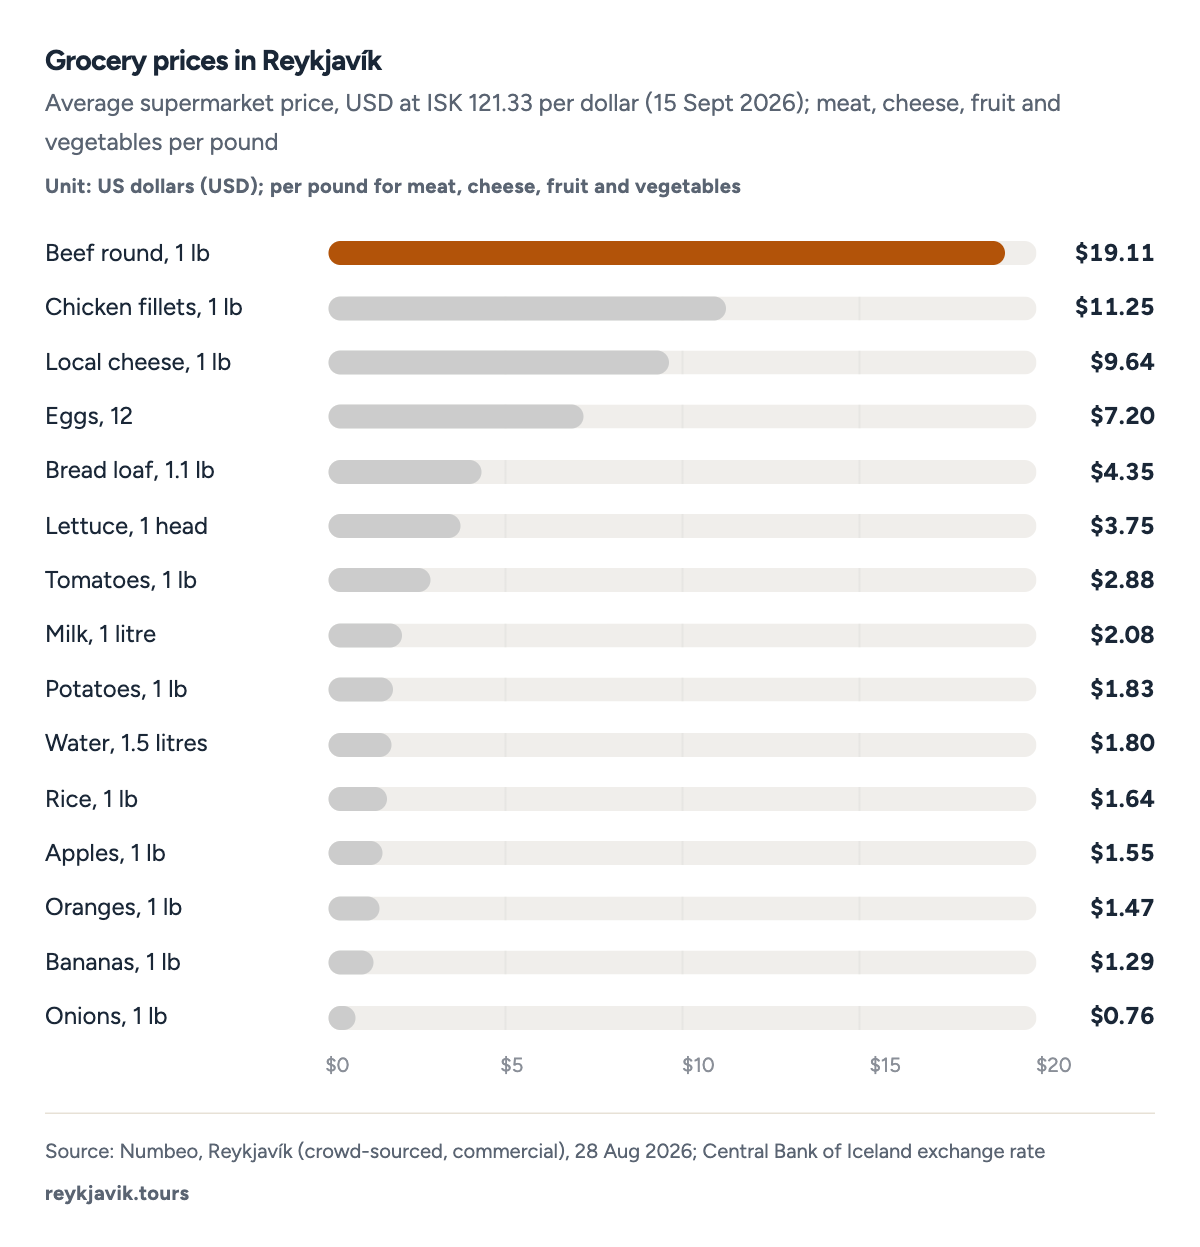
- Beef round costs $19.11 a pound.
- Milk costs $2.08 a litre.
| Milk (1 l) | $2.08 | 252 | 228–320 |
| Bread loaf (500 g) | $4.35 | 527 | 376–850 |
| Eggs (12) | $7.20 | 873 | 766–1,200 |
| Local cheese (1 kg) | $21.25 | 2,578 | 2,043–3,800 |
| Chicken fillets (1 kg) | $24.80 | 3,009 | 2,200–3,500 |
| Beef round (1 kg) | $42.12 | 5,111 | 3,200–7,000 |
| Rice (1 kg) | $3.61 | 438 | 289–700 |
| Apples (1 kg) | $3.42 | 415 | 283–689 |
| Bananas (1 kg) | $2.84 | 344 | 278–1,035 |
| Oranges (1 kg) | $3.24 | 394 | 309–650 |
| Tomatoes (1 kg) | $6.35 | 771 | 431–1,099 |
| Potatoes (1 kg) | $4.03 | 490 | 250–560 |
| Onions (1 kg) | $1.68 | 204 | 175–300 |
| Lettuce (1 head) | $3.75 | 455 | 262–570 |
| Water (1.5 l) | $1.80 | 218 | 147–300 |
Where you shop matters as much as what you buy. The price monitoring unit of ASÍ, the Icelandic Confederation of Labour, compared a basket of 25 common products in the four discount chains in August 2026. It cost ISK 17,4336 ($144) at Prís, ISK 18,396 at Bónus, ISK 18,767 at Krónan and ISK 19,5226 ($161) at Nettó, 12% more for the same basket. Across 248 identical products, Prís was cheapest on 2466.
A wider comparison of 561 products6 in ten stores found a median gap of 42%6 between the lowest and highest price for the same product. Taking the cheapest store as the base, prices at Bónus were on average 4%6 higher, at Krónan 5%6 and at Nettó about 10%, while Kjörbúðin and Hagkaup were about 30%6 higher. 10-11 had the highest price level. Average grocery prices rose just 0.14%6 from July to August 2026.
The gaps add up. ASÍ notes that a difference of just over ISK 2,000 on a weekly shop, like the one between Prís and Nettó, comes to more than ISK 100,0006 ($824) a year. On individual products the differences are larger still: for nearly eight in ten6 of the products sold in all ten stores, the highest price was at least 30% above the lowest. In an earlier survey in June 2026, the same litre of milk cost between ISK 259 and 3697 depending on the store.
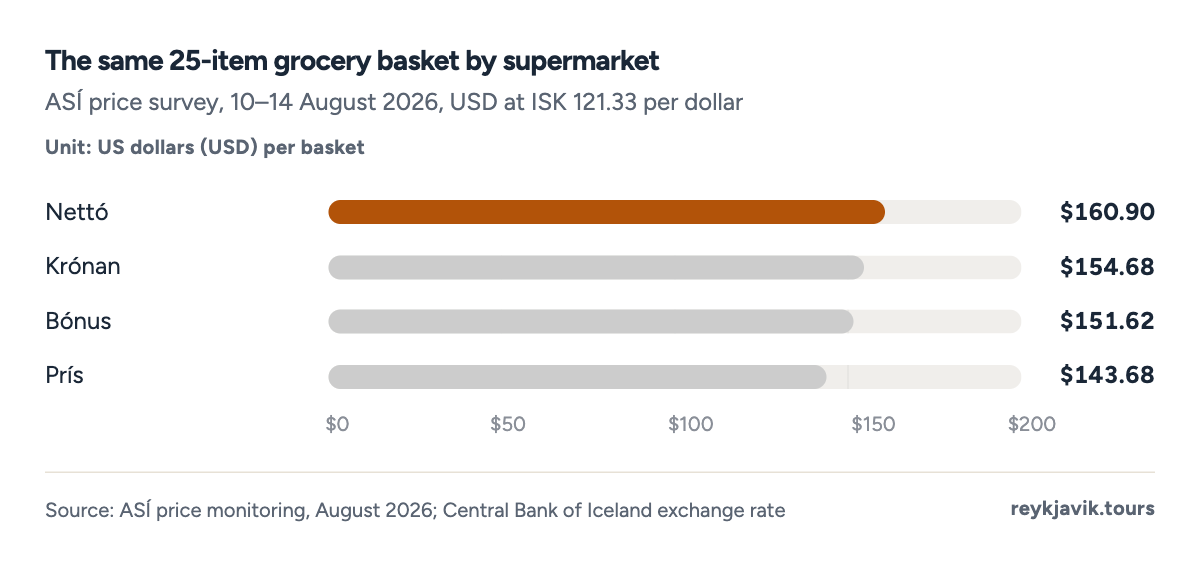
- Nettó charged $160.90 for the basket.
- Prís charged $143.68.
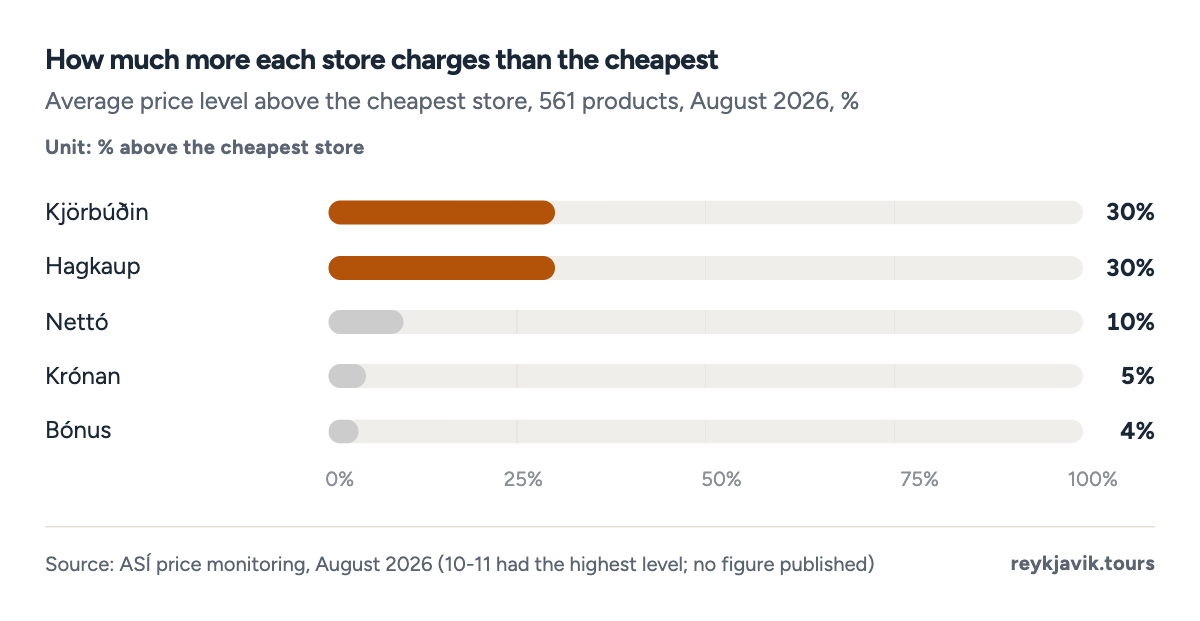
- Kjörbúðin and Hagkaup were about 30% above the cheapest store.
- Bónus was 4% above.
| Prís | 17,433 | $143.68 | cheapest |
| Bónus | 18,396 | $151.62 | +4% |
| Krónan | 18,767 | $154.68 | +5% |
| Nettó | 19,522 | $160.90 | about +10% |
| Kjörbúðin | not in basket | - | about +30% |
| Hagkaup | not in basket | - | about +30% |
| 10-11 | not in basket | - | highest |
| Mylla family bread (heimilisbrauð) | Prís | 349 ($2.88) | Krambúðin | 729 ($6.01) |
| Light milk, 1 litre | Prís | 266 ($2.19) | 10-11 | 419 ($3.45) |
| Felix ketchup | Prís | 309 ($2.55) | Kjörbúðin | 499 ($4.11) |
| Tunnock's Caramel Bar | Bónus | 98 ($0.81) | 10-11 | 469 ($3.87) |
| Bonaqua, forest berry | Prís | 124 ($1.02) | 10-11 | 329 ($2.71) |
How much is a gallon of milk in Iceland
Milk is sold by the litre in Iceland. At the Numbeo average of ISK 252 a litre, a gallon works out at about $7.872. ASÍ found a litre of light milk (léttmjólk) for ISK 2666 at Prís and ISK 419 at 10-11, which puts a gallon between about $8.30 and $13.076 depending on the store.
How much is a loaf of bread in Iceland
A 500 g (1.1 lb) loaf of white bread costs about $4.352 (ISK 527). A popular 770 g (1.7 lb) loaf, Mylla's heimilisbrauð, cost ISK 3496 ($2.88) at Prís but ISK 729 ($6.01) at Krambúðin in August 2026, more than twice as much.
How much is a candy bar in Iceland
The widest gap ASÍ recorded was on a chocolate-covered caramel bar: a Tunnock's Caramel Bar cost ISK 986 ($0.81) at Bónus and ISK 469 ($3.87) at 10-11, almost five times as much. Sugar, confectionery and desserts as a group cost 219%4 more than in March 1997.
How much is a meal in Iceland
A meal at an inexpensive restaurant in Reykjavík costs about $30.082 (ISK 3,650), with most reports between ISK 2,200 and 5,000. A three-course dinner for two at a mid-range restaurant costs about $1362, and a fast-food combo meal about $26.792.
Eurostat's price level for restaurants and hotels is 167.31, second only to Switzerland. Restaurant and café prices rose 39.7%4 in the five years to August 2026, and 5.0%4 in the last twelve months.
For a visitor, the cheapest restaurant option still costs more than a full day of self-catering groceries, which this report estimates at $17.51. Drinks cost more at the table too: a small bottle of water costs about $3.262 in a restaurant, while a 1.5-litre bottle costs $1.802 in a supermarket.
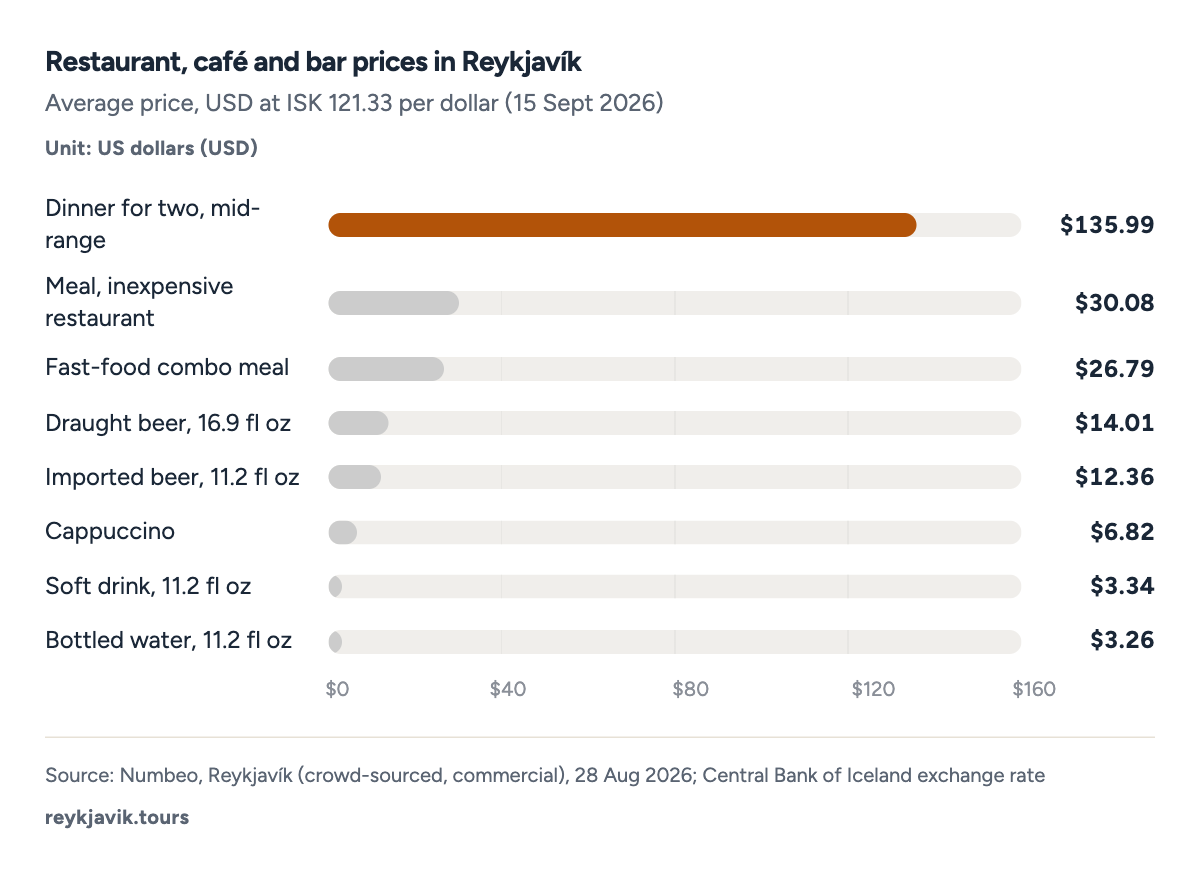
- A meal at an inexpensive restaurant costs $30.08.
- A cappuccino costs $6.82.
| Dinner for two, mid-range | $135.99 | 16,500 | 10,000–30,000 |
| Meal, inexpensive restaurant | $30.08 | 3,650 | 2,200–5,000 |
| Fast-food combo meal | $26.79 | 3,250 | 2,750–3,500 |
| Draught beer, 16.9 fl oz | $14.01 | 1,700 | 1,200–1,900 |
| Imported beer, 11.2 fl oz | $12.36 | 1,500 | 1,250–2,200 |
| Cappuccino | $6.82 | 828 | 560–950 |
| Soft drink, 11.2 fl oz | $3.34 | 406 | 300–600 |
| Bottled water, 11.2 fl oz | $3.26 | 396 | 260–600 |
| Hot dog, Bæjarins beztu | $7.25 | 880 | - |
| Hot dog and soft drink, Bæjarins beztu | $10.96 | 1,330 | - |
How much is a hot dog in Iceland
At the Bæjarins beztu hot dog stand in central Reykjavík, a hot dog costs ISK 8808 ($7.25) and a hot dog with a soft drink ISK 1,3308 ($10.96), according to the company's chief executive in March 2026, who said wages make up half of the stand's costs. A family deal of six hot dogs and four drinks costs ISK 3,5008 ($28.85).
How much is a cup of coffee in Iceland
A cappuccino in a Reykjavík café costs about $6.822 (ISK 828), with most reports between ISK 560 and 950. Coffee is the second-fastest-rising category in this report's five-year comparison: the price index for coffee rose 69.4%4 in five years, far more than food overall at 40.2%.
How much is alcohol in Iceland
Iceland has the most expensive alcohol in Europe. Its price level for alcoholic drinks is 285.11, ahead of Norway at 225.81 and Finland at 210.41, and almost three times the EU average. Tobacco is also expensive, at 183.21, fourth in Europe.
Taxes are a large part of the price. Every drink stronger than 2.25% pays an alcohol duty set per centilitre of alcohol: in 2026, ISK 156.459 for beer and ISK 142.509 for wine for each centilitre above 2.25%, and ISK 192.85 for spirits on all of the alcohol.10 Value added tax on food and alcohol is 11%11, against the standard rate of 24%. Outside bars and restaurants, beer, wine and spirits are sold in Vínbúðin shops and by private online sellers such as Heimkaup, Smáríkið and Santé, which a price-comparison site lists side by side.12
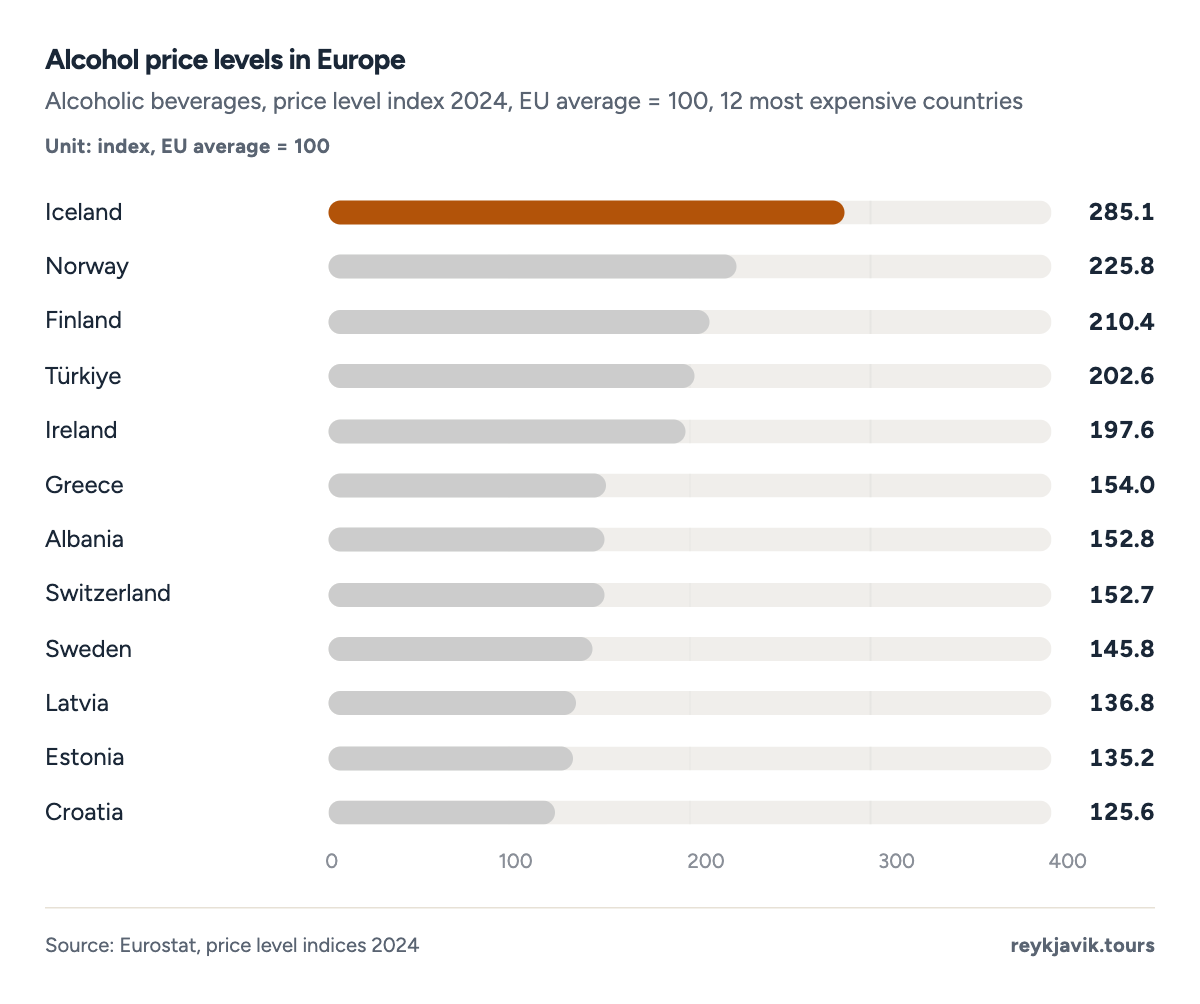
- Iceland is the most expensive at 285.1.
- Norway is second at 225.8.
How much is a beer in Iceland
A half-litre (16.9 fl oz) of draught beer in a Reykjavík bar costs about $14.012 (ISK 1,700), and a small bottle of imported beer about $12.362. In the shops it costs a third of that: a 500 ml can of Egils Gull, a 5% lager, is ISK 49912 ($4.11) at Vínbúðin, and between ISK 491 and 666 at private sellers.
Of the ISK 499, the alcohol duty is about ISK 21513 and VAT about ISK 49, so 53%13 of the shelf price is tax.
How much is a bottle of wine in Iceland
A mid-range bottle of wine costs about $23.902 (ISK 2,900) in the shops. For a 750 ml bottle at 12.5%, the duty alone is about ISK 1,09513 ($9.03), and with VAT taxes make up about 48%13 of that price. A 700 ml bottle of 40% spirits carries ISK 5,40013 ($44.51) in duty before any other cost. Over five years, wine prices rose 17.3%4 and beer prices 25.5%, both less than food.
How much are cigarettes in Iceland
A pack of 20 Marlboro costs about $14.012 (ISK 1,700). The tobacco duty is ISK 806.7010 per pack in 2026, and cigarettes carry the standard 24% VAT,11 so about 67%13 of the price is tax. Cigarette prices have risen 621%4 since March 1997, more than any food or drink category in this report.
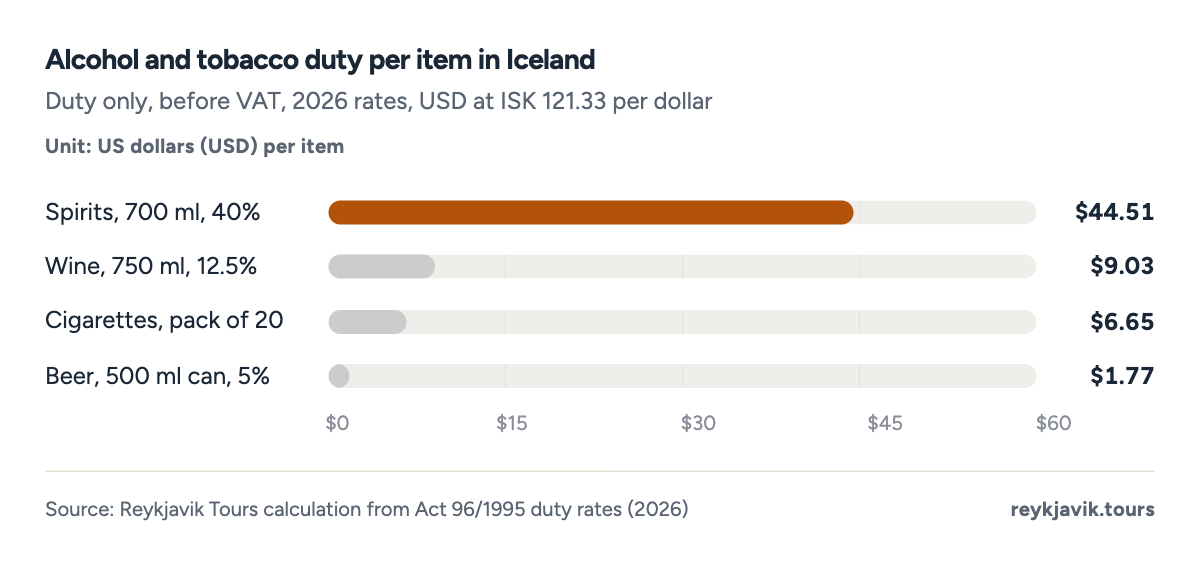
- A bottle of spirits carries $44.51 in duty.
- A can of beer carries $1.77.
| Beer, 500 ml can, 5% | 215 | $1.77 | 499 | 53% |
| Wine, 750 ml bottle, 12.5% | 1,095 | $9.03 | 2,900 | 48% |
| Spirits, 700 ml bottle, 40% | 5,400 | $44.51 | - | - |
| Cigarettes, pack of 20 | 807 | $6.65 | 1,700 | 67% |
Average cost of food in Iceland per day
To turn prices into a budget, this report builds three food days for one person from the prices above. The assumptions are listed in the methodology.
- Budget: $2813 a day. Self-catering from the supermarket for about $17.51 (bread, milk, eggs, cheese, chicken, rice, fruit, tomatoes and water), plus a hot dog and a soft drink.
- Mid-range: $11513 a day. Breakfast from the supermarket, a cappuccino, lunch at an inexpensive restaurant and a three-course dinner at a mid-range restaurant.
- Comfortable: $18613 a day. Two mid-range restaurant meals, two coffees and two draught beers.
Over a week, that is about $19713, $80413 and $1,30113 per person. Dinner at a mid-range restaurant, about $68 per person, is the largest single line in the two higher budgets.
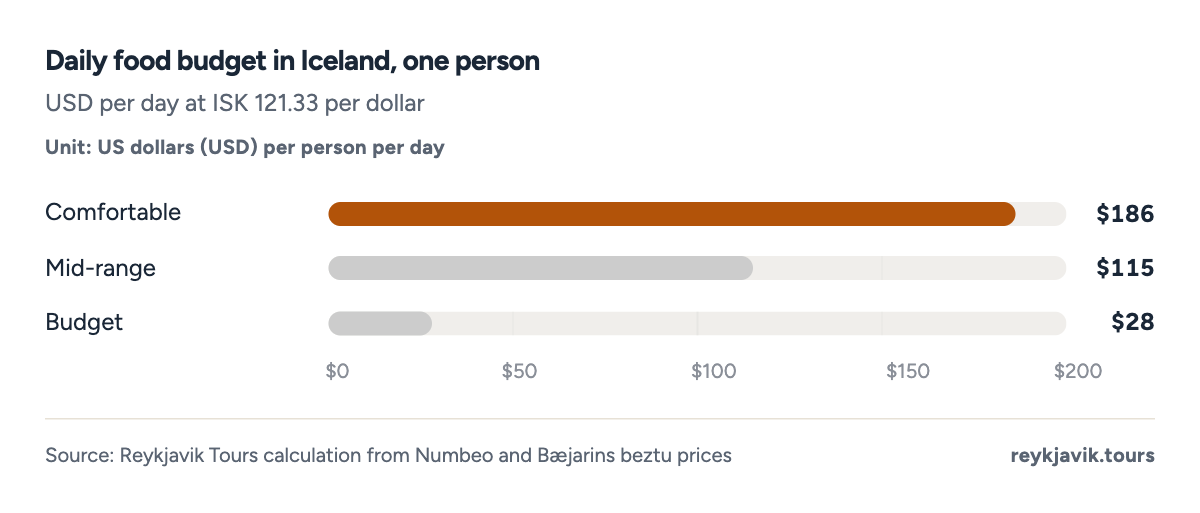
- A self-catering day costs about $28.
- Two restaurant meals a day cost about $186.
| Budget | Self-catering groceries | 2,124 | $17.51 |
| Budget | Hot dog | 880 | $7.25 |
| Budget | Soft drink | 406 | $3.35 |
| Budget | Total per day | 3,410 | $28.11 |
| Mid-range | Breakfast from the supermarket | 992 | $8.18 |
| Mid-range | Cappuccino | 828 | $6.82 |
| Mid-range | Lunch, inexpensive restaurant | 3,650 | $30.08 |
| Mid-range | Dinner, mid-range restaurant (per person) | 8,250 | $68.00 |
| Mid-range | Water, 1.5 litres | 218 | $1.80 |
| Mid-range | Total per day | 13,938 | $114.88 |
| Comfortable | Breakfast from the supermarket | 992 | $8.18 |
| Comfortable | Cappuccino, twice | 1,656 | $13.65 |
| Comfortable | Lunch, mid-range restaurant (per person) | 8,250 | $68.00 |
| Comfortable | Dinner, mid-range restaurant (per person) | 8,250 | $68.00 |
| Comfortable | Draught beer, twice | 3,400 | $28.02 |
| Comfortable | Total per day | 22,548 | $185.84 |
Food inflation in Iceland
Statistics Iceland's consumer price index tracks food prices every month. Since March 1997, food and non-alcoholic drinks have become 251%4 more expensive, slightly less than all consumer prices at 289%4. The two sharpest years for food were 2009, when prices rose 17.5%4 on the year before, and 2008 at 16.0%. The most recent wave peaked at 11.8%4 in 2023, followed by 5.5% in 2024 and 5.5% in 2025.
In the twelve months to August 2026, food prices rose 4.0%4, below the overall inflation rate of 5.6%. Fish rose the most, by 9.9%4, and bread and cereals the least among foods, by 2.1%.
Projection: linear trend of 1998–2025 yearly values, 95% prediction range. Our calculation, not a forecast.
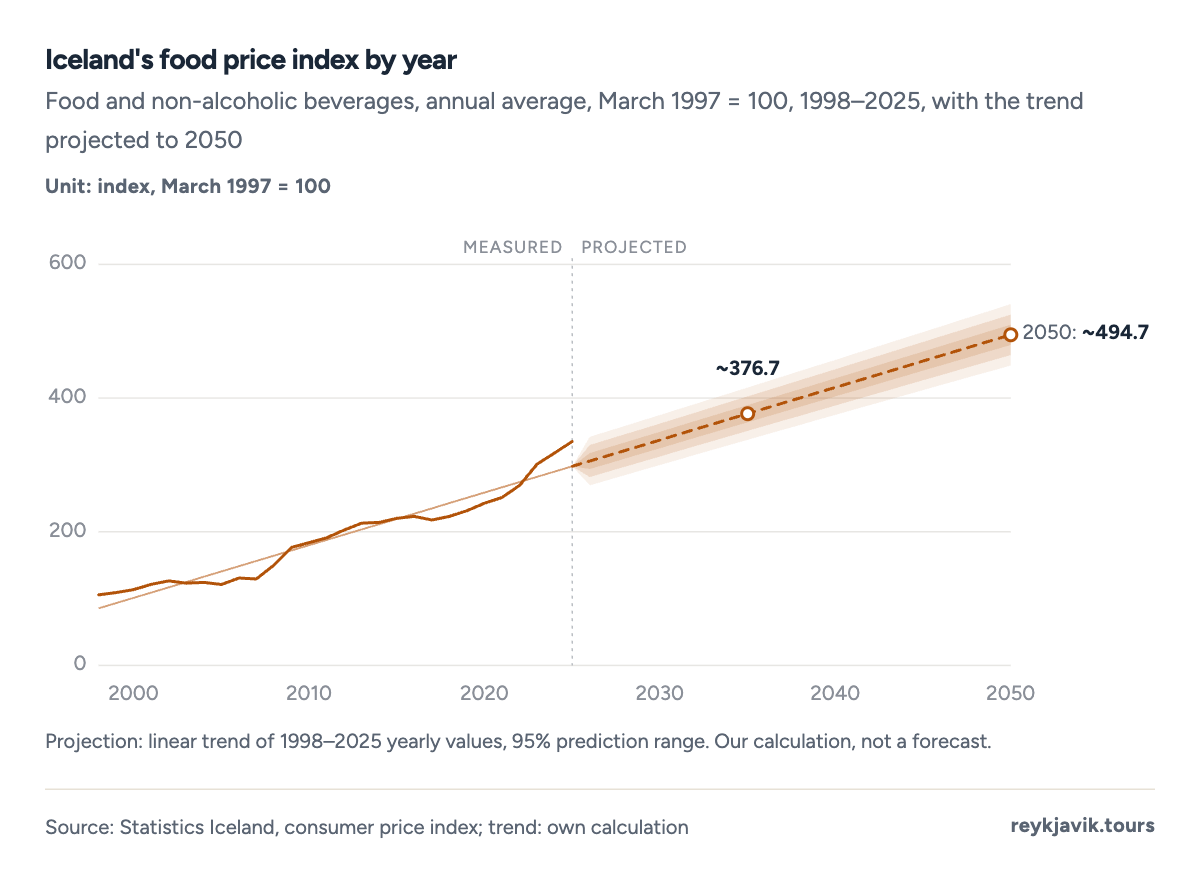
- The index averaged 335.2 in 2025.
- It was 150.1 in 2008, before the steepest rise.
- Food and soft drinks
- All consumer prices
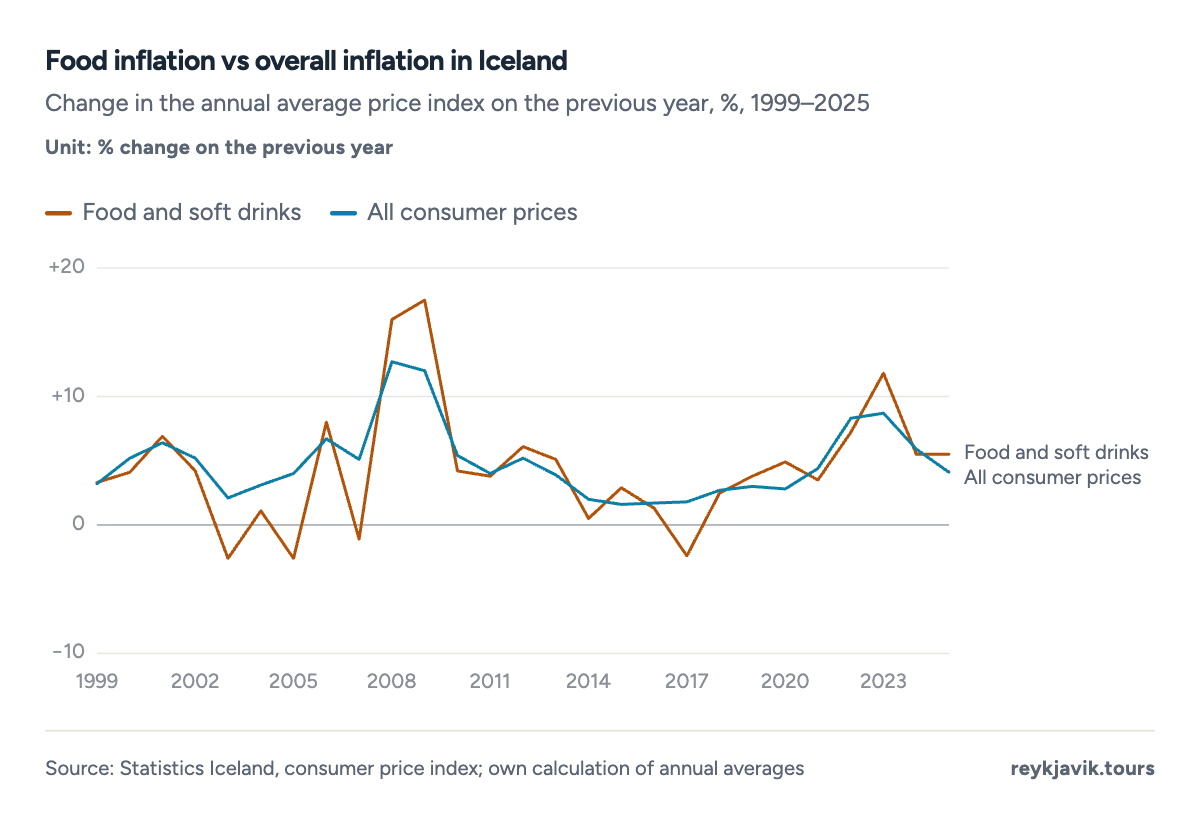
- Food inflation peaked at 17.5% in 2009.
- In 2023 food prices rose 11.8%.
| 2025 | 5.5% | 5.0% | 4.1% |
| 2024 | 5.5% | 6.3% | 5.9% |
| 2023 | 11.8% | 11.4% | 8.7% |
| 2022 | 7.2% | 6.9% | 8.3% |
| 2021 | 3.5% | 3.1% | 4.4% |
| 2020 | 4.9% | 2.3% | 2.8% |
| 2019 | 3.8% | 3.1% | 3.0% |
| 2018 | 2.5% | 2.3% | 2.7% |
| 2017 | −2.4% | 2.8% | 1.8% |
| 2016 | 1.3% | 5.8% | 1.7% |
| 2015 | 2.9% | 6.1% | 1.6% |
| 2014 | 0.5% | 2.9% | 2.0% |
| 2013 | 5.1% | 3.7% | 3.9% |
| 2012 | 6.1% | 5.0% | 5.2% |
| 2011 | 3.8% | 2.3% | 4.0% |
| 2010 | 4.2% | 5.5% | 5.4% |
| 2009 | 17.5% | 10.6% | 12.0% |
| 2008 | 16.0% | 10.6% | 12.7% |
| 2007 | −1.1% | 2.6% | 5.1% |
| 2006 | 8.0% | 4.3% | 6.7% |
| 2005 | −2.6% | 2.7% | 4.0% |
| 2004 | 1.1% | 1.7% | 3.1% |
| 2003 | −2.6% | 0.4% | 2.1% |
| 2002 | 4.2% | 6.4% | 5.2% |
| 2001 | 6.9% | 6.7% | 6.4% |
| 2000 | 4.1% | 5.3% | 5.2% |
| 1999 | 3.3% | 3.5% | 3.2% |
Over five years, the steepest increases were in lamb, up 80.5%4 from August 2021 to August 2026, and coffee, up 69.4%. Meat as a whole rose 57.7%4 and eggs 45.4%. The smallest rises were in alcohol: wine 17.3%4 and beer 25.5%. Over the full period since 1997, poultry is the outlier, up only 80.5%4, while fish and seafood have risen 457%.
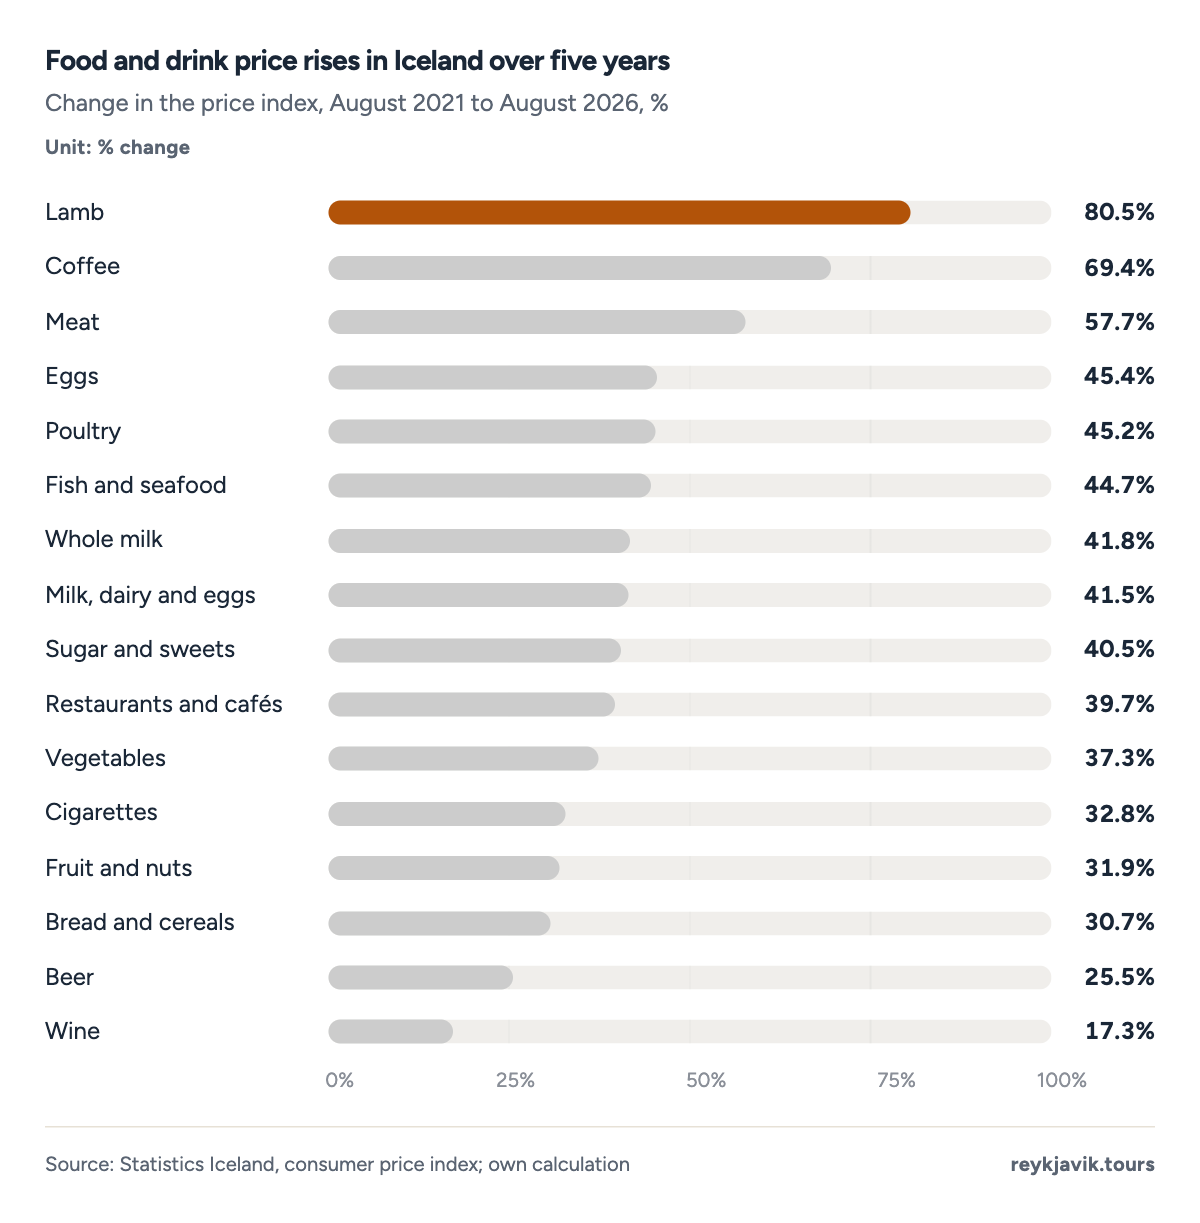
- Lamb rose the most, by 80.5%.
- Wine rose the least, by 17.3%.
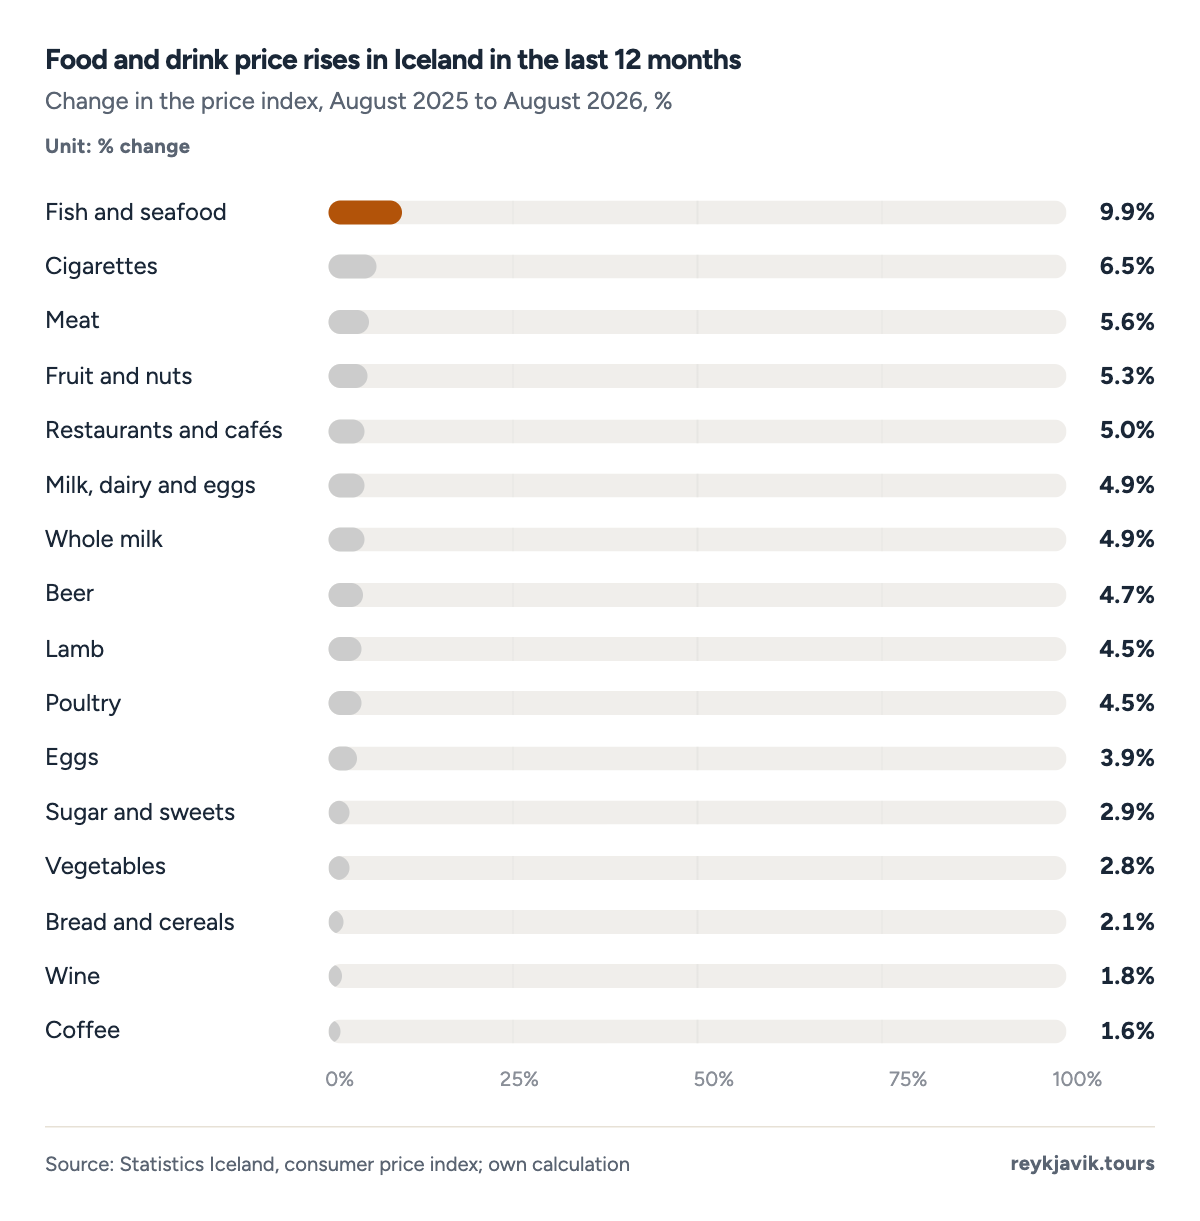
- Fish and seafood rose 9.9%.
- Coffee rose 1.6%.
| Food and soft drinks | 4.0% | 40.2% | 250.9% |
| Bread and cereals | 2.1% | 30.7% | 265.7% |
| Meat | 5.6% | 57.7% | 245.0% |
| Lamb | 4.5% | 80.5% | 339.1% |
| Poultry | 4.5% | 45.2% | 80.5% |
| Fish and seafood | 9.9% | 44.7% | 457.3% |
| Milk, dairy and eggs | 4.9% | 41.5% | 311.2% |
| Whole milk | 4.9% | 41.8% | 303.3% |
| Eggs | 3.9% | 45.4% | 232.3% |
| Fruit and nuts | 5.3% | 31.9% | 203.3% |
| Vegetables | 2.8% | 37.3% | 182.1% |
| Sugar and sweets | 2.9% | 40.5% | 218.7% |
| Coffee | 1.6% | 69.4% | 307.3% |
| Wine | 1.8% | 17.3% | 182.1% |
| Beer | 4.7% | 25.5% | 192.9% |
| Cigarettes | 6.5% | 32.8% | 620.7% |
| Restaurants and cafés | 5.0% | 39.7% | 285.6% |
What households spend on food
In the consumer price index, food and non-alcoholic drinks carry a weight of 15.44%3 of household spending in December 2025, restaurants and cafés 4.34%3, and alcohol and tobacco 2.48%. Together, eating and drinking make up about 22.3%3 of the basket. Among foods, meat has the largest weight at 2.58%, ahead of milk, dairy and eggs at 2.53%.
Statistics Iceland's household expenditure survey, last published for 2013–2016, gives a longer view. Food took 15.9%14 of household spending in 2000–2002, fell to 11.8%14 in 2005–2007 and rose to 15.6% in 2012–2015, before the latest period at 13.1%14.
- Food and soft drinks15.4415.4%
- Restaurants and cafés4.344.3%
- Alcohol and tobacco2.482.5%
- Other77.7477.7%
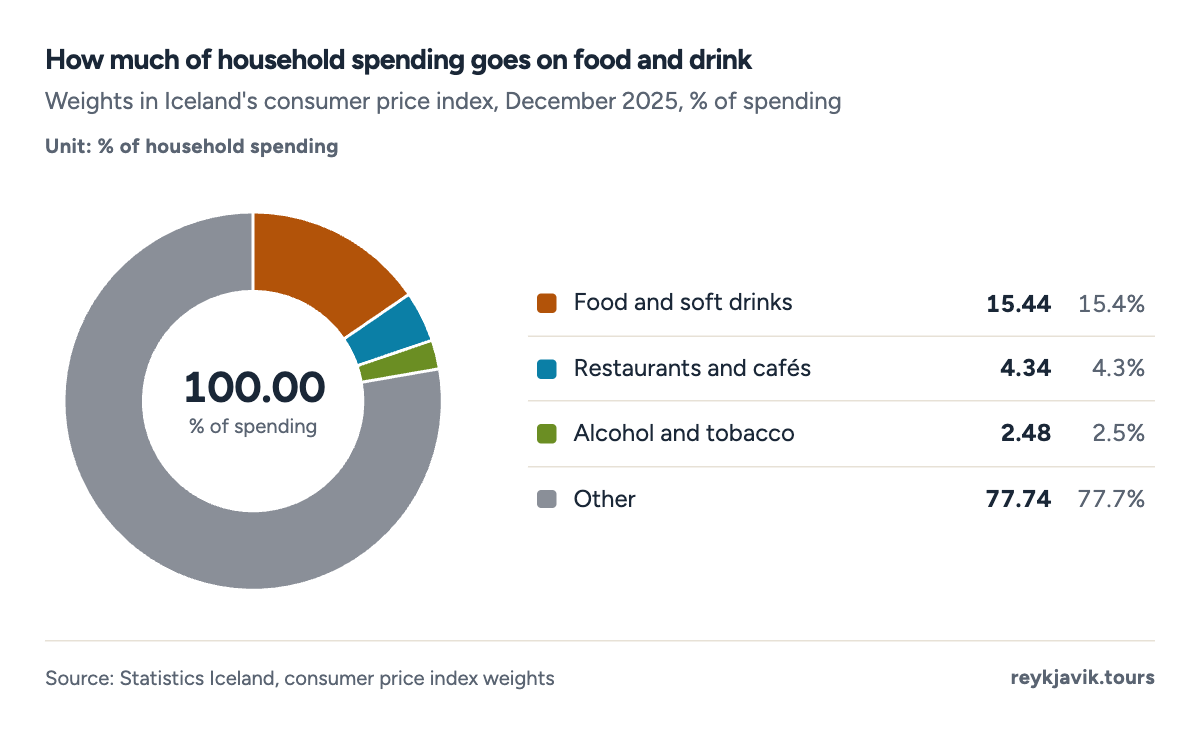
- Food and soft drinks take 15.44%.
- Restaurants and cafés take 4.34%.
- Food and soft drinks
- Catering (restaurants, cafés, canteens)
- Alcohol and tobacco
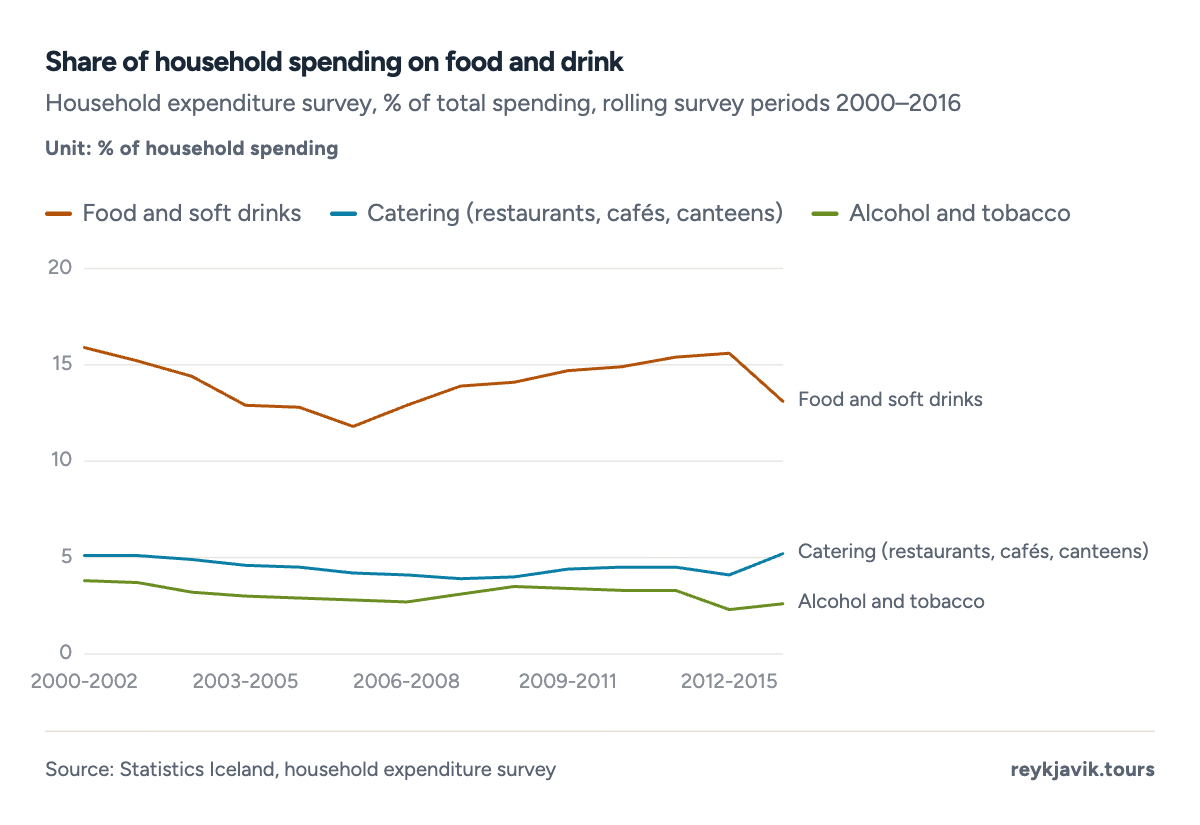
- Food took 15.9% in 2000–2002.
- It took 13.1% in 2013–2016.
Fish and food imports
Two more sets of official figures put food in Iceland in context: how much fish is available per person, and how much food the country imports.
Iceland fish consumption per capita
According to the Food and Agriculture Organization, Iceland had 185 pounds15 (83.8 kg) of fish and seafood available per person in 2023, the highest of 176 countries and territories. That is more than four times the world average of 44 pounds15 and almost four times the US figure of 48 pounds. The figure measures supply per person, not what is actually eaten. It peaked at 204 pounds15 in 2017 and has fallen every year since.
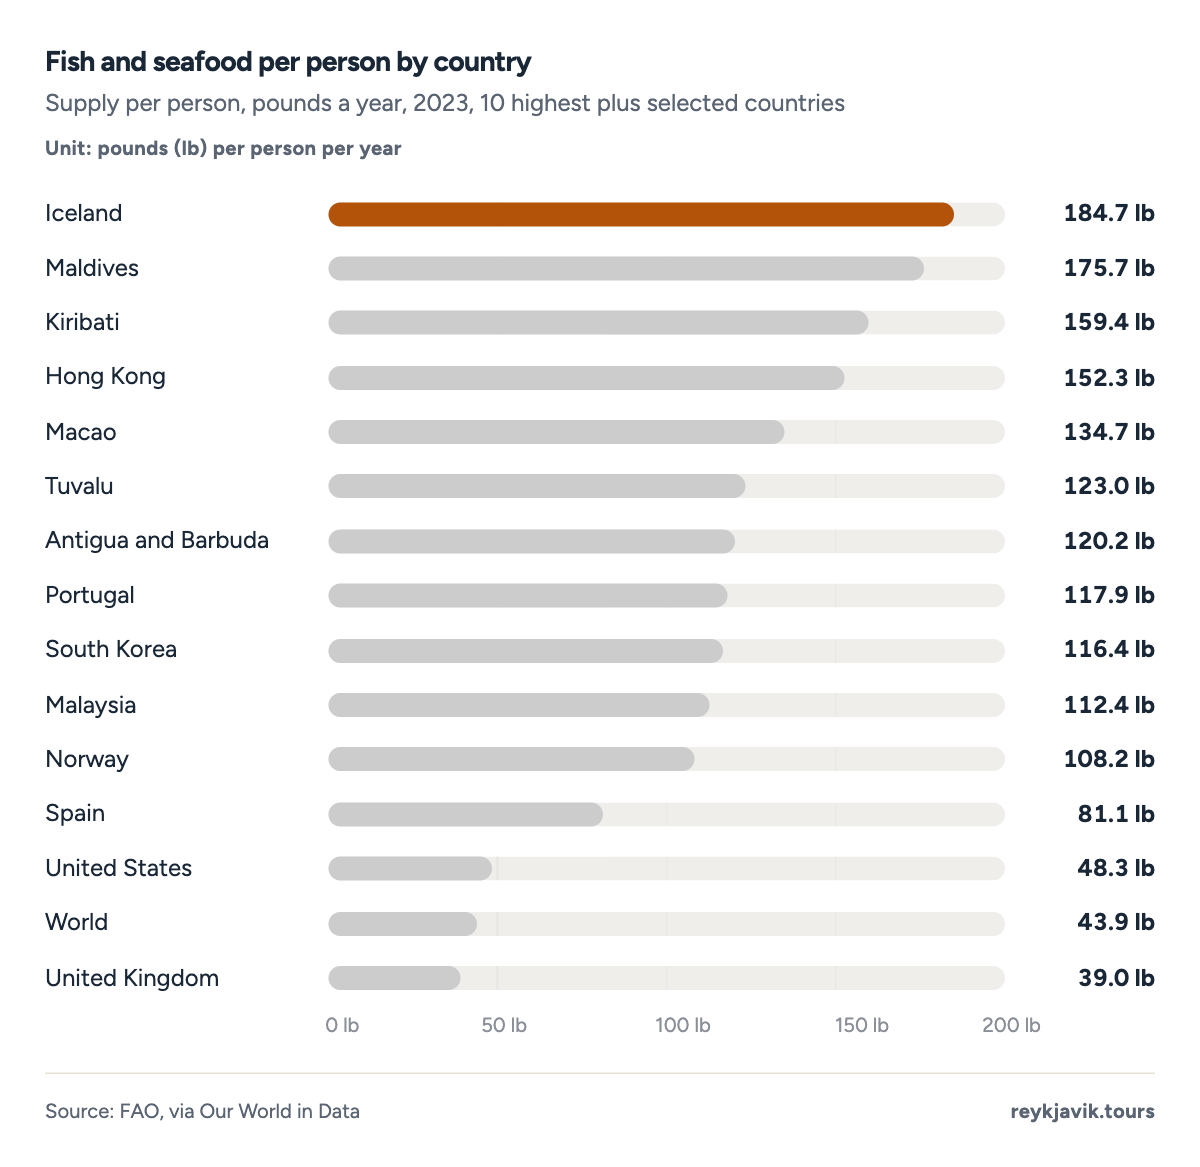
- Iceland is highest at 184.7 lb.
- The US has 48.3 lb.
Projection: linear trend of 1990–2023 yearly values, 95% prediction range. Our calculation, not a forecast.
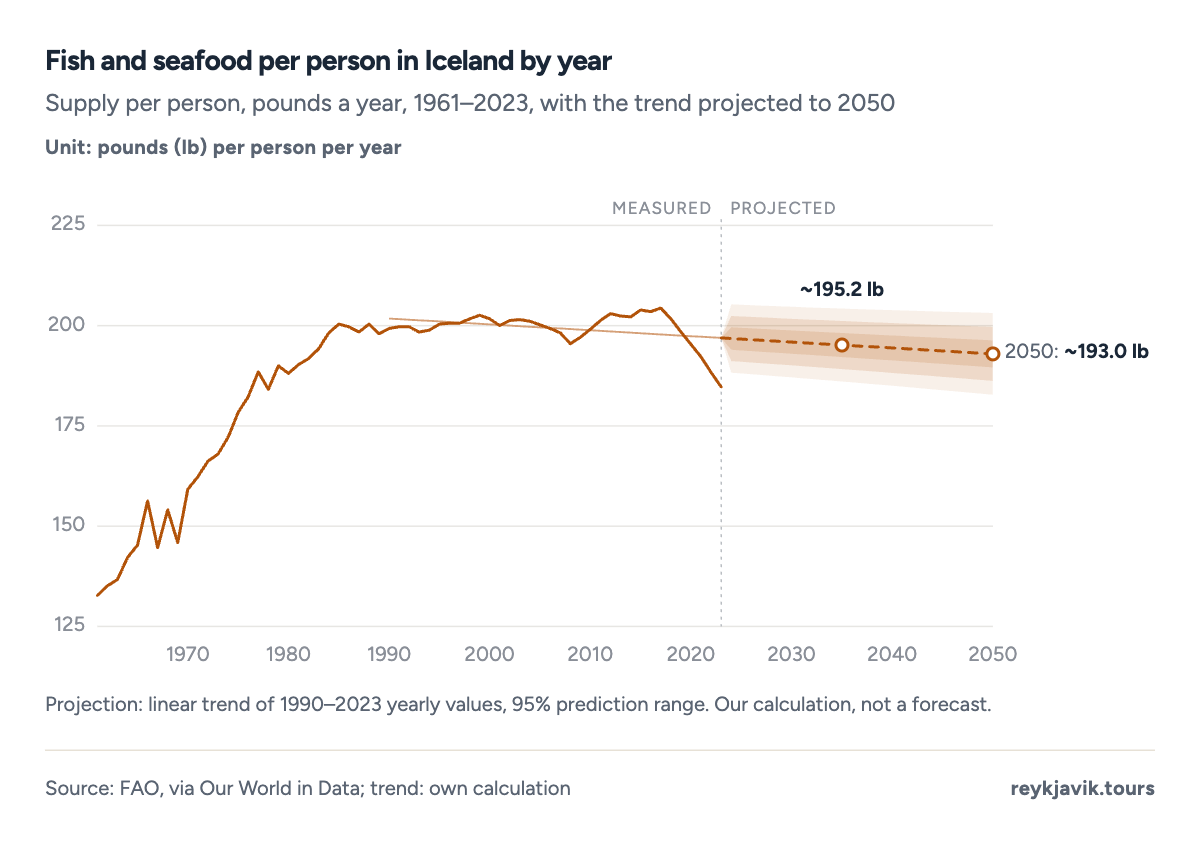
- The peak was 204.4 lb in 2017.
- In 1961 it was 132.7 lb.
| Iceland | 184.7 | 83.8 |
| Maldives | 175.7 | 79.7 |
| Kiribati | 159.4 | 72.3 |
| Hong Kong | 152.3 | 69.1 |
| Macao | 134.7 | 61.1 |
| Tuvalu | 123.0 | 55.8 |
| Antigua and Barbuda | 120.2 | 54.5 |
| Portugal | 117.9 | 53.5 |
| South Korea | 116.4 | 52.8 |
| Malaysia | 112.4 | 51.0 |
| French Polynesia | 111.3 | 50.5 |
| Norway | 108.2 | 49.1 |
| Spain | 81.1 | 36.8 |
| France | 71.9 | 32.6 |
| Denmark | 49.8 | 22.6 |
| United States | 48.3 | 21.9 |
| Canada | 45.9 | 20.8 |
| United Kingdom | 39.0 | 17.7 |
| Germany | 28.7 | 13.0 |
How much food does Iceland import
In 2025, Iceland imported food and live animals, including animal feed, worth ISK 127.3 billion16, about $992 million16 at the year's average exchange rate.5 That was 9.0%16 of all goods imports, almost double the 66.3 billion krónur of 2015. Drinks and tobacco added another ISK 18.5 billion.
The largest items were animal feed (ISK 28.8 billion), vegetables and fruit (ISK 25.3 billion16) and cereals (ISK 19.1 billion). By weight, Iceland brought in about 74,583 US tons16 of vegetables and fruit and 115,475 US tons of cereals. Meat imports reached ISK 8.7 billion and dairy products and eggs ISK 3.1 billion.
Animal feed, dairy and meat imports grew fastest. Between 2015 and 2025 their value rose by 394%16, 360% and 281%16 respectively, while imports of fish and seafood fell by 40%16. Trade statistics do not show how much of what Icelanders eat is imported, so the share of food produced at home cannot be read from these figures.
Projection: linear trend of 2015–2025 yearly values, 95% prediction range. Our calculation, not a forecast.
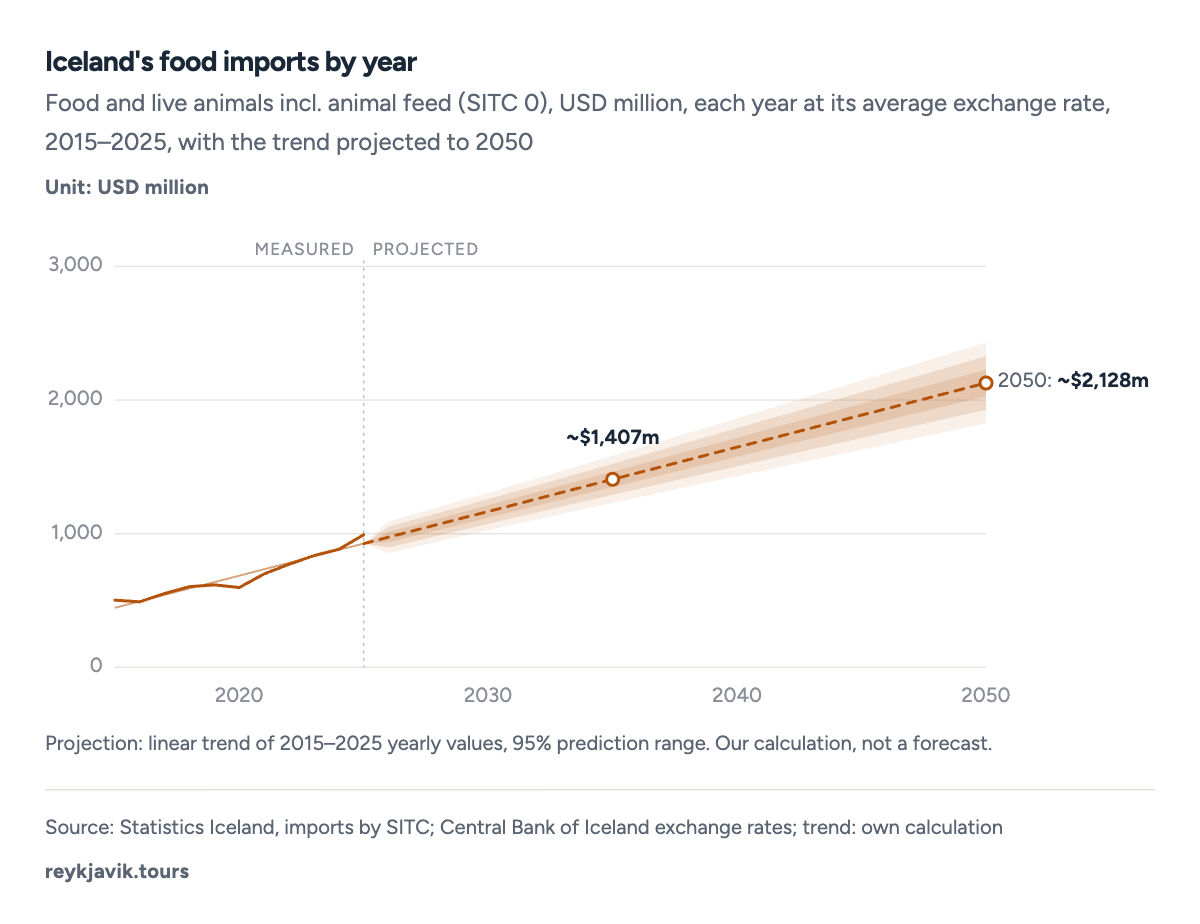
- Food imports reached $992m in 2025.
- They were $503m in 2015.
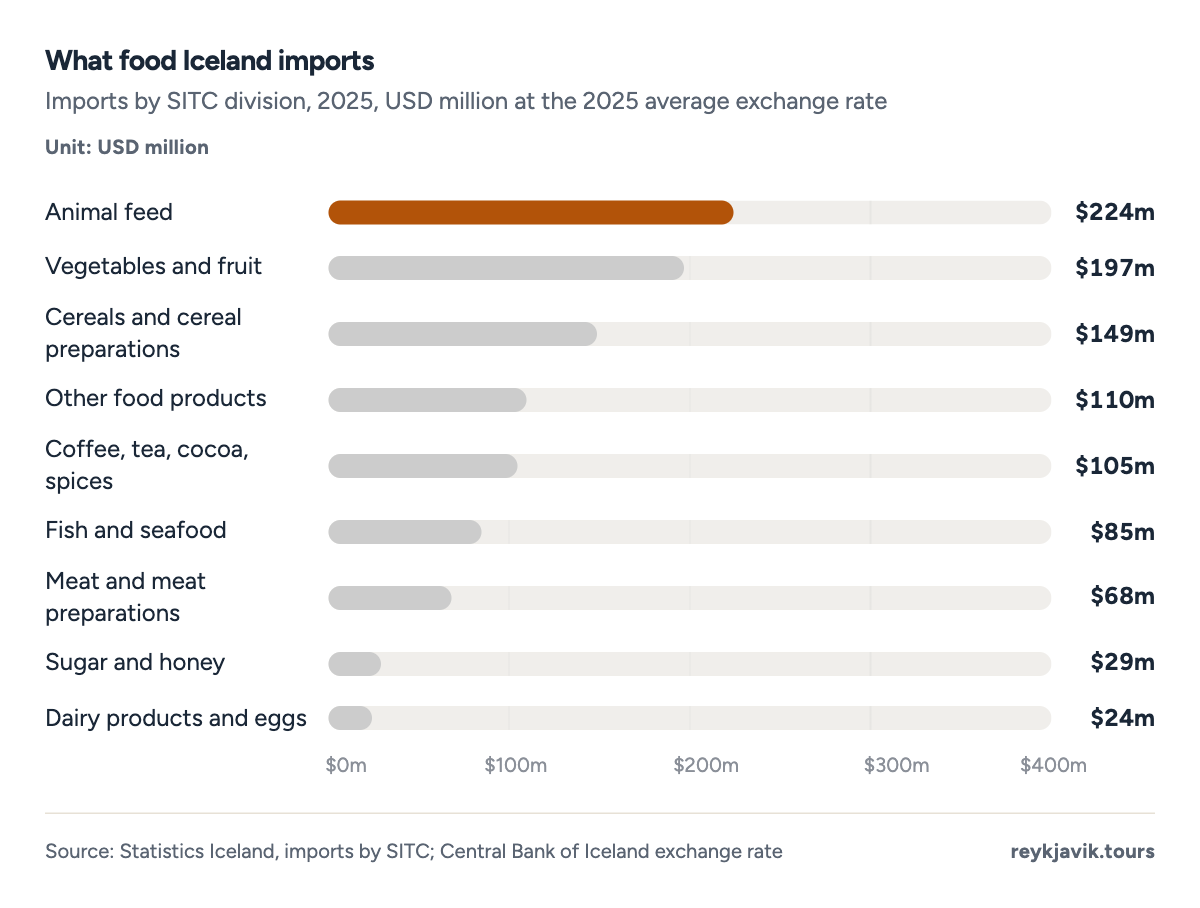
- Animal feed is the largest import at $224m.
- Vegetables and fruit follow at $197m.
| Animal feed | $224m | 28,755 | 154,699 | +394% |
| Vegetables and fruit | $197m | 25,307 | 74,583 | +83% |
| Cereals and cereal preparations | $149m | 19,090 | 115,475 | +91% |
| Beverages | $125m | 16,086 | 51,963 | +190% |
| Other food products | $110m | 14,092 | 16,138 | +89% |
| Coffee, tea, cocoa, spices | $105m | 13,470 | 8,344 | +136% |
| Fish and seafood | $85m | 10,963 | 33,302 | -40% |
| Meat and meat preparations | $68m | 8,722 | 7,706 | +281% |
| Sugar and honey | $29m | 3,744 | 14,310 | +79% |
| Dairy products and eggs | $24m | 3,082 | 2,921 | +360% |
| Tobacco and tobacco manufactures | $18m | 2,369 | 218 | +23% |
| Live animals | $1m | 102 | 9 | +68% |
What the numbers mean
For a visitor, the price of food in Iceland is mostly a question of where you eat. A day of self-catering costs about $28, while two restaurant meals a day cost more than six times as much. Drinks widen the gap further: a draught beer in a bar costs more than three times as much as a can from Vínbúðin, and taxes make up more than half of that can's shop price.
For households, the store matters as much as the product. ASÍ found the same basket 12% dearer at one discount chain than at another, and Kjörbúðin and Hagkaup about 30% dearer than the cheapest option. Food carries more than 15% of the consumer price index, so food inflation of 11.8% in 2023 and 5.5% in both 2024 and 2025 fed directly into the cost of living as measured by Statistics Iceland.
The fish figures sit alongside the price data: Iceland has more fish per person than anywhere else, and fish is also its least expensive food category relative to Europe, while dairy, meat and bread rank among the most expensive in Europe.
Conclusions
- Food in Iceland is among the most expensive in Europe: its price level of 143.91 is second only to Switzerland, with dairy, meat and bread at the top of the European range and fish the main exception at 110.11.
- Drinks and tobacco carry the biggest premium. Alcohol's price level of 285.11 is the highest in Europe, and duty plus VAT make up about 53%13 of the price of a can of beer and 67%13 of a pack of cigarettes.
- Choice of store is the easiest saving. The same 25-item basket cost 12%6 more at Nettó than at Prís, and the median gap between the cheapest and dearest store for the same product was 42%6.
- Food prices have risen faster than overall prices in recent years: 40.2%4 for food against 37.3%4 for all consumer prices in the five years to August 2026, led by lamb and coffee.
Methodology
- Price levels 2003–2024
- Consumer prices 1997–Aug 2026
- Shop and menu prices Aug–Sept 2026
- USD 1 = ISK 121.33
Definition. Food prices here are what consumers pay in Iceland for groceries, restaurant meals, non-alcoholic and alcoholic drinks and tobacco, including VAT and duties. Price level indices compare the cost of the same basket across countries (EU average = 100).
Data sources. Price level indices from Eurostat;1 consumer price subindices, weights and the household expenditure survey from Statistics Iceland;4 food imports from Statistics Iceland's trade statistics;16 exchange rates from the Central Bank of Iceland;5 supermarket comparisons from ASÍ's price monitoring;6 item and menu prices from Numbeo (crowd-sourced);2 the hot dog price from DV;8 beer shelf prices from Vínfinnur;12 duty rates from Act 96/1995 and Skatturinn;9 VAT from Act 50/1988;11 and fish supply from FAO via Our World in Data.15
Calculations. Current prices are converted at USD 1 = ISK 121.33 (Central Bank of Iceland, 15 Sept 2026); yearly import values at each year's average rate. Food inflation = change in the annual average of the monthly index. Alcohol duty = (alcohol % − 2.25) × rate × litres for beer and wine, alcohol % × rate × litres for spirits; VAT share = price × 11/111 (24/124 for cigarettes). Daily budgets add Numbeo prices: budget = a self-catering day (½ loaf of bread, 1 L milk, 3 eggs, 100 g cheese, 200 g chicken, 100 g rice, 300 g apples and bananas, 200 g tomatoes, 1.5 L water) + hot dog + soft drink; mid-range = supermarket breakfast + cappuccino + inexpensive lunch + half of a mid-range dinner for two + water; comfortable = supermarket breakfast + 2 cappuccinos + 2 × half a mid-range dinner for two + 2 draught beers.
Limitations. Numbeo and Vínfinnur prices are commercial and crowd-sourced or scraped, not official. Eurostat price levels are for 2024. The household expenditure survey has not been published since 2013–2016. Tax shares use one shelf price per item and ignore the retailer's margin. The food import total (SITC 0) includes animal feed and live animals. FAO fish figures measure supply per person, not consumption. The hot dog price dates from March 2026.
Sources
- Eurostat. “Purchasing power parities, price level indices for food, beverages, tobacco and restaurants (prc_ppp_ind), 2003–2024.” European Commission. ec.europa.eu. Accessed 16 Sept. 2026. Back to text
- Numbeo. “Cost of living in Reykjavík.” Numbeo (crowd-sourced, commercial), 28 Aug. 2026. numbeo.com. Accessed 16 Sept. 2026. Back to text
- Statistics Iceland (Hagstofa Íslands). “Consumer price index weights, December 2025.” Statistics Iceland. px.hagstofa.is. Accessed 16 Sept. 2026. Back to text
- Statistics Iceland (Hagstofa Íslands). “Consumer price index: subindices (March 1997 = 100) and CPI since 1988.” Statistics Iceland, Aug. 2026. px.hagstofa.is. Accessed 16 Sept. 2026. Back to text
- Central Bank of Iceland (Seðlabanki Íslands). “Official exchange rate, USD/ISK.” Central Bank of Iceland. sedlabanki.is. Accessed 16 Sept. 2026. Back to text
- ASÍ price monitoring (Verðlagseftirlit ASÍ). “Prís ódýrast í nær allri verðkönnuninni; Verð hækkar lítillega en mikill verðmunur áfram milli verslana.” Icelandic Confederation of Labour (ASÍ), 21 Aug. and 1 Sept. 2026. asi.is. Accessed 16 Sept. 2026. Back to text
- Vísir. “Lægsta matvöruverðið enn oftast að finna í Prís (ASÍ price survey, 8–14 June 2026).” Vísir (press report), 18 June 2026. visir.is. Accessed 16 Sept. 2026. Back to text
- DV. “Pylsa og kók kostar nú 1.330 krónur.” DV (press report), 24 March 2026. dv.is. Accessed 16 Sept. 2026. Back to text
- Alþingi. “Act no. 96/1995 on alcohol and tobacco duties, article 3 (rates in force 2026).” Parliament of Iceland. althingi.is. Accessed 16 Sept. 2026. Back to text
- Skatturinn (Iceland Revenue and Customs). “Breytingar á tollskrá, aðflutningsgjöldum og fleira sem tekur gildi 1. janúar 2026.” Skatturinn. skatturinn.is. Accessed 16 Sept. 2026. Back to text
- Alþingi. “Act no. 50/1988 on value added tax, article 14.” Parliament of Iceland. althingi.is. Accessed 16 Sept. 2026. Back to text
- Vínfinnur. “Egils Gull 500 ml: price comparison of Icelandic alcohol shops.” Vínfinnur (commercial). vinfinnur.is. Accessed 16 Sept. 2026. Back to text
- Reykjavik Tours research. “Daily food budget and tax per drink in Iceland: calculation and assumptions.” Reykjavik Tours. reykjavik.tours. Accessed 16 Sept. 2026. Back to text
- Statistics Iceland (Hagstofa Íslands). “Household expenditure survey: household spending by COICOP, 2000–2016.” Statistics Iceland. px.hagstofa.is. Accessed 16 Sept. 2026. Back to text
- Food and Agriculture Organization of the United Nations (FAO), via Our World in Data. “Fish and seafood supply per person, 1961–2023.” Our World in Data. ourworldindata.org. Accessed 16 Sept. 2026. Back to text
- Statistics Iceland (Hagstofa Íslands). “Imports by SITC 1 and 2, Rev. 4, and countries, 2015–2026.” Statistics Iceland. px.hagstofa.is. Accessed 16 Sept. 2026. Back to text
About the author
Laufey turns public statistics on tourism and travel into research people can check and cite.
Every figure on this page links to its source. How we research
Related research
More data on Iceland's weather and travel from Reykjavik Tours.
- PricesHow Much Is Gas in Iceland? (2026 Data)259 ISK average petrol price in Iceland, per litreRead the research →
- Travel costsHow Much Are Hotels in Iceland? (2026 Data)$196 a night for a typical hotel roomRead the research →
- TravelHow Much Is a Trip to Iceland? (2026 Data)$1,766 average a visitor spends in IcelandRead the research →
- HousingAverage Rent in Iceland (2026 Data)ISK 269k average monthly rent in IcelandRead the research →
- HousingHow Much Is a House in Iceland? (2026 Data)$467k-779k typical capital-region apartmentRead the research →
- TransportHow Many Airports in Iceland? (2026 Data)33 airports in IcelandRead the research →